The correction that Bitcoin (BTC) suffered over the past 24 hours has triggered conversations around its correlation with the M2 Money supply. Analysts like Raoul pal and Abra CEO are using Bitcoin Vs M2 money supply co-relation to predict Bitcoin price. Bitcoin to $130k in August/September This Year? Abra Global CEO Bill Barhydt shared his analysis on the rising Bitcoin Vs M2 money supply trend via via his X account. The consensus is that with the growth in the global money supply, risk-on assets like BTC benefit significantly. The concept is simple: the more money in circulation, the more devalued fiat is, granting emerging hedges like Bitcoin more value. Source: X, Bitcoin Vs M2 Money Supply According to him, most trending charts predict a short-term bearish outlook. He most likely highlighted the likelihood of Bitcoin price dropping to $100,000 in the coming days before it pushed to a new all-time… Read More at Coingape.com
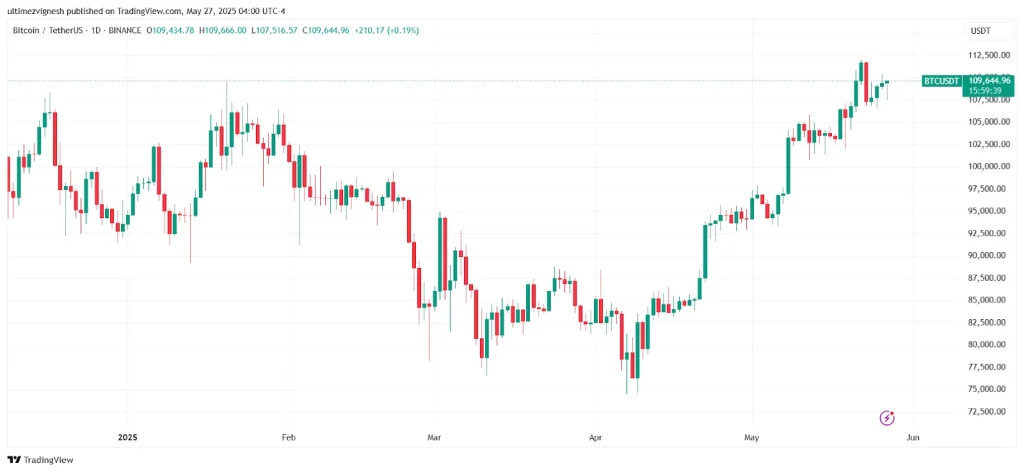
In the last 30 days, Bitcoin has seen a growth of at least 16%, with a 3.3% surge in just the past seven days. Currently, Bitcoin’s price sits at $109,031. A new research-based analysis predicts that Bitcoin could reach $135K by July 2025, driven by its correlation with the US M2 money supply.
Bitcoin & M2 Correlation Explained
The analysis, shared by crypto analyst Wise Advice, highlights the strong connection between Bitcoin’s price action and the US M2 money supply. M2 includes physical currency, checking deposits, saving accounts, and money market funds. When M2 increases, it signals more liquidity in the financial system, which often flows into risk assets like Bitcoin.
Bitcoin typically mirrors the movement of M2 with a 10-12 week lag. Recently, the M2 money supply saw a 2.7% rise, increasing from $107.5 trillion to $110.72 trillion.
Wise Advice notes that this pattern has been evident since 2023:
October 2024: M2 peaked, and approximately 90 days later, Bitcoin reached a peak of $109K on January 20, 2025.
April 2025: After M2’s January drop, Bitcoin dropped to a low of $74K by April 7, 2025.
These instances demonstrate that Bitcoin’s price generally follows the M2 movement with a 10-12 week lag.
BTC Price Prediction
Currently sitting at $109K, Wise Advice predicts that if this pattern repeats, Bitcoin could grow by at least 24%, reaching $135K by July. The analysis also suggests that this surge in Bitcoin’s price could trigger a rally in altcoins as well.
Never Miss a Beat in the Crypto World!
Stay ahead with breaking news, expert analysis, and real-time updates on the latest trends in Bitcoin, altcoins, DeFi, NFTs, and more.
The post Bitcoin Price to Hit $135K by July 2025 appeared first on Coinpedia Fintech News
In the last 30 days, Bitcoin has seen a growth of at least 16%, with a 3.3% surge in just the past seven days. Currently, Bitcoin’s price sits at $109,031. A new research-based analysis predicts that Bitcoin could reach $135K by July 2025, driven by its correlation with the US M2 money supply. Bitcoin & …
Ethereum cofounder Jeffrey Wilcke has triggered a wave of pessimism for ETH after a hefty asset transfer to Kraken. On-chain data reveals that Wilcke moved 105,736 ETH to Kraken, stoking concerns of a mass sale, but a closer look paints a benign picture. Investors Raise Eyebrows After An Ethereum Cofounder Transfers 105,736 ETH Jeffrey Wilcke, one of Ethereum’s eight cofounders, has moved almost all of his ETH holdings to the Kraken exchange. According to on-chain data, the Ethereum cofounder transferred 105,736 ETH valued at $262 million at current prices. The movement of a sizable amount of ETH to a centralized exchange has raised eyebrows, with sell-off concerns reaching a fervent pitch. At the moment, the bearish signal has gained momentum with ETH prices tumbling by nearly 2% within minutes of Wilcke’s Kraken transfer. This is not the first time Wilcke has been whipping up bearish sentiments in the markets with… Read More at Coingape.com
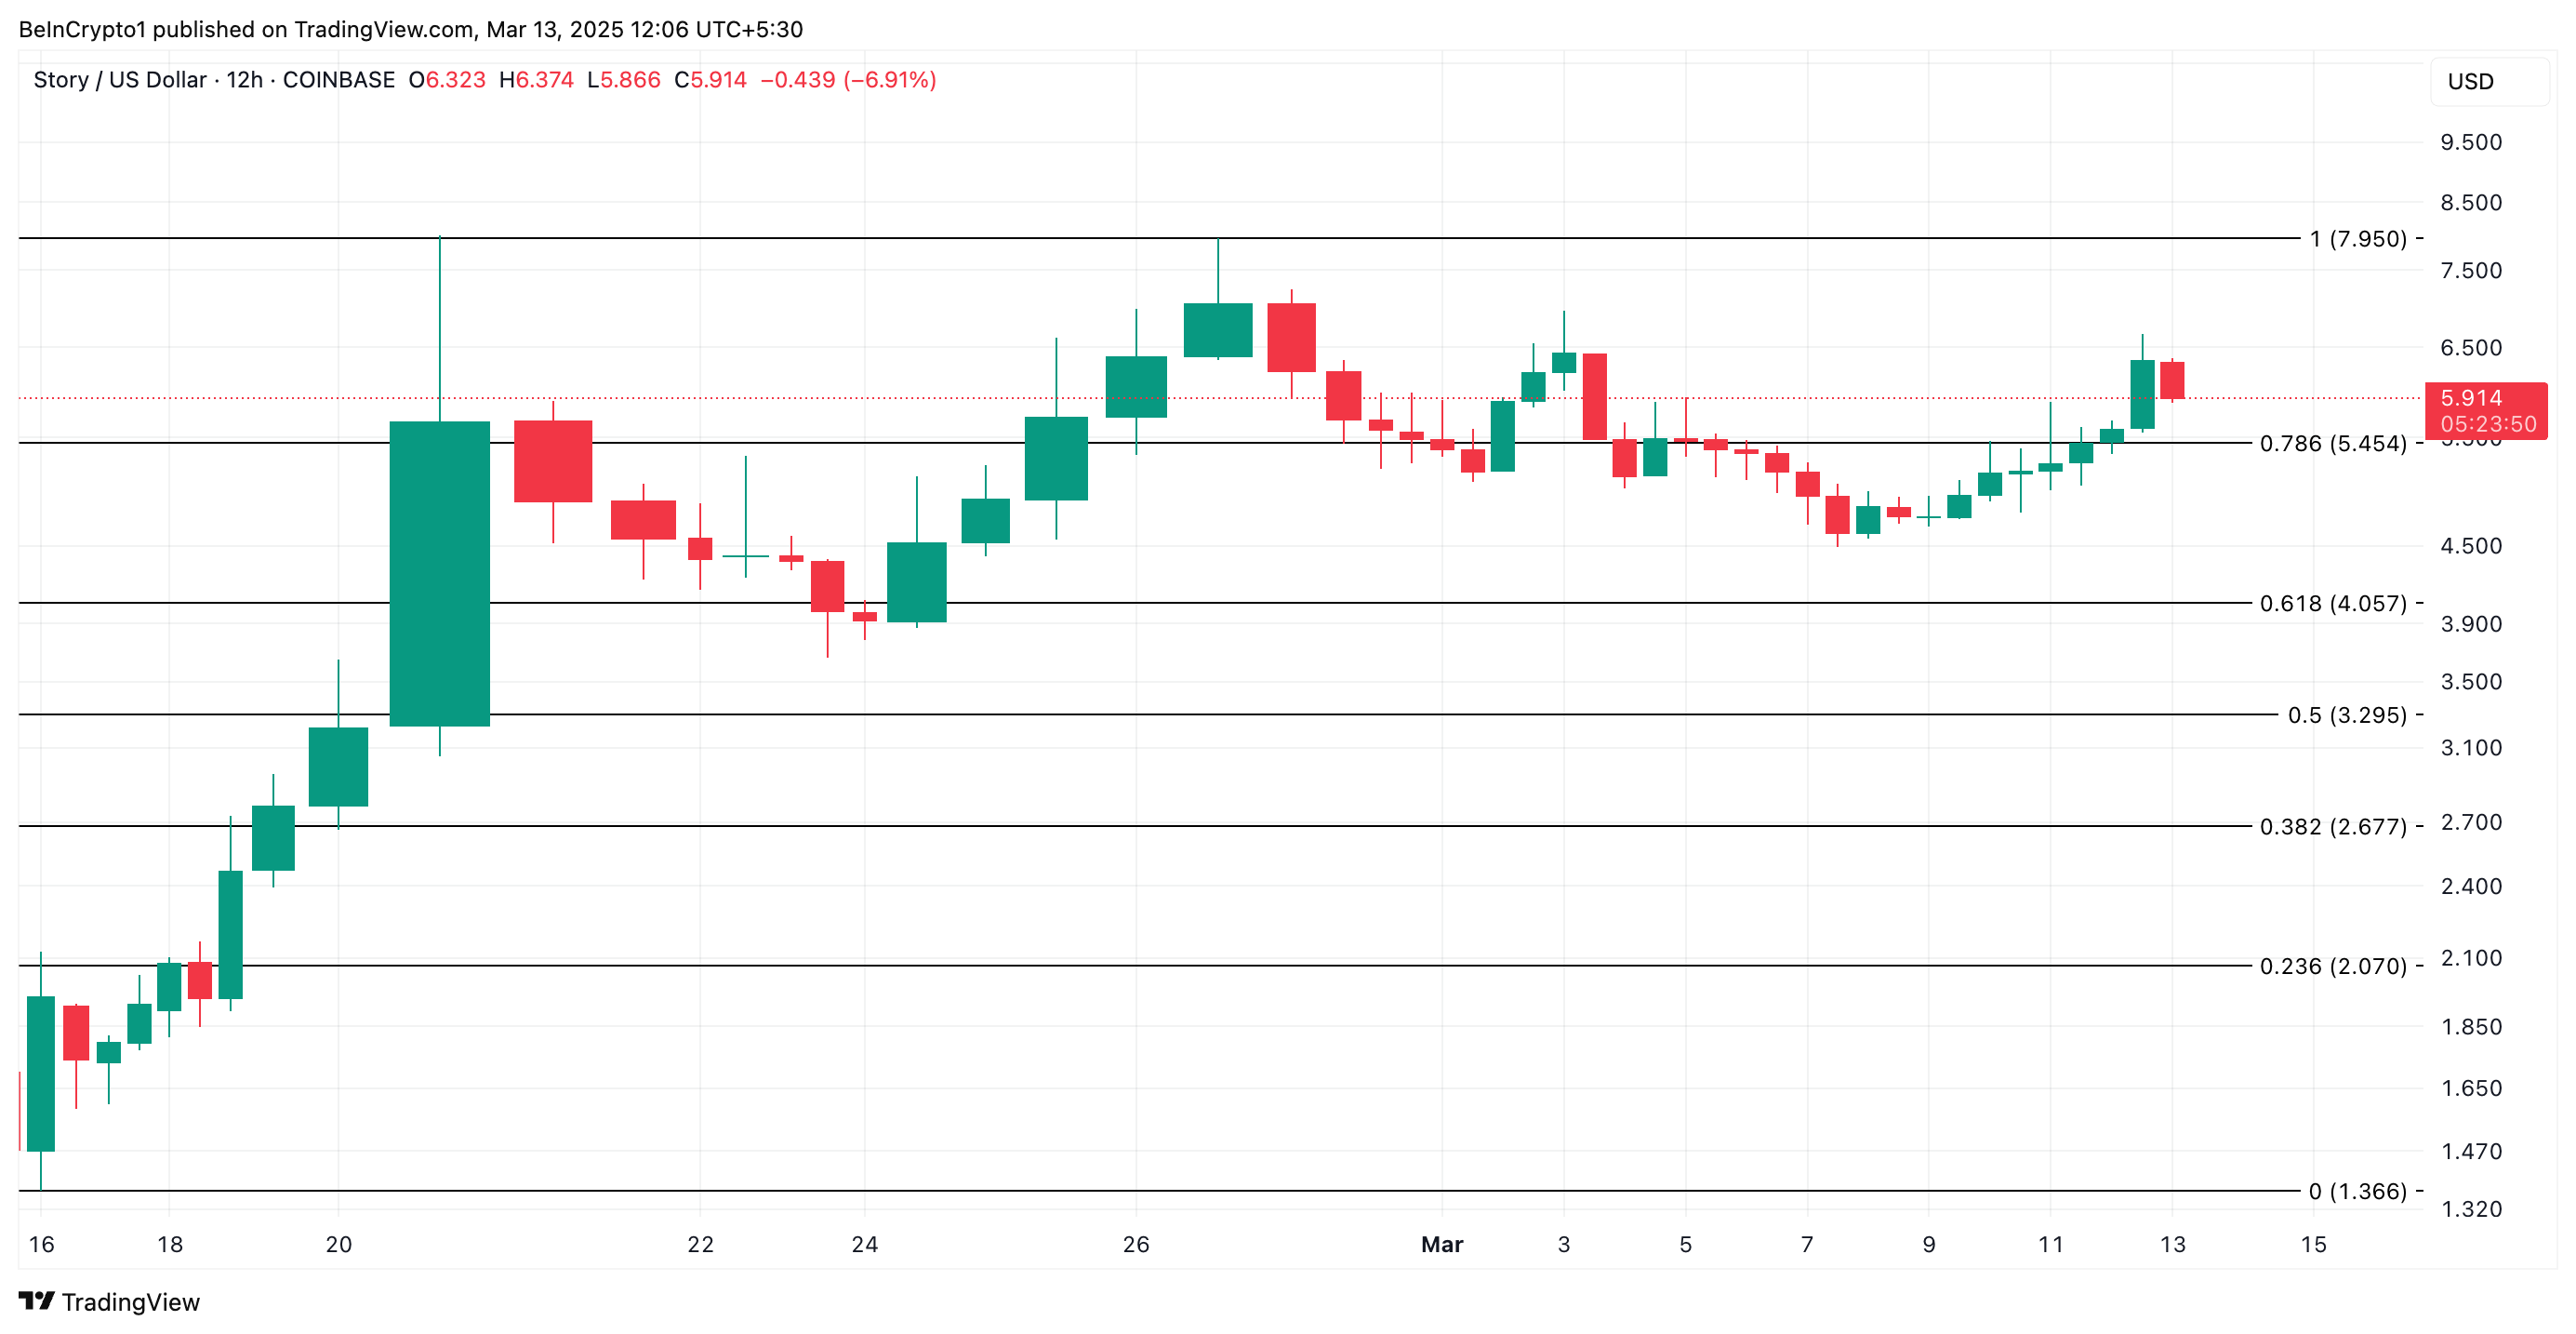
Story’s IP has extended its bullish streak, recording another day of gains as its uptrend continues. In the last 24 hours alone, IP has surged 11%, making it the second-highest gainer during this period.
Over the past week, the altcoin has climbed 17%, bucking the broader market decline and solidifying its position as one of the strongest performers.
IP’s Short-Term Outlook Remains Bullish as Buying Pressure Builds
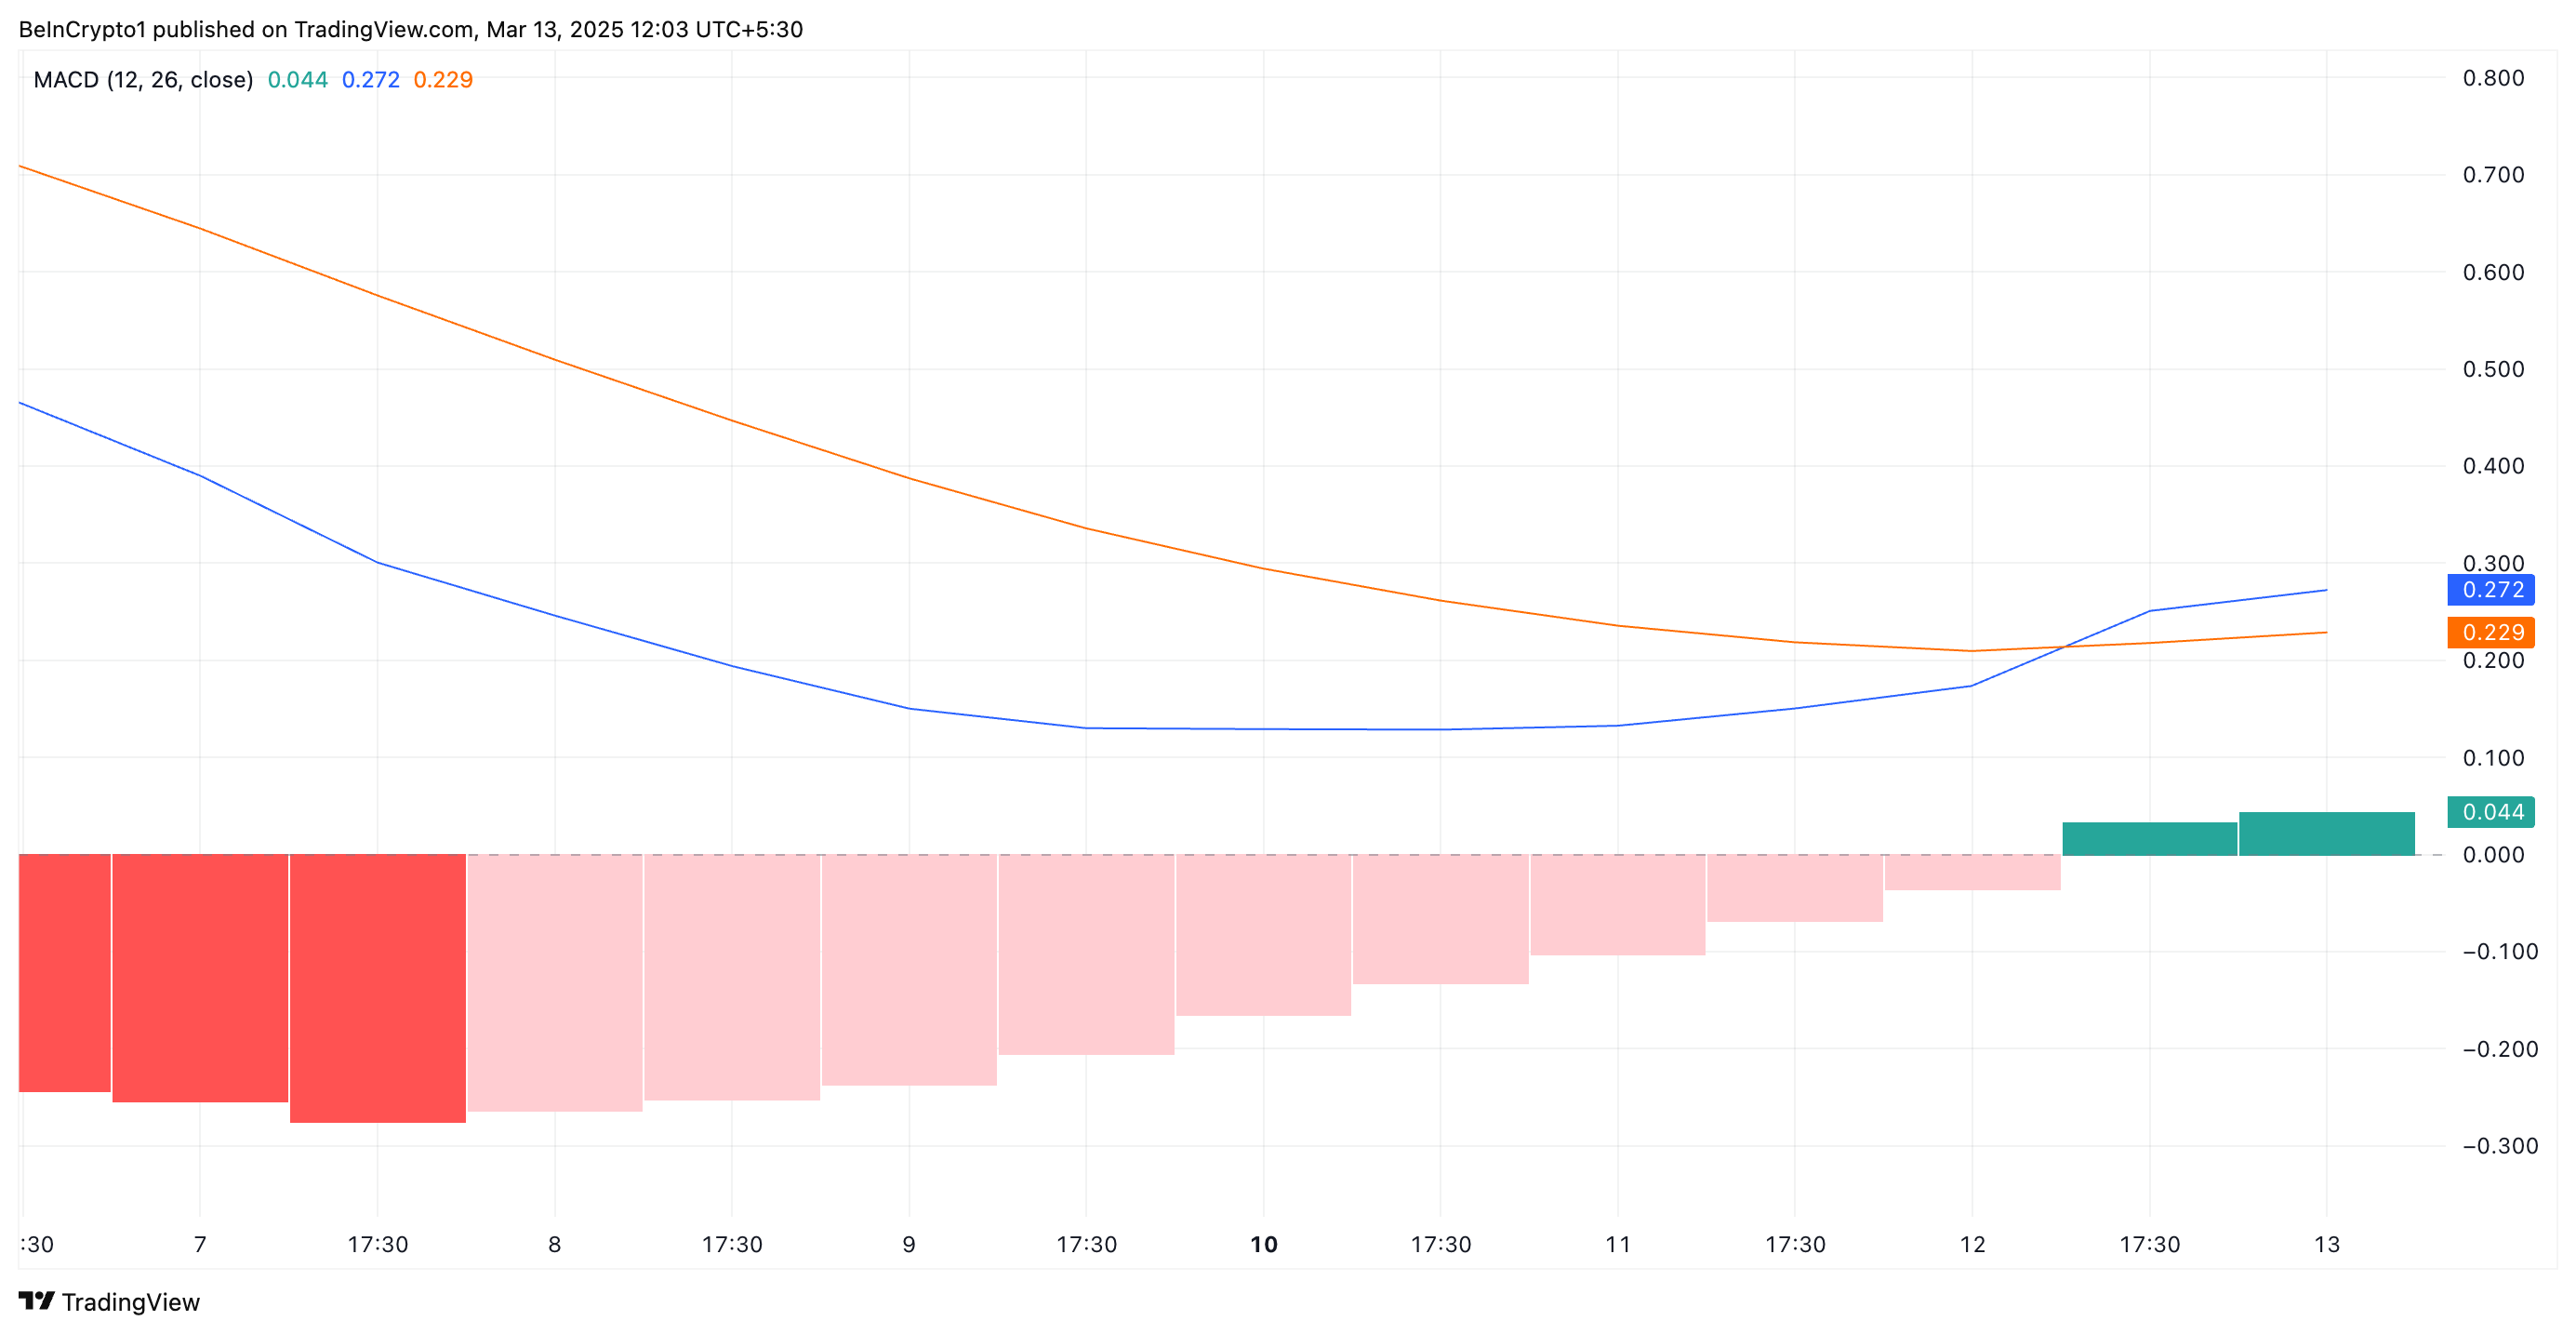
Readings from the IP 12-hour chart hint at a sustained price growth in the short term. For example, the coin’s Moving Average Convergence Divergence (MACD) supports this bullish outlook.
After spending an extended period below the signal line (orange), IP’s MACD line (blue) flipped above it during Wednesday’s trading session, posting a green histogram bar.
This bullish crossover suggests a bullish shift in momentum, indicating increasing buying pressure. The appearance of a green histogram bar reinforces the strength of this trend, signaling that IP’s uptrend could continue. If sustained, this momentum may attract more traders, potentially driving the coin’s price even higher.
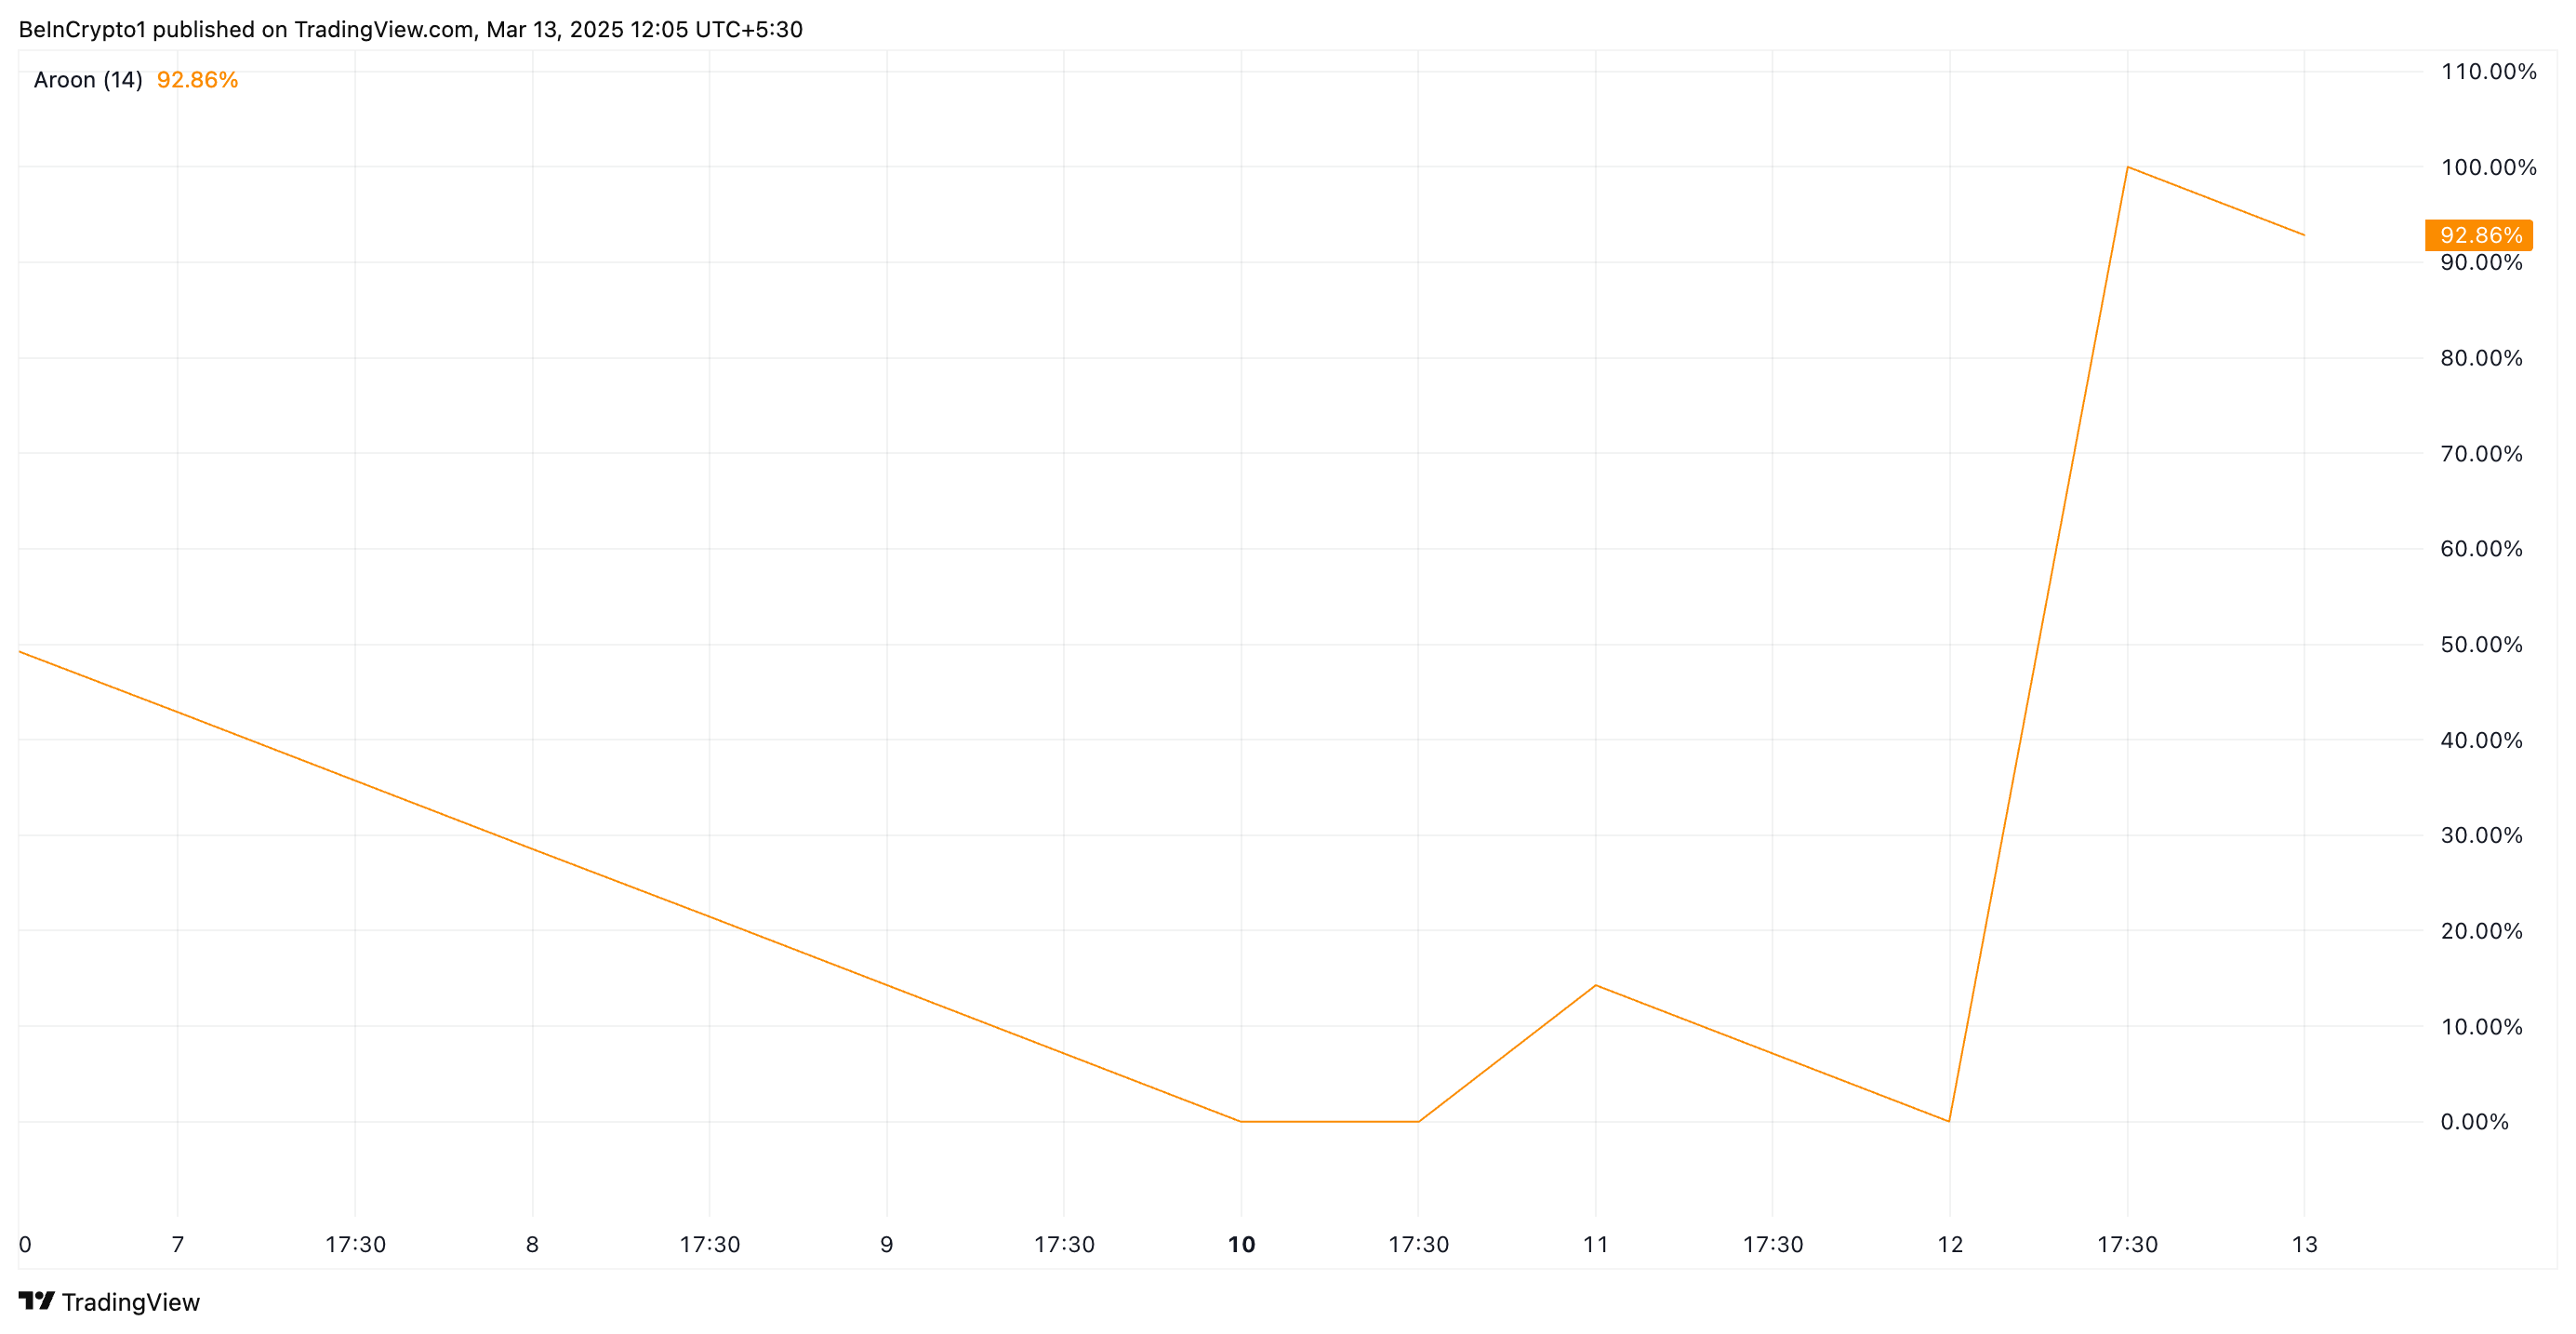
Additionally, IP’s Aroon Up Line, which tracks the strength of its trends, confirms that the current rally is still intact, indicating that the uptrend may not be slowing down anytime soon. At press time, this indicator is at 92.86%.
When an asset’s Aroon Up Line is close to 100%, it indicates a strong uptrend. The metric suggests that IP is consistently reaching new highs within the review period. This is true of the coin, which currently trades at $5.91, its highest since March 8.
IP Holds Strong Above Support—Can It Reclaim Its $7.95 All-Time High?
At its current price, IP trades strongly above the support floor formed at $5.54. If the bullish pressure in its spot markets remains, IP could continue its upward trend and attempt to revisit its all-time high of $7.95.
On the other hand, a resurgence in profit-taking among IP holders would invalidate this bullish projection. In that scenario, the coin could lose its recent gains, fall below the $5.54 support, and drop toward $4.05.