The post What Are SEC’s New “Covered Stablecoins”? Tether’s USDT May Not Qualify! appeared first on Coinpedia Fintech News
In a rare and clear move, the U.S. Securities and Exchange Commission (SEC) has introduced new guidance that could significantly impact the stablecoin market. The agency said that certain stablecoins – now called “covered stablecoins” – may not be treated as securities, as long as they follow strict conditions.
The crypto industry has already begun to respond. Tether, one of the largest stablecoin issuers, is reportedly considering changing its strategy to fit within the SEC’s new framework.
“Covered Stablecoins are not marketed as investments; rather, they are marketed as a stable, quick, reliable and accessible means of transferring value, or storing value and not for potential profit or as investments,” the SEC stated.
What Exactly Is a “Covered Stablecoin”?
The SEC explained that covered stablecoins are not offered as investment products. Instead, they’re presented as a stable, fast, and accessible way to send or store money—not something to make a profit from.
To qualify as a covered stablecoin, the token must meet several key requirements:
- Be fully backed 1:1 by the U.S. dollar
- Be supported by low-risk, highly liquid assets
- Be redeemable at full value at any time
These stablecoins must not offer interest, promise profits, give voting rights, or represent any form of ownership. They are meant strictly for use in payments, transfers, or storing value—not as investments.
Since they’re sold as “digital dollars” and not investment opportunities, the SEC says these stablecoins don’t count as securities under U.S. law. This kind of clarity is unusual for the SEC, which often takes a more cautious or enforcement-first approach to crypto.
Also Read: FTX Rejects Nearly 400,000 Claims Worth $2.5 Billion – Here’s What Happened
Mixed Reactions from Experts
David Sacks, a White House crypto advisor, welcomed the update. He said it offers much-needed clarity and reduces regulatory hurdles for dollar-backed stablecoins that are fully supported by safe assets. He also noted that these types of tokens would no longer need to register under the Securities Act.
However, SEC Commissioner Caroline Crenshaw disagreed. She warned that the guidance oversimplifies how stablecoins actually work and overlooks key legal issues. Crenshaw argued that the risks involved are being downplayed, and the update could create confusion about how these tokens function
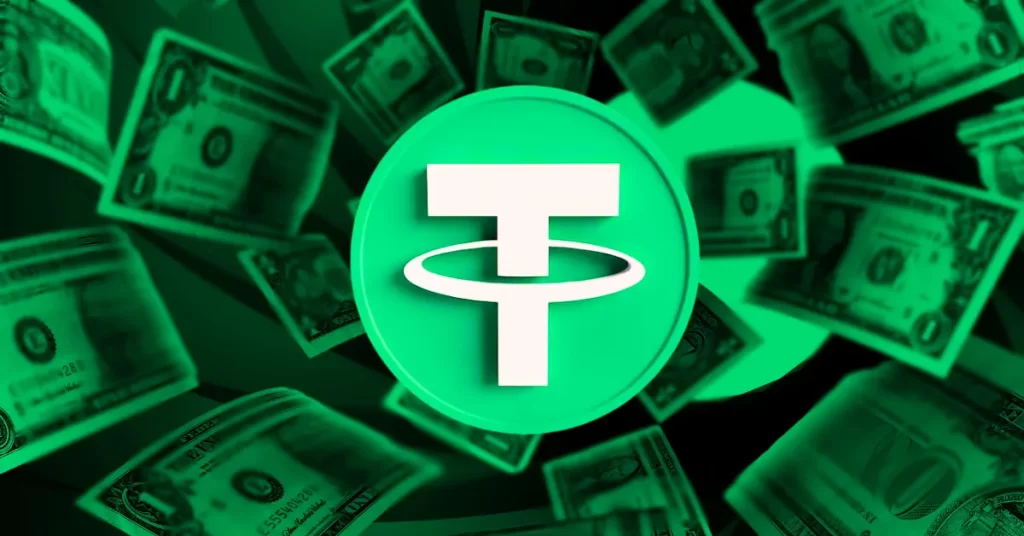
Tether Faces New Challenges
The new rules may benefit stablecoins like USDC, but they raise concerns for Tether’s USDT. That’s because the SEC doesn’t allow stablecoins to be backed by assets like cryptocurrency or gold—both of which are included in USDT’s reserves.
According to Forbes reporter Nina Bambysheva, Tether is now exploring the idea of launching a new stablecoin that would fully follow U.S. rules. This new coin would be backed only by cash and U.S. Treasuries, marking a major shift for the company.
Crypto analyst Novacula Occami also noted that Tether’s use of Bitcoin and gold in its reserves could make USDT ineligible for the “covered stablecoin” label. That could expose it to stricter regulations under U.S. securities law.
Tether’s Plan for a U.S.-Compliant Stablecoin
Despite the potential regulatory pressure, Tether doesn’t seem too worried about a possible U.S. ban on USDT. According to CTO Paolo Ardoino, the company is already thinking ahead and preparing to launch a separate U.S.-compliant stablecoin.
Ardoino said USDT will likely remain focused on emerging markets, while the new stablecoin would be designed specifically for the U.S. market and built to comply with American regulations.
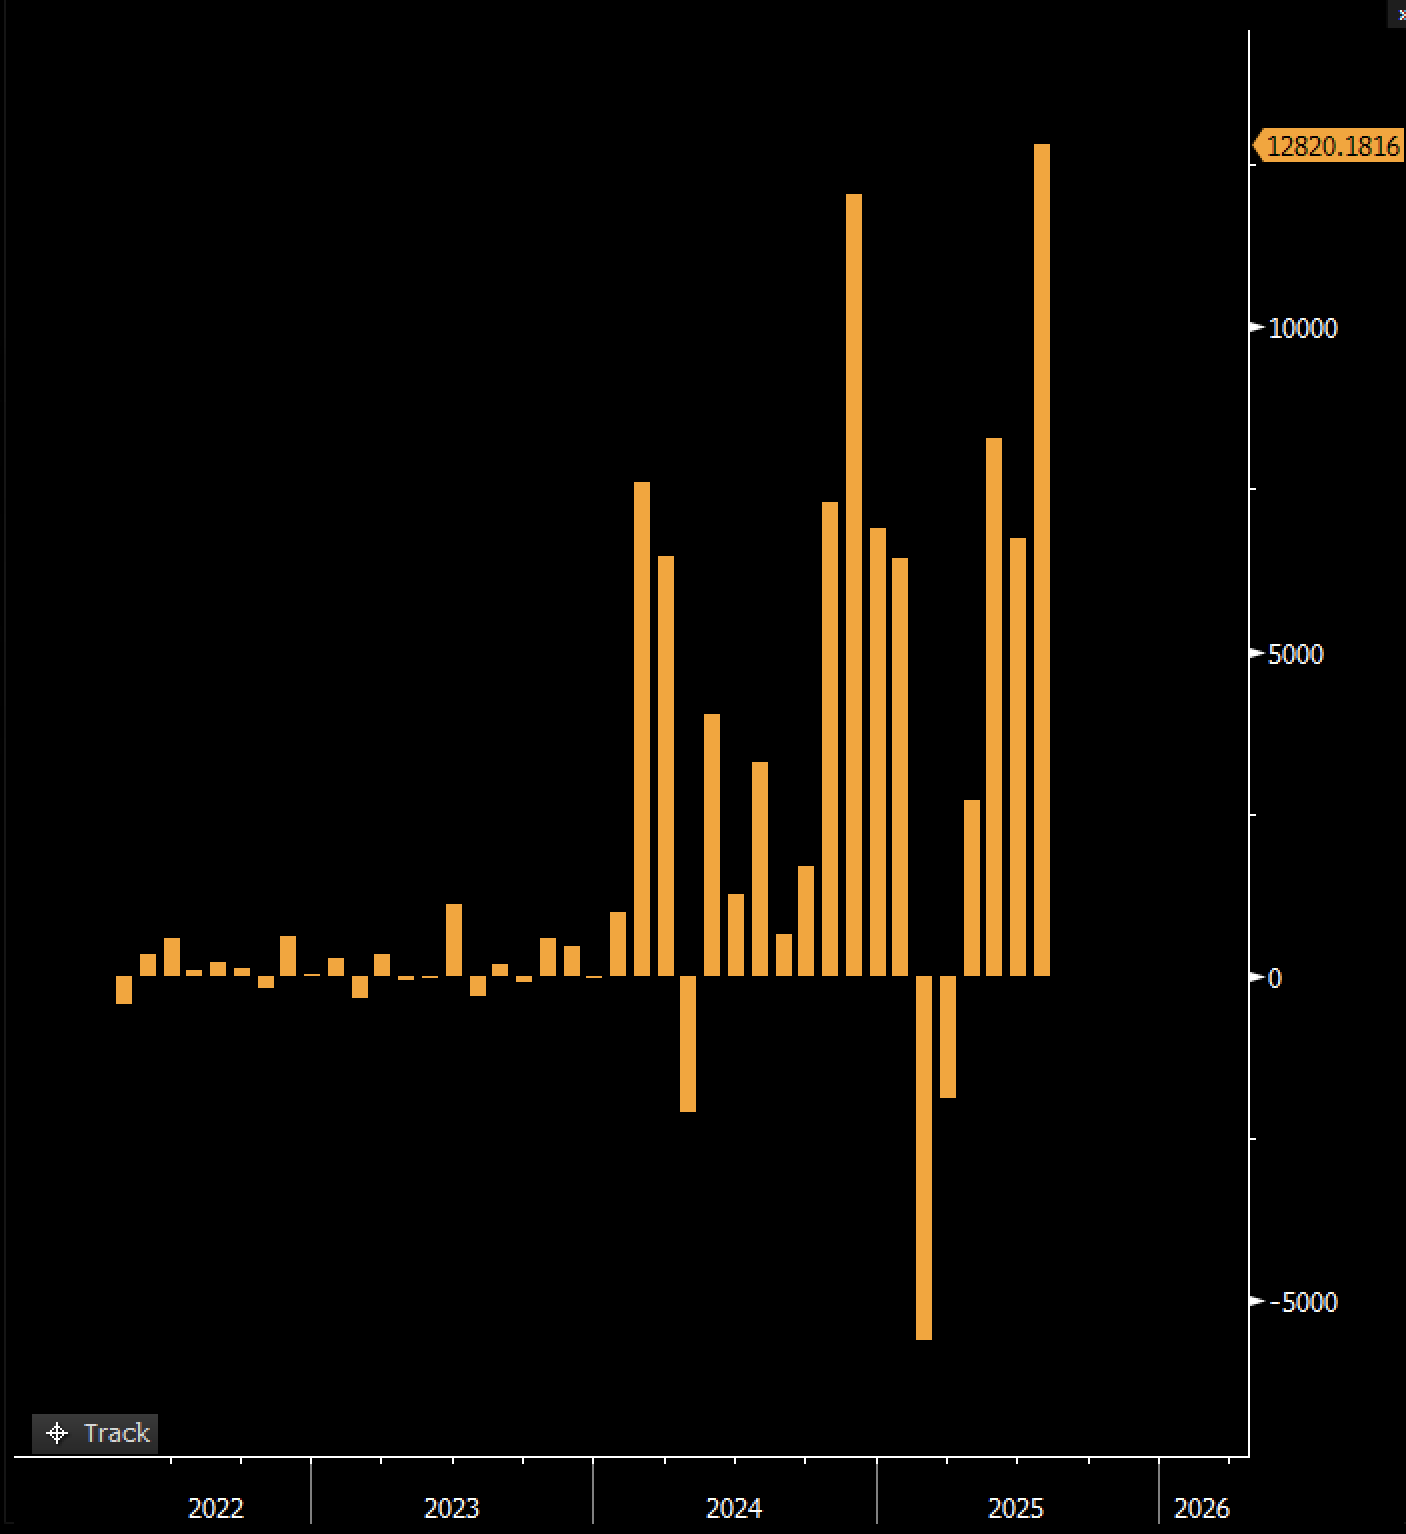
Even as the wider crypto market struggles through a difficult first quarter, stablecoins are seeing strong growth. Daily usage continues to rise, and the stablecoin market added over $30 billion in Q1 alone – showing that demand remains high despite broader market uncertainty.
It’s not every day the SEC speaks plainly on crypto – so when it does, the industry listens!
The post What Are SEC’s New “Covered Stablecoins”? Tether’s USDT May Not Qualify! appeared first on Coinpedia Fintech News
In a rare and clear move, the U.S. Securities and Exchange Commission (SEC) has introduced new guidance that could significantly impact the stablecoin market. The agency said that certain stablecoins – now called “covered stablecoins” – may not be treated as securities, as long as they follow strict conditions. The crypto industry has already begun …