Cardano price analysis outlines a make-or-break scenario for ADA as it hovers above the $0.653 support level. A bounce here could prevent further losses, but a breakdown of this key barrier could lead to a 30% correction to $0.506, a critical liquidity area. What can investors expect? Cardano Price Analysis Cardano’s price has produced three distinctive lower highs since the December 2, 2024, peak of $1.326, highlighting the predominant bearish trend. The 22% crash since May 23 has knocked ADA down toward the $0.653 support level. This barrier served as a foothold for bounce four times in the past four months. Hence, a revisit of this level could lead to a strong reaction. Will ADA bounce from this critical support level or crash below it? Technicals like the Relative Strength Index (RSI) and Awesome Oscillator (AO) suggest an overwhelmingly bearish outlook. The recent Bitcoin price drop has triggered a crash… Read More at Coingape.com
The Bitcoin 2025 Conference, held at the Venetian Convention Center in Las Vegas between May 27 and 29, brought together top-tier key opinion leaders in the cryptocurrency industry. More than 25k attendees and 300 exhibitors attended the Bitcoin 2025 Conference, thus underpinning the rising popularity of crypto assets in the United States.
The Bitcoin 2025 Conference coincided with the ongoing BTC price bullish sentiment. Institutional investors – led by BlackRock, Strategy, Metaplanet, and GameStop – have doubled down their BTC purchases in the recent past. As a result, bullish sentiment will likely continue in the coming weeks and months, with some experts predicting a crypto-bullish outlook until the end of this year.
Takeaways Points from Top Speakers at the Bitcoin 2025 Conference
JD Vance: U.S. Vice President
The attendance of JD Vance at the Bitcoin 2025 Conference reiterates Donald Trump’s support for the Bitcoin network and the wider crypto industry. Furthermore, Vance highlighted the importance of Bitcoin as a reserve asset of the United States to enhance the country’s economic stability.
In his speech, Vance criticized the former administration led by President Joe Biden for brewing the operation choke point 2.0.
Donald Trump Jr. And Eric Trump
Donald Trump Jr. and Eric Trump are respected figures in the Trump Organization, which has doubled down in the Bitcoin investment in the recent past. As Coinpedia reported, the Trump Media plans to raise $2.5 billion by Friday to implement a Bitcoin treasury system.
Their remarks and presence strengthened Bitcoin’s narrative as a store of value used by investors to bypass the siloed shackles of centralized systems.
Michael Saylor
Michael Saylor continues to lead Strategy’s plan to acquire as many Bitcoins as possible through leveraging global capital markets. In his speech at the Bitcoin 2025 Conference, Saylor reiterated that BTC’s market cap is en route to $100 trillion, catalyzed by its scarcity and rising demand from institutional investors.
Cynthia Lummis
Cynthia Lummis has been a pro-crypto legislator, thus making her presence at the Bitcoin 2025 Conference crucial. Lummis announced during the event that the Strategic Bitcoin Reserve bill will be tabled in the coming weeks.
The post Bitcoin 2025 Conference Concludes on Thursday: Key Takeaway Points from High-profile Speakers appeared first on Coinpedia Fintech News
The Bitcoin 2025 Conference, held at the Venetian Convention Center in Las Vegas between May 27 and 29, brought together top-tier key opinion leaders in the cryptocurrency industry. More than 25k attendees and 300 exhibitors attended the Bitcoin 2025 Conference, thus underpinning the rising popularity of crypto assets in the United States. The Bitcoin 2025 …
CME Group has partnered with Google Cloud to pilot initiatives aimed at enhancing capital market efficiency through tokenization. The collaboration seeks to leverage Google Cloud Universal Ledger (GCUL).
However, critics argue that the technology represents a shift toward centralization in an industry that has traditionally prioritized decentralization.
CME and Google Cloud’s Tokenization Pilot: A New Era or Centralization Crisis?
For context, Google Cloud’s GCUL is a distributed ledger built for seamless integration by financial institutions. This platform simplifies account and asset management while enabling secure transfers on a private and permissioned network.
“Google Cloud Universal Ledger has the potential to deliver significant efficiencies for collateral, margin, settlement, and fee payments as the world moves toward 24/7 trading,” Duffy said.
The team has finalized the initial integration and testing phase of GCUL. They will conduct direct testing with market participants later this year. Lastly, the services’ launch is planned for 2026.
Nonetheless, the move has sparked controversy within the cryptocurrency community. Critics argue that GCUL, as a centralized and permissioned ledger, contradicts the decentralized ethos that underpins blockchain technology.
“It is not a bullish development,” a user wrote on X.
The collaboration has also ignited a broader discussion about the role of public versus private blockchains in asset tokenization. DeFi analyst Ignas framed the issue as a “battle between public, decentralized networks and private chains.
This suggested that centralized solutions like GCUL could undermine the principles of transparency and inclusivity of public blockchains.
“Not bullish at all. Google Cloud Universal Ledger (GCUL) seems to be a private, permissioned network,” he posted.
Meanwhile, another analyst pointed out the practical challenges associated with using public blockchains.
“I’m honestly not sure if public chains are competitive in this space,” he claimed.
The analyst explained that CME Group or similar institutions require ultra-high-frequency settlements with near-instant finality. They also need room for manual intervention when necessary.
This need for precise control often leads institutions to split blockchain nodes into specialized roles like clearing, settlement, compliance, and observation. The analyst argued that public blockchains do not support this level of control.
He also highlighted that tokenized assets need liquidity boundaries to avoid risks like money laundering and speculation. Without proper controls, tokenized assets could face these issues if traded on decentralized exchanges.
“I’ve talked to quite a few people from traditional finance, and honestly, many of them say DEXs are basically no different from black markets,” the analyst added.
Meme coins had a good run over the last 24 hours as the broader market cues remained bullish. The total value of these joke tokens shot up by 2.5% and is currenrlly at $60.12 billion led by the small cap token Banana For Scale’s 37% rise.
BeInCrypto has analysed two other meme coins in addition to BANANAS31 for investors to watch in the coming days.
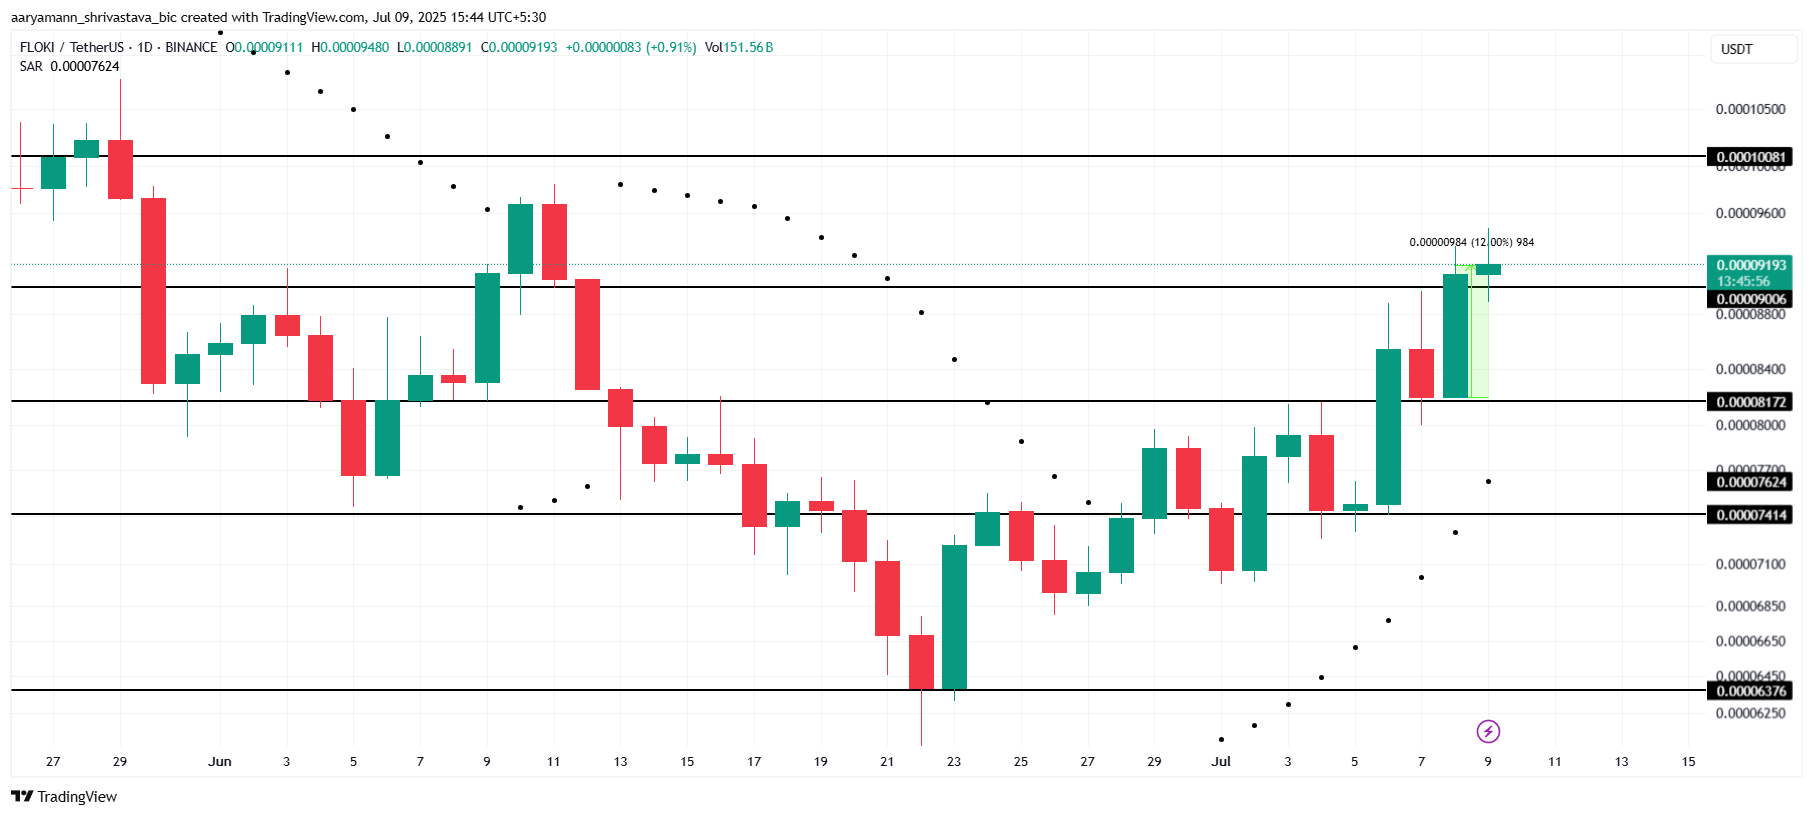
FLOKI has risen by 12% in the last 24 hours, reaching a near-monthly high of $0.00009193. The meme coin is on the verge of breaking through the major resistance level of $0.00010081. If the upward momentum continues, FLOKI could potentially see further price gains in the near future.
The Parabolic SAR, positioned below the candlesticks, is providing support for FLOKI, suggesting that an uptrend is likely to continue. This indicates that the meme coin could maintain its positive price movement, with the potential to move towards higher resistance levels.
However, if FLOKI fails to secure $0.00009006 in support, the price could experience a sharp decline. A drop below this support level would likely push FLOKI to $0.00008172, invalidating the bullish outlook. This scenario would suggest a reversal in market sentiment, leading to a potential correction.
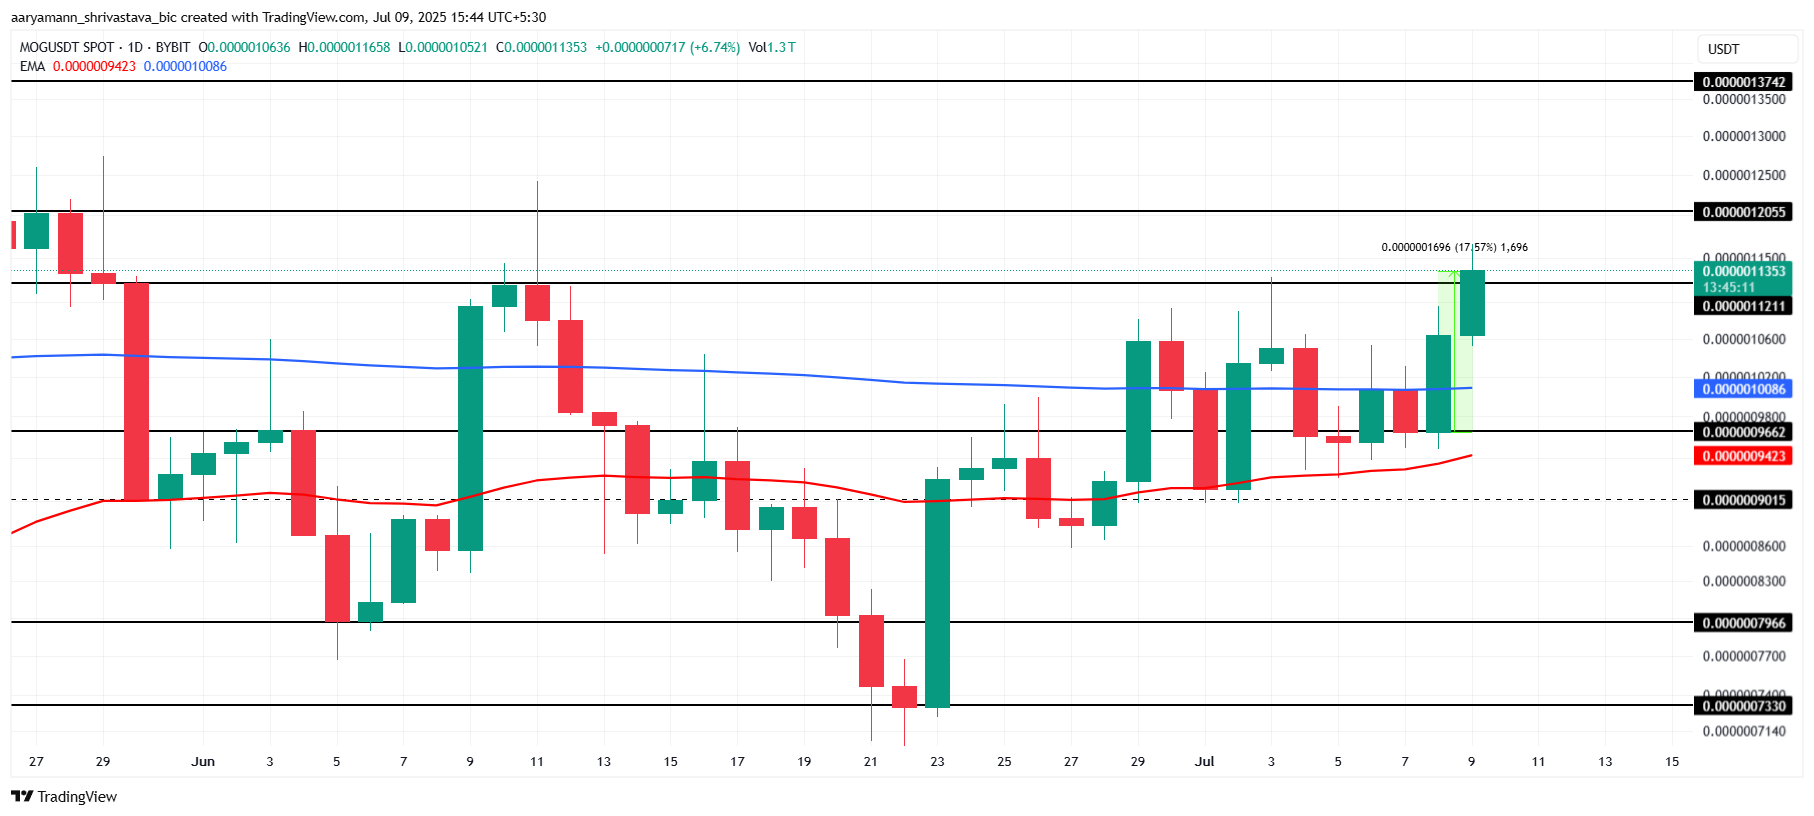
MOG surged by 17.5% in the last 24 hours, currently trading at $0.000001135, just above the support level of $0.000001121. Securing this support is crucial to maintain the recent gains and prevent a reversal. This level will determine whether MOG can continue its upward price movement.
If MOG holds the $0.000001121 support, it could push through the $0.000001205 resistance and rise toward $0.000001374. MOG will require consistent investor support to continue posting profits. The meme coin’s ability to break through key resistance levels will depend on sustained buying pressure and market sentiment.
However, if MOG faces selling pressure, it may fail to secure the $0.000001121 support level. A decline below this level could lead to a drop to $0.000000966, reinforcing the ongoing Death Cross. This would invalidate the bullish thesis, suggesting that market sentiment has shifted toward a bearish outlook.
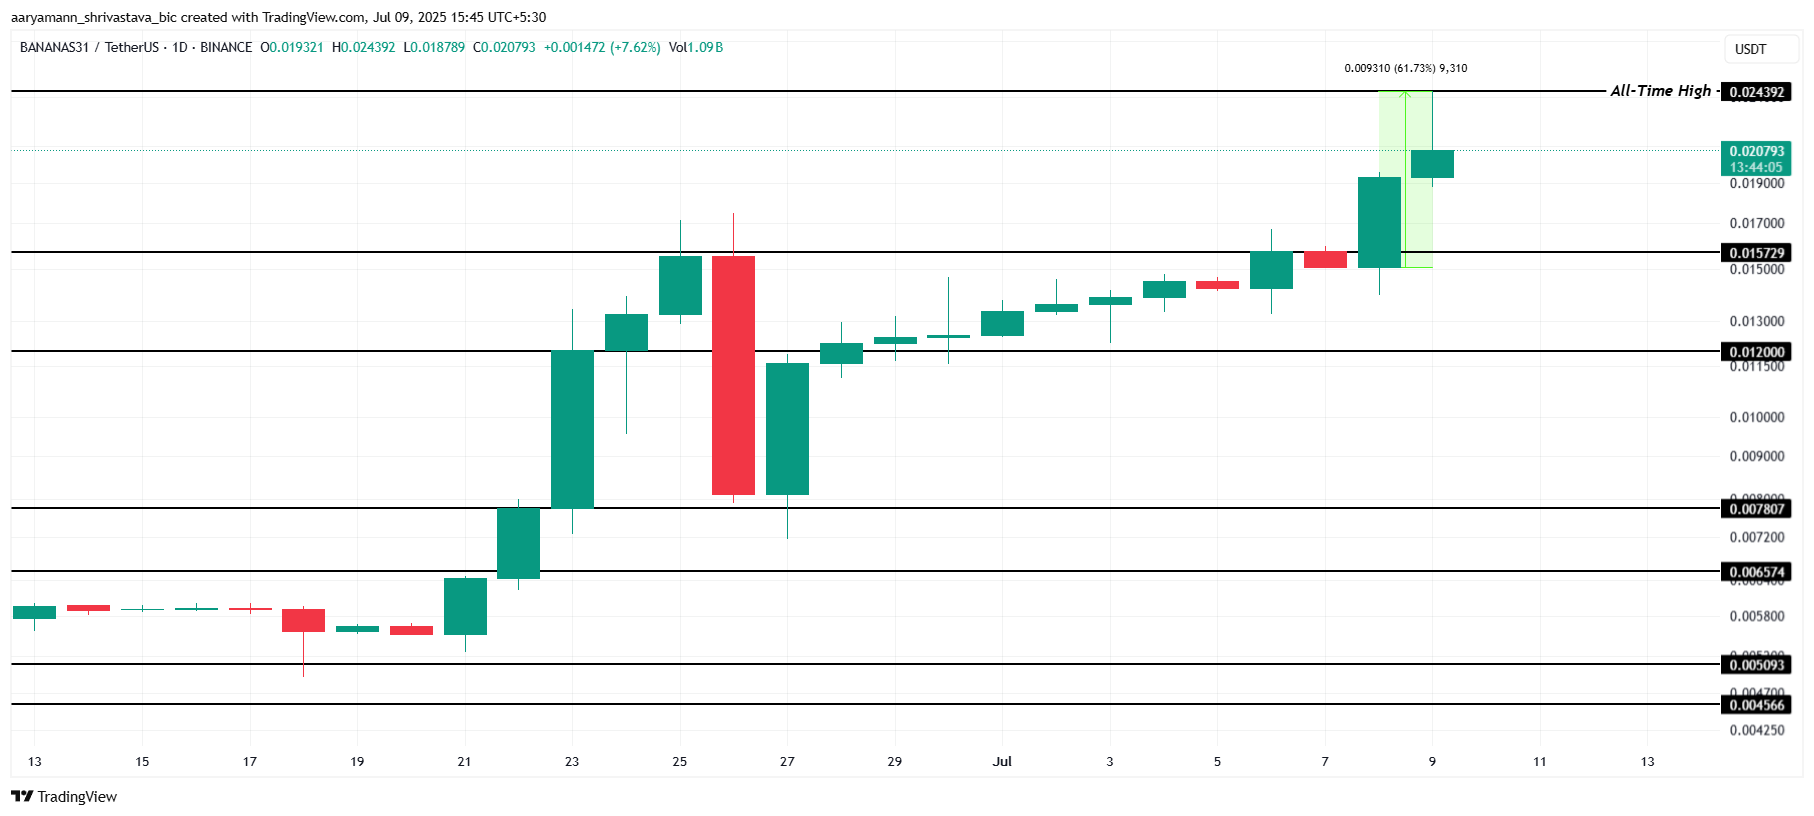
BANANAS31 surged by 61% during today’s intra-day rise, reaching a new all-time high (ATH) of $0.0243. This impressive rally showcases the altcoin’s strong momentum, as investor interest continues to rise. The new ATH signals a potential for further price growth, depending on market conditions.
If the bullish momentum persists, BANANAS31 could continue pushing upward, forming new ATHs in the coming days. Investors are likely to remain in profit as the altcoin maintains its upward trajectory. However, sustained growth will depend on continued investor support and favorable market conditions for the meme coin.
Should investors decide to cash out and book profits, BANANAS31 may struggle to maintain its gains. A drop below the support level of $0.0157 could lead to a decline toward $0.0120, invalidating the bullish outlook. This would signal a reversal in market sentiment, erasing recent price progress.