Solana (SOL) price is down 7% since May 23 after falling from a weekly high of $186 to trade at $172 at press time as bulls face resistance at $174. Despite bearish headwinds, Solana’s open interest continues to rise and currently sits at a four-month high. As futures positions surge, can Solana price break out above resistance, or will the decline continue? Solana Price Targets $180 Amid Headwinds SOL value today is bearish as bulls face headwinds in attempting to break SOL price past the key resistance level of $180. The RSI on the daily price chart shows that the momentum is currently bearish. Besides having a reading of 46, the RSI has flattened, an indication that traders are not willing to accumulate at the current price. The DMI indicator shows a similar bearish outlook as the -DI line (blue) oscillates below the +DI line, a sign that sellers are… Read More at Coingape.com
AI coins like HOLLY, PROMPT, and DSYNC have seen notable Smart Money accumulation in recent weeks. Over the past few weeks, these three projects have stood out in on-chain activity.
Specifically, HOLLY brings visual storytelling to blockchain, PROMPT powers AI interactions across chains, and DSYNC focuses on AI and DePIN infrastructure. Despite contract risks flagged by GoPlus Security, these AI coins show rising adoption, strong trading activity, and expanding holder bases.
h011yw00d by Virtuals (HOLLY)
HOLLY, short for h011yw00d, is an AI-powered cinematic agent that turns internet conversations into short visual films. Unlike traditional formats, it tells stories without dialogue or captions, using only visuals to express emotion and narrative. As a result, the project offers a new way to interpret online interactions through AI filmmaking.
The team launched HOLLY four days ago on the Base chain. Since then, it has reached a market cap of $1.2 million and gathered over 48,000 holders.
Smart Money Holders and Total Balance for HOLLY. Source: Nansen.
According to Nansen, the number of Smart Money wallets holding HOLLY increased from 5 to 10 since April 18. Together, these wallets now hold around 13.4 million tokens. Additionally, the team launched the token via the Virtuals Protocol platform, one of the biggest players in the crypto AI agents space.
One of HOLLY’s top holders uses a wallet that Nansen, an on-chain analytics platform, labeled as linked to LongHash Ventures. Meanwhile, GoPlus Security, a crypto security firm, points out two key risks: the team can modify HOLLY’s tax, and they didn’t renounce ownership—both important factors for traders to monitor.
PROMPT
PROMPT is the native token of Wayfinder, an omni-chain tool designed to enable AI systems to operate across blockchain environments.
Wayfinder aims to create new methods for machine intelligence to interact with decentralized networks, facilitating more advanced on-chain AI integrations. PROMPT serves as the core asset within this ecosystem, supporting the platform’s operations and functionality.
Smart Money Holders and Total Balance for PROMPT. Source: Nansen.
Between April 9 and April 14, Smart Money wallets holding PROMPT jumped from zero to 20. That number has stayed the same for the past eight days.
PROMPT runs on the Ethereum blockchain. It has around 5,600 holders, a market cap of $53 million, and a daily trading volume of $706,000.
GoPlus Security flagged two risks. The team didn’t renounce ownership, and the contract allows new tokens to be minted. That could increase supply and push the price down.
Destra Network (DSYNC)
Among emerging AI coins, Destra Network positions itself as a decentralized solution for DePIN (Decentralized Physical Infrastructure Networks) and AI computing, aiming to streamline access to these technologies through a unified platform.
Currently, DSYNC has a market cap of $140 million and is held by over 48,000 wallets.
Smart Money Holders and Total Balance for DSYNC. Source: Nansen.
Since April 1, the number of Smart Money wallets holding DSYNC has grown from 41 to 44, and the token has seen a price increase of more than 13% in the past 24 hours. Over the same period, its trading volume reached $455,000.
According to GoPlus Security, DSYNC has two points of caution: the contract’s tax settings can be modified, and the token’s ownership has not been renounced—factors that could pose risks depending on future changes to the contract.
Celestia (TIA) has recently experienced a significant drawdown, losing nearly 30% of its value in the past two weeks. This decline has been attributed to the broader bearish market conditions, which caused panic among investors.
As a result, many TIA holders decided to pull their funds, adding to the downward pressure on the price.
Celestia Holders Opt To Back Out
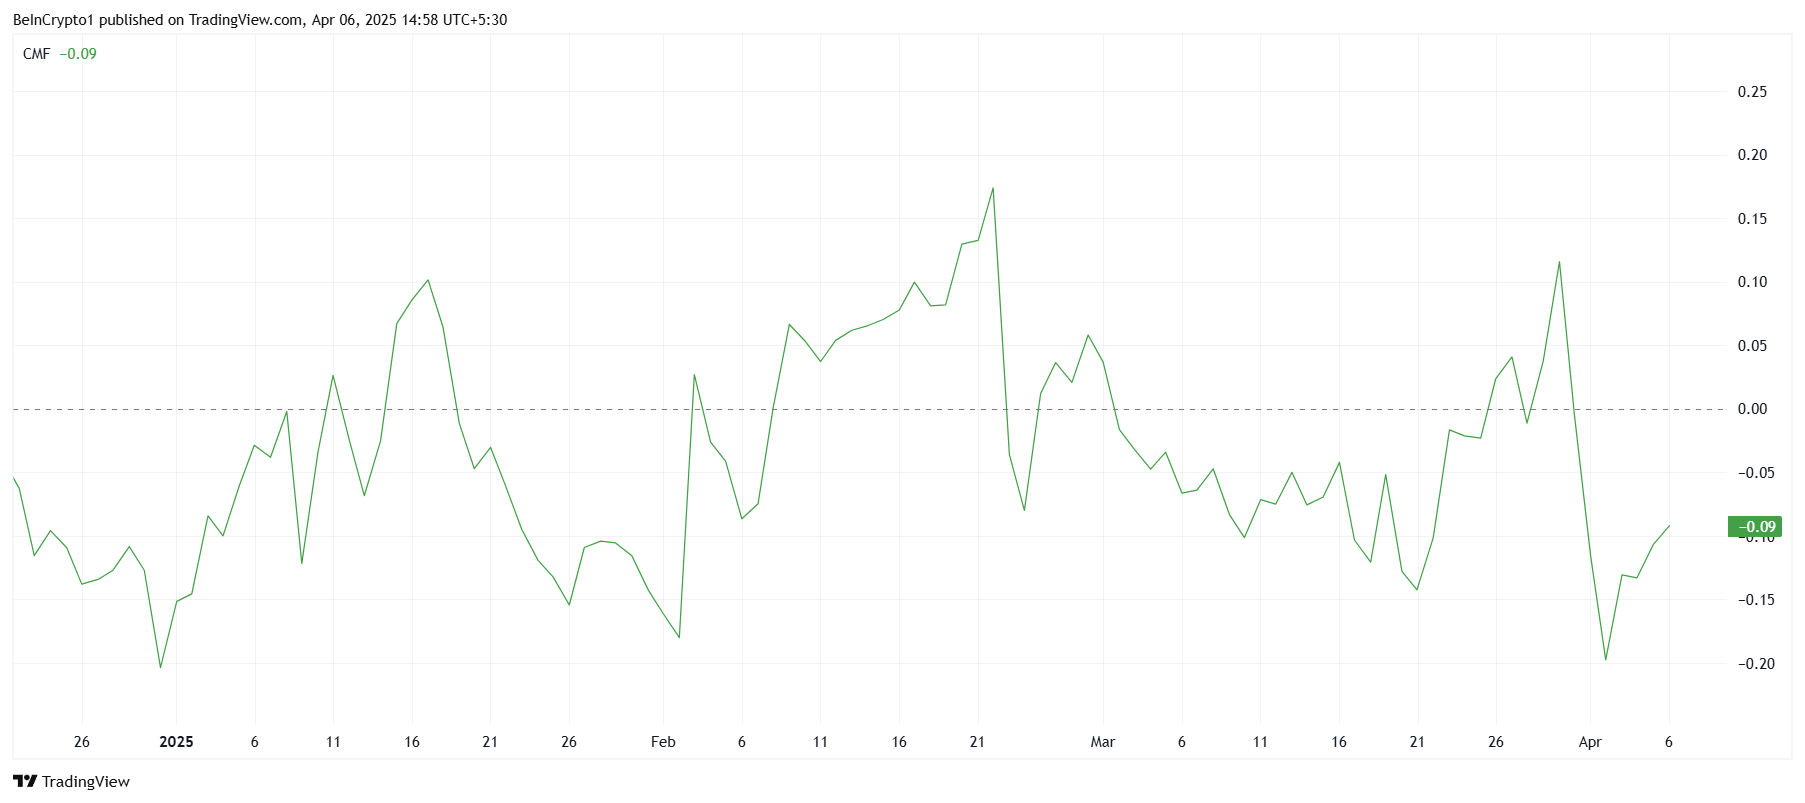
The Chaikin Money Flow (CMF) indicator has shown significant outflows from Celestia, marking the largest selling activity since the beginning of 2025. This reflects the growing fear among investors after the 30% price correction.
However, despite the negative sentiment, there has been an uptick in the CMF recently, indicating that some new investors are beginning to see value in the low prices. These inflows could potentially help stabilize the price and set the stage for a recovery.
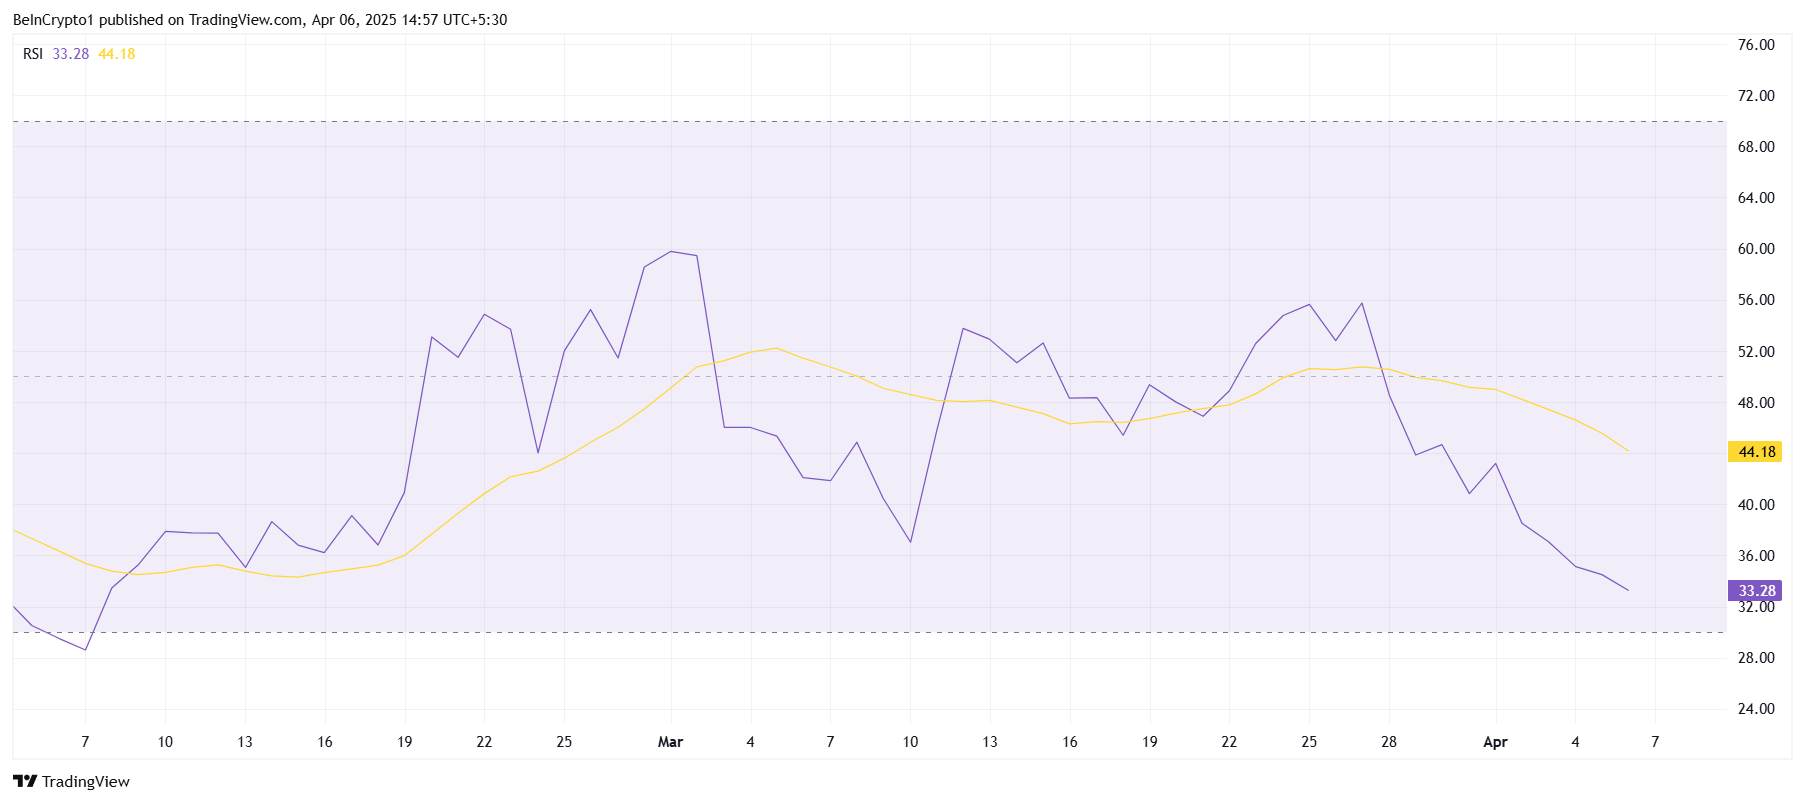
The Relative Strength Index (RSI) for Celestia shows that cryptocurrency is currently on a bearish trend. Stuck below the neutral line at 50.0, the RSI is moving closer to the oversold threshold of 30.0. Historically, when an asset reaches this level, it is considered a signal for a potential reversal, as selling typically slows, and accumulation begins.
If the RSI falls below 30, it could trigger buying interest, as many traders may view the low prices as an opportunity to enter the market.
The current state of the RSI suggests that while bearish momentum is still strong, the conditions are ripe for a reversal. If the selling pressure wanes and buyers begin to step in, Celestia’s price could find support and begin an upward move.
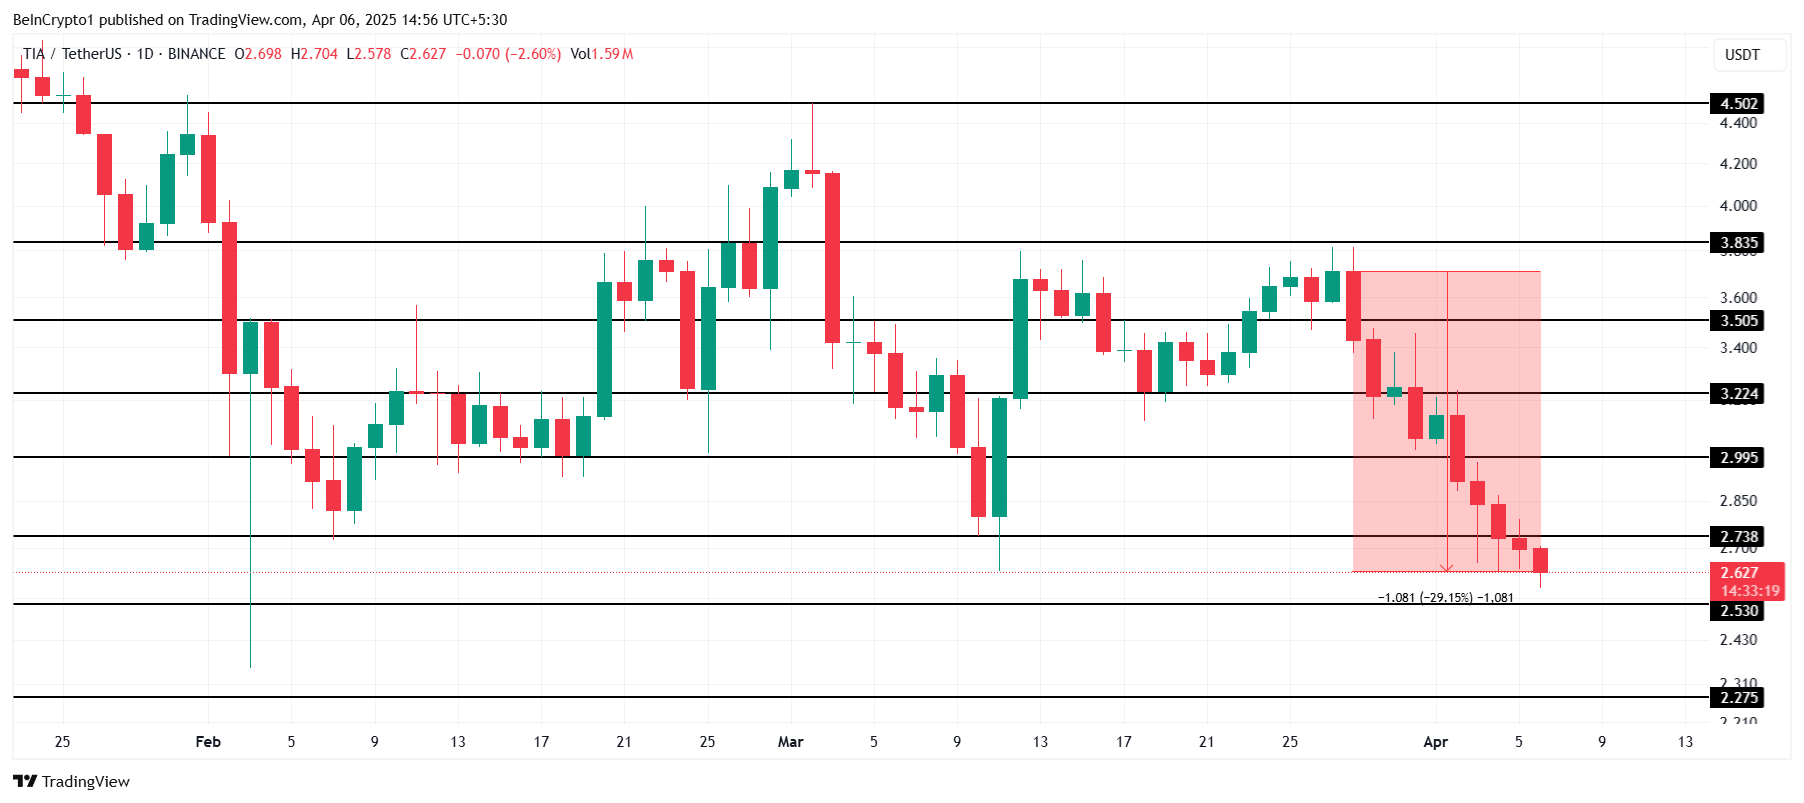
Celestia is currently priced at $2.62, reflecting a nearly 30% decline over the past two weeks. It is holding just above the critical support level of $2.53. If the market sentiment improves and the RSI hits the oversold zone, there is potential for a recovery.
The influx of new investors could provide the momentum needed to drive the price higher.
A successful bounce from the $2.53 support level could see Celestia pushing through $2.73 and heading towards $2.99. This would signal the beginning of a recovery rally and possibly set the stage for further price appreciation as market conditions improve.
However, if Celestia fails to hold the $2.53 support, it could trigger a further decline towards $2.27. This would invalidate the bullish outlook, prolonging the downtrend and extending investors’ losses.
Validators representing over 90% of the stake on the Sui blockchain have voted in favor of a recovery plan to address the recent Cetus hack. The on-chain community vote concluded early due to the overwhelming support for the proposal. This decision enables the transfer of frozen funds to a multi-signature wallet to be held in trust until they can be returned to users. Sui Validators Vote Approves Fund Recovery The Sui Foundation said that over 90% of validators with voting authority backed the recovery plan, resulting in the vote closing early at just four days. In the voting stage, validators and stakers had a major say in the decisions for protocol governance. Validators voted “yes,” “no,” or “abstain,” and the weights of their votes depended on how much at stake they represented. The Sui Foundation’s interest was not counted to preserve an even playing field. The proposal gives clearance for… Read More at Coingape.com