Dogecoin’s Shiba Inu mascot is racing into the spotlight once again. The meme-inspired cryptocurrency will be prominently displayed on Devlin DeFrancesco’s IndyCar at the Indianapolis 500, one of America’s most-watched motorsport events.
The initiative is backed by a partnership involving the Dogecoin Foundation, House of Doge, Rahal Letterman Lanigan Racing, and the driver himself.
Dogecoin Returns to the Track at Indy 500 With Charity-Fueled Campaign
In the weeks leading up to the race, Dogecoin supporters selected the car’s final livery through a community vote, choosing from three DOGE-themed designs.
The winning look, called Blaze, will feature prominently on both the vehicle and the driver’s helmet.
Dogecoin-Backed IndyCar at the Indianapolis 500. Source: Dogecoin
Although DeFrancesco has yet to crack the top 10 at the Indy 500—his best finish was 13th in 2023—he remains a fan favorite. His odds of winning this year sit below 1%, according to crypto-based prediction marketPolymarket.
Still, the campaign’s real traction may come off the track.
A fundraising initiative linked to the Dogecoin sponsorship has raised 117,947 DOGE, or roughly $26,000, for Riley Children’s Foundation.
The organization supports Riley Children’s Health, one of the top neonatology centers in the United States.
NFL Pro Bowler Dion Dawkins added to the momentum with an 8,000 DOGE donation from a self-custodial wallet created during the race weekend.
The donations will support intensive care treatment for newborns with complex medical conditions.
Following the race, DeFrancesco plans to auction off his Dogecoin-themed helmet, with proceeds also going to Riley Children’s Hospital.
Notably, the driver once spent four months in an incubator at Sunnybrook Hospital in downtown Toronto.
Meanwhile, this isn’t Dogecoin’s first motorsport sponsorship. The crypto community previously funded a NASCAR car in 2014 and backed another entry in 2021.
Hyperliquid (HYPE) is showing strong technical signals across multiple indicators, with the token surging more than 15% in the last 24 hours. The platform continues to demonstrate impressive market performance, generating $47 million in fees over the past 30 days and outperforming major blockchain networks like Ethereum and Solana.
Technical indicators suggest a potential golden cross formation, meaning HYPE could test $21 or even $25.80 in the coming period.
Hyperliquid Revenue Places It Among Top Protocols In Crypto
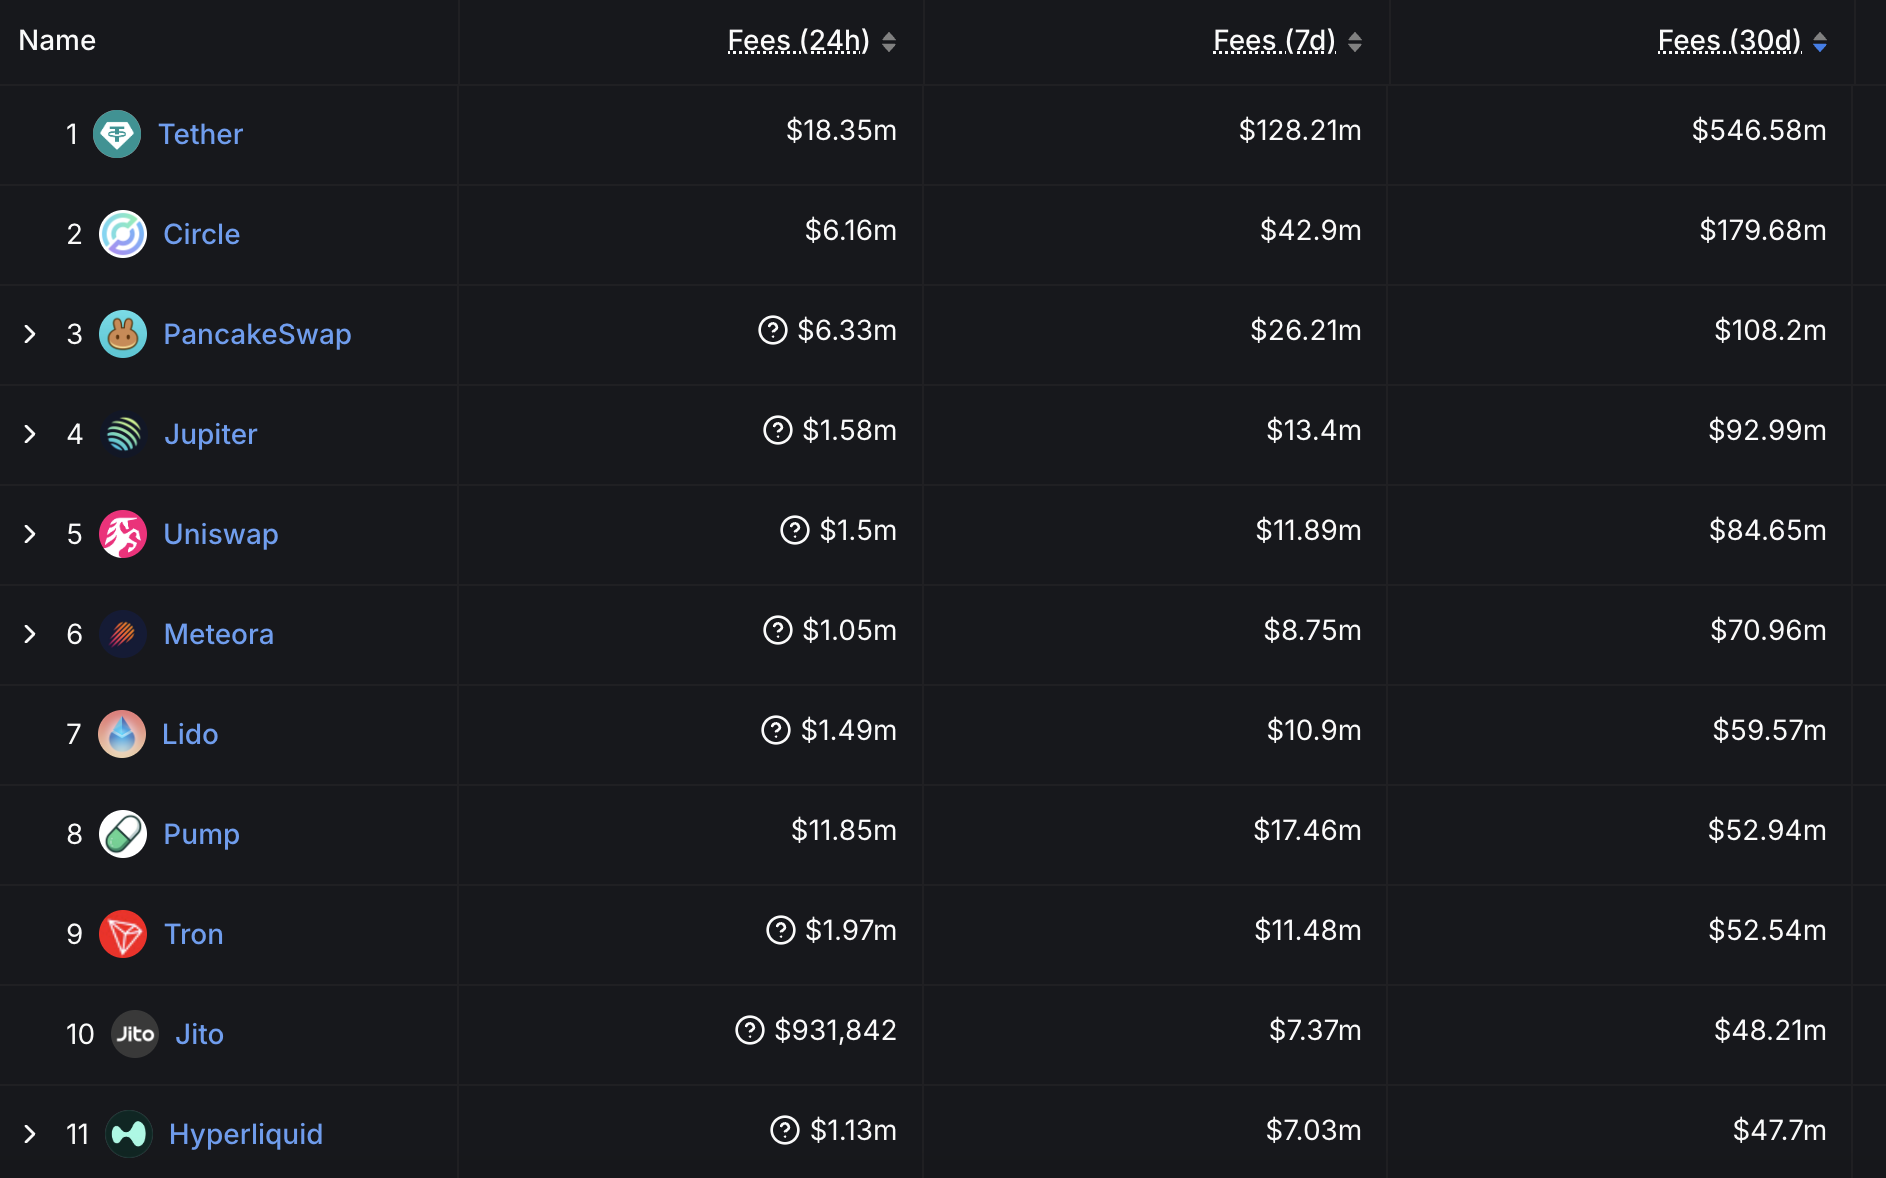
Hyperliquid is currently one of the most successful protocols in crypto. Over the past 30 days, it has generated an impressive $47 million in fees and recently reached $1 trillion in perps volume.
While this places it behind major players such as Jito, Pumpfun, and PancakeSwap in terms of monthly revenue, Hyperliquid has surpassed significant blockchain apps and chains, including Solana, Ethereum, Raydium, and Phantom.
Selected Protocols and Chains Revenue. Last 24 hours, Last 7 Days, and Last 30 Days. Source: DefiLlama.
What makes Hyperliquid’s success particularly remarkable is that, unlike most other high-performing protocols that operate on established blockchain networks such as BNB, Solana, or Ethereum, Hyperliquid functions as its own independent chain.
With the exception of Tron, virtually all other major protocols rely on parent blockchains, whereas Hyperliquid has achieved its substantial revenue figures as a standalone entity.
Despite this impressive performance and unique positioning, HYPE has experienced considerable downward price pressure recently, trading below the $20 threshold for sixteen consecutive days, creating a notable disconnect between the protocol’s operational success and its market valuation.
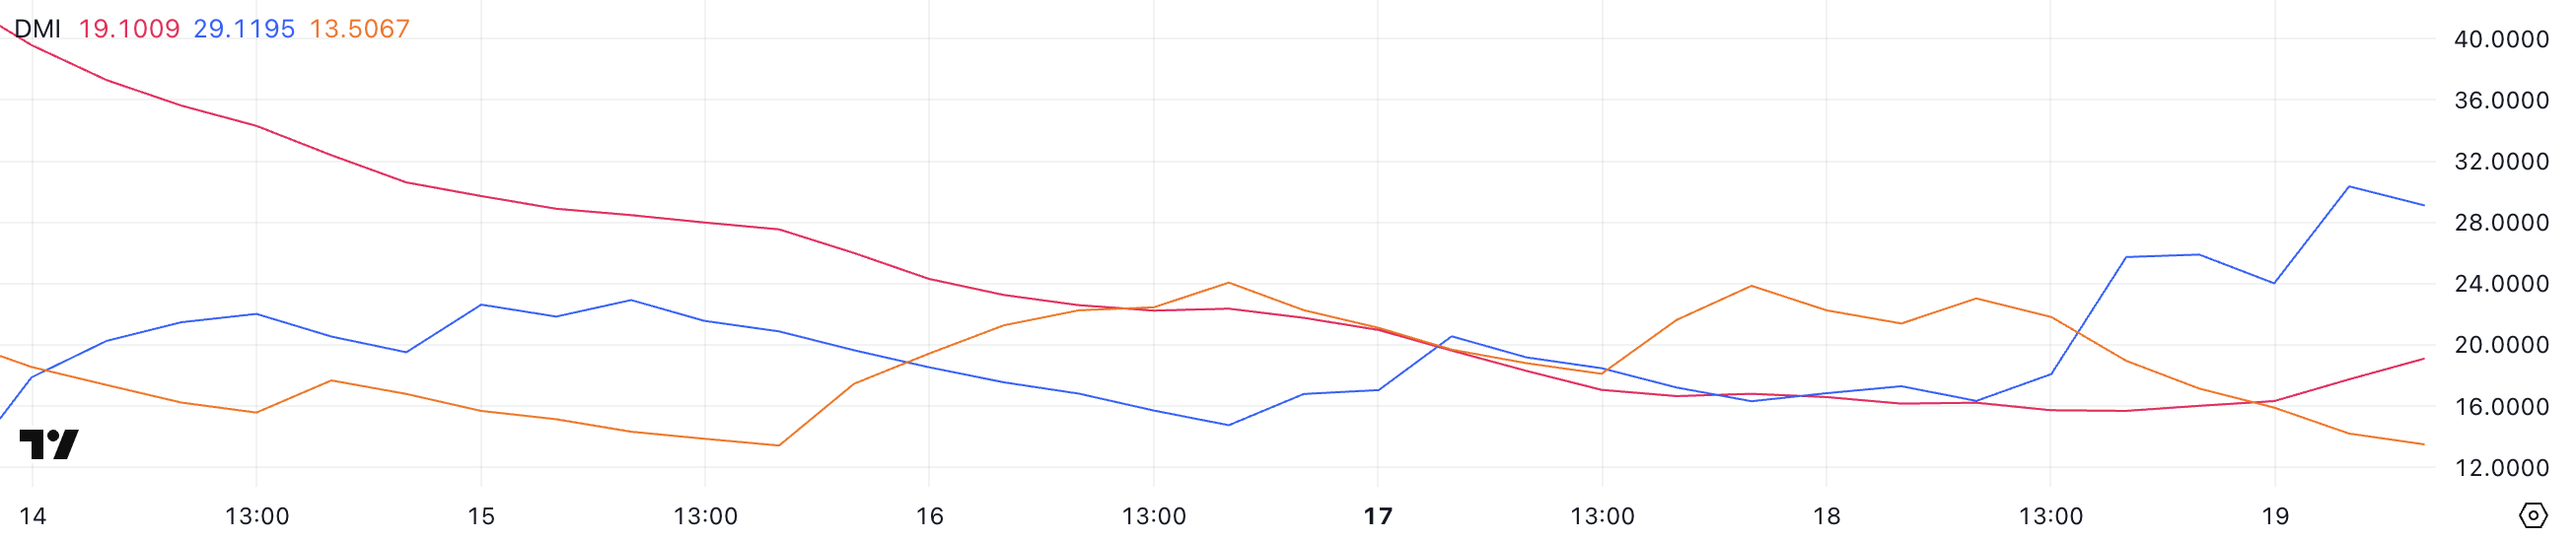
HYPE DMI Shows Buyers Are In Control
The HYPE DMI (Directional Movement Index) chart shows promising momentum shifts, with the ADX (Average Directional Index) rising from 15.7 to 19, suggesting a strengthening trend conviction.
More significantly, the +DI (Positive Directional Indicator) has surged from 18 to 29.1, while the -DI (Negative Directional Indicator) has declined from 21.8 to 13.5. This crossover pattern, where +DI rises above -DI, typically signals a potential bullish reversal.
The increasing spread between these indicators and the rising ADX suggests that buying pressure is overcoming selling pressure, potentially setting the stage for HYPE to break above its recent sub-$20 trading range.
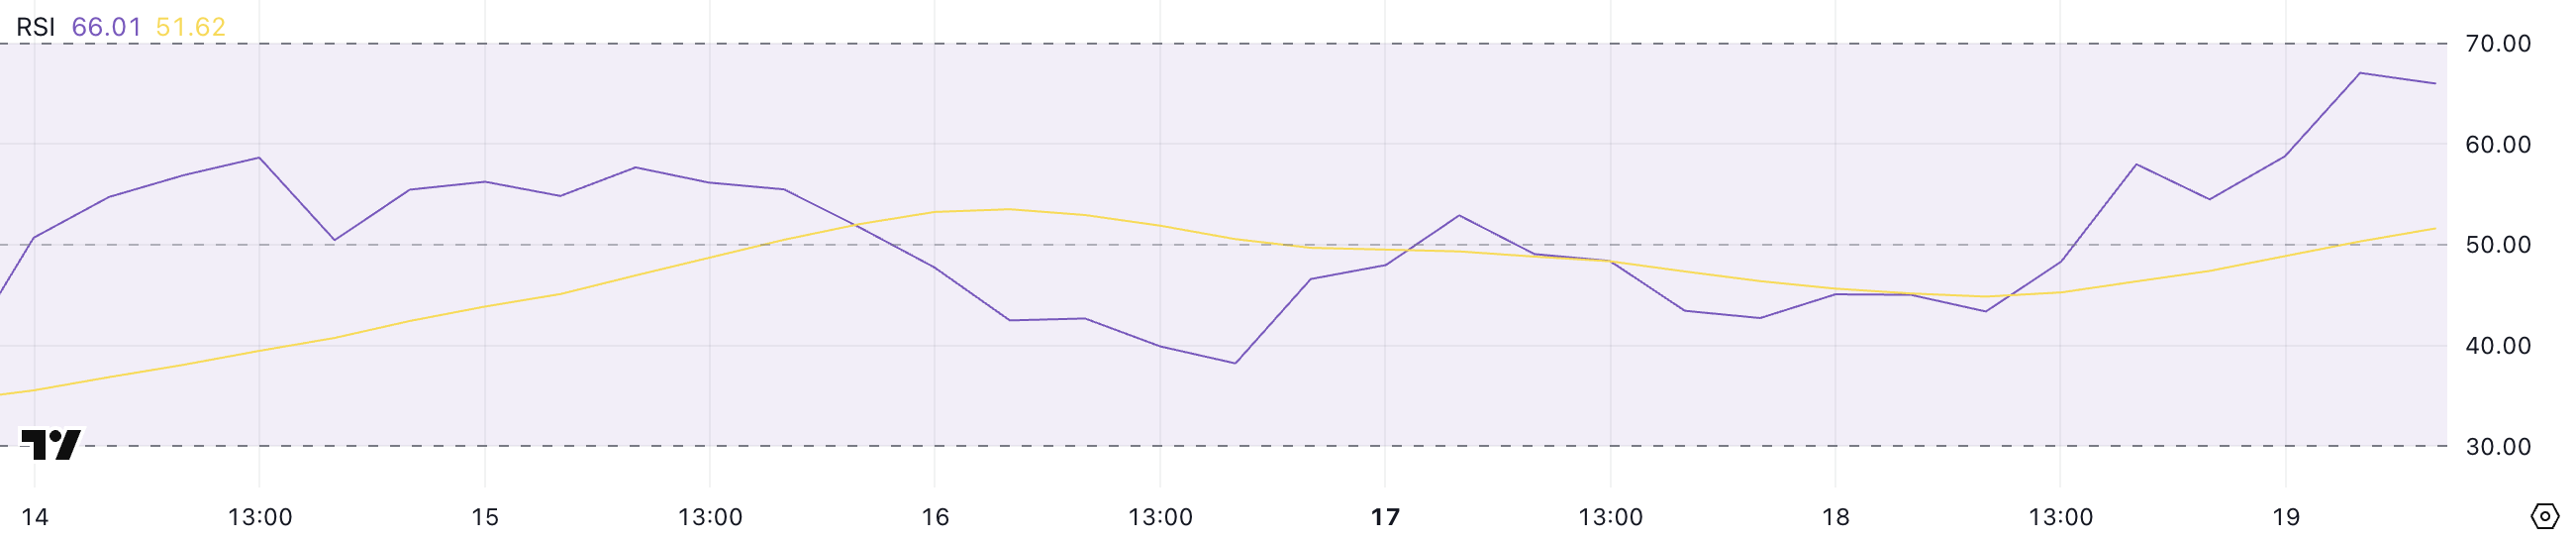
HYPE’s RSI climbing from 54.5 to 66 indicates growing bullish momentum that hasn’t yet reached extreme levels. This uptick suggests strengthening buyer interest while remaining below the overbought threshold of 70.
The fact that HYPE hasn’t reached overbought levels since December 2024 implies there may still be room for price appreciation before any potential pullback.
Together with the DMI indicators, this RSI reading reinforces the possibility of continued upward movement in HYPE’s price in the near term.
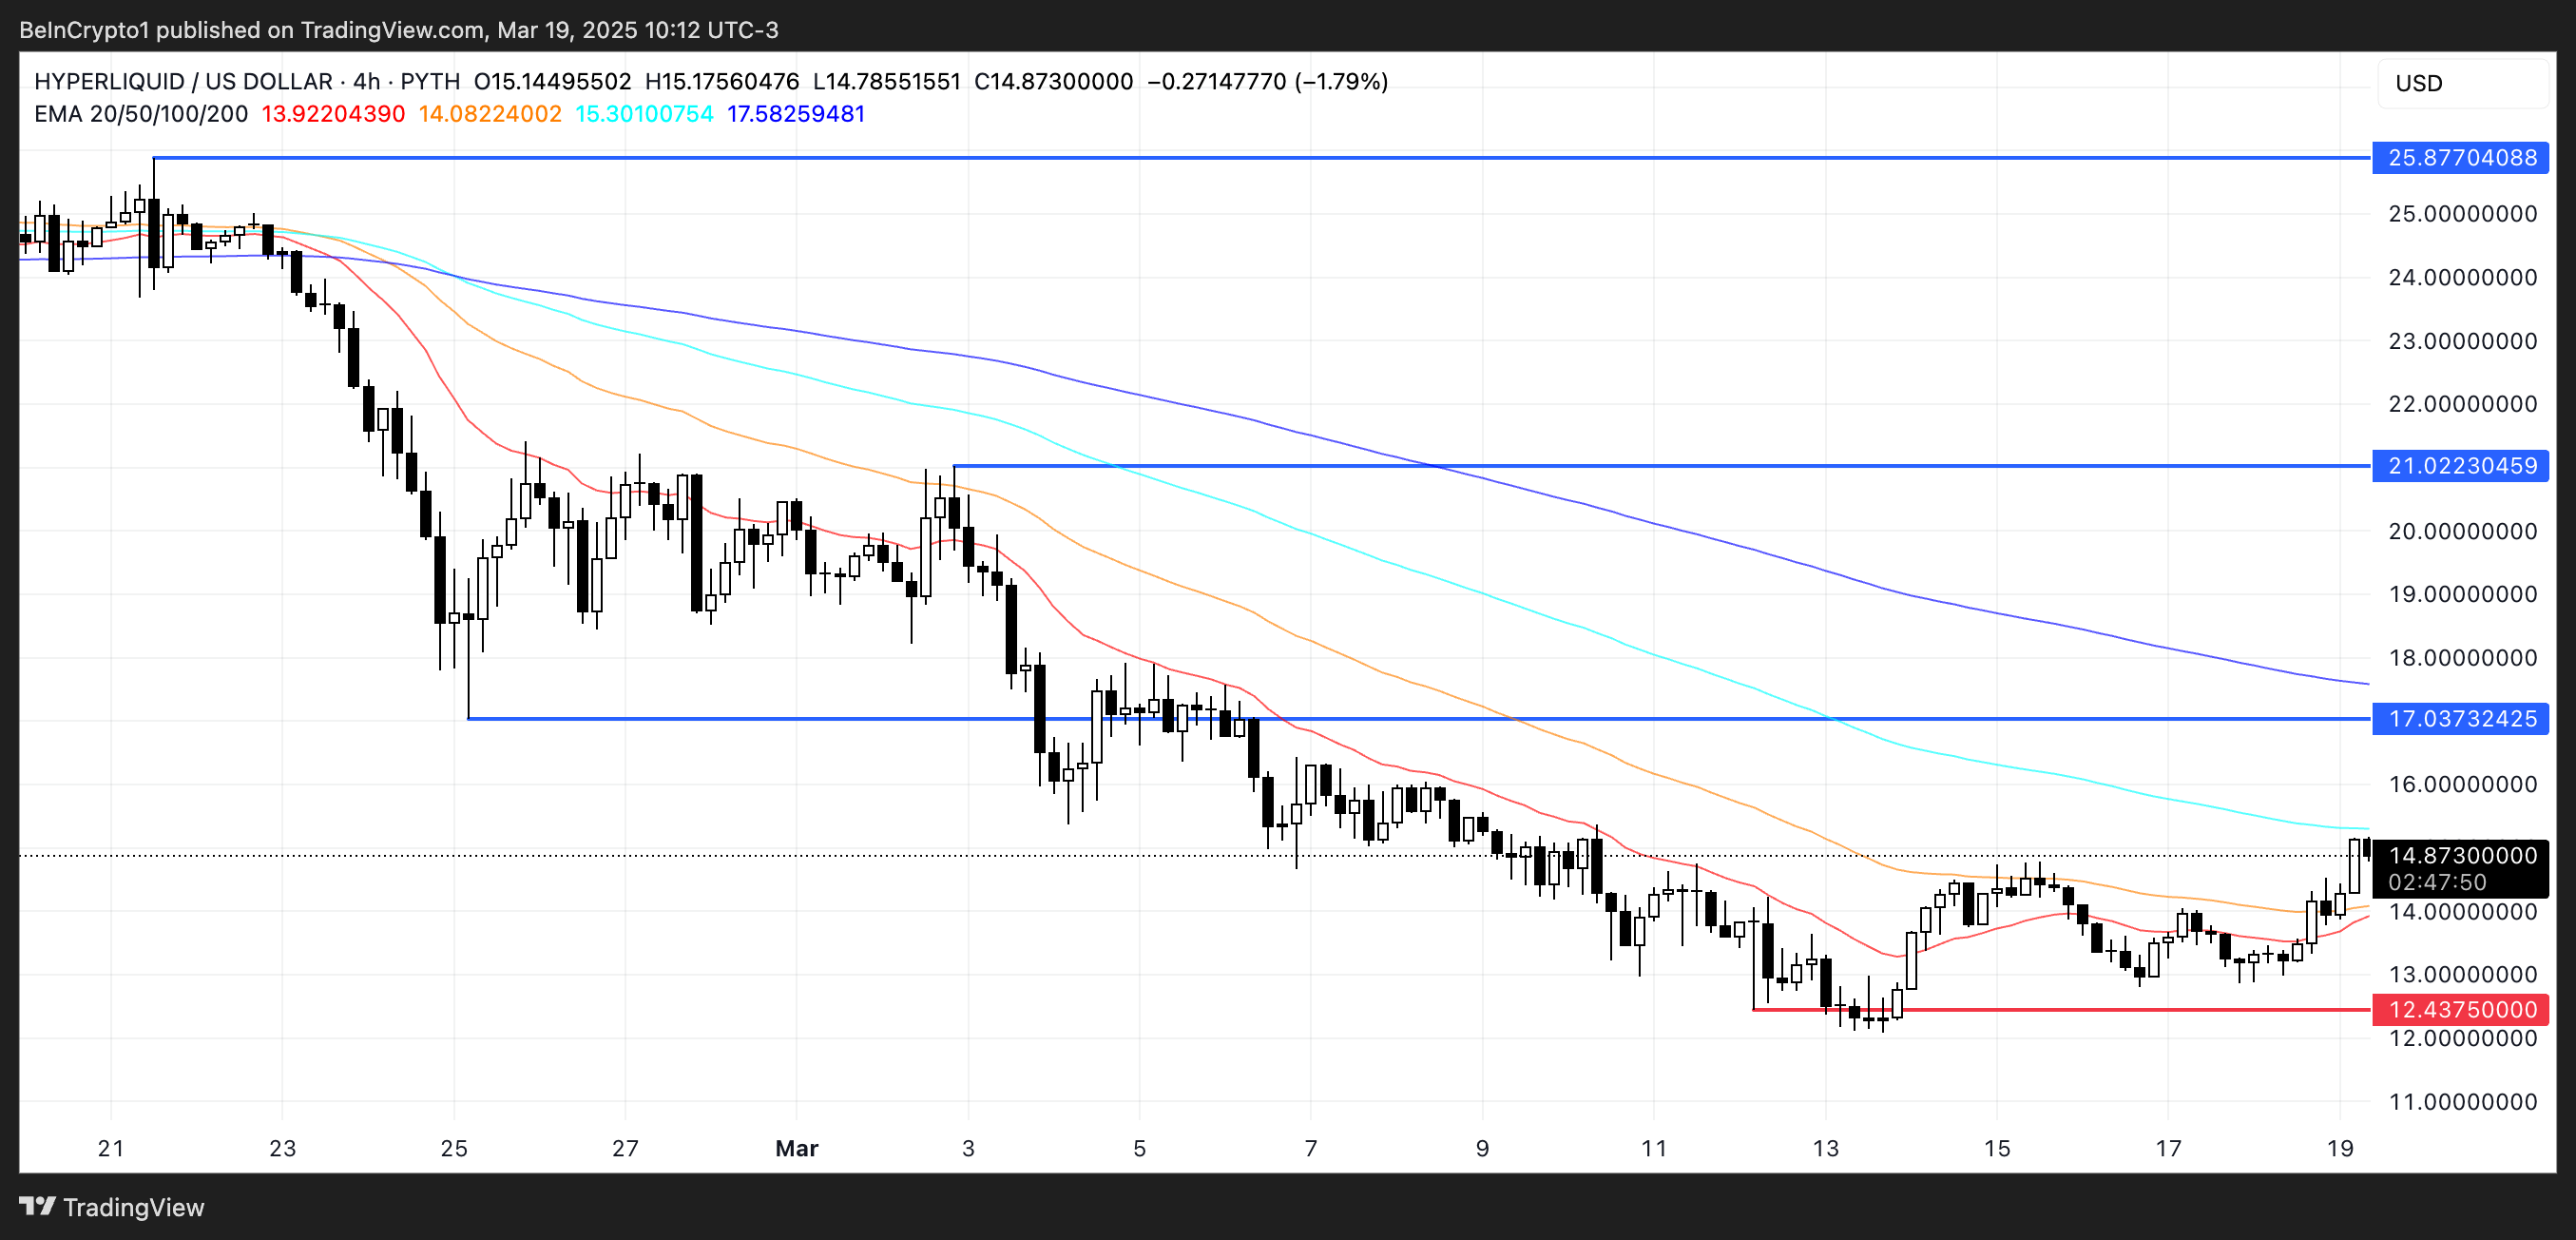
Will Hyperliquid Rise Above $20 This Week?
The HYPE Exponential Moving Average (EMA) lines are converging toward a potential golden cross formation, which occurs when a shorter-term moving average crosses above a longer-term one.
This technical pattern typically signals a strong bullish momentum shift that could propel HYPE to test its immediate resistance level at $17. Should buyers successfully break through this threshold, the path would open for HYPE to climb toward the $21 mark.
In scenarios where exceptional buying pressure materializes, Hyperliquid could extend its gains to challenge the significant resistance level at $25.80, representing a substantial recovery from its recent sub-$20 trading range.
Conversely, if the anticipated uptrend fails to materialize and bearish sentiment prevails, HYPE could experience renewed downward pressure, forcing it to test the critical support level at $12.43.
The importance of this support cannot be overstated, as a breach below this floor could trigger accelerated selling, potentially pushing HYPE under the psychologically significant $12 level for the first time since December 2024.
Bitcoin (BTC) is hovering below the $94,000 level while still showing sensitivity to US economic indicators. Accordingly, this week’s US economic data could spark volatility in the crypto market.
From consumer confidence to labor market strength, economic indicators could influence sentiment and sway crypto prices.
US Economic Data To Watch This Week
The following US economic indicators could affect the portfolios of crypto market traders and investors.
“Let me try to help you make sense of everything that’s going on: Tariff madness, plunging consumer confidence, rising recession odds, market fragility and all the ways that the economy will shape your life,” economist Justin Wolfers remarked.
Consumer Confidence
The Consumer Confidence report will start the list of US economic indicators with crypto implications this week. On Tuesday, April’s Conference Board’s Consumer Confidence Index will show whether households are optimistic about financial conditions.
March’s 92.9 index signaled a relatively pessimistic outlook among US consumers concerning the economy and their financial situation.
According to data on MarketWatch, the median forecast is 87.4. Strong confidence often correlates with risk-on sentiment, driving investment into Bitcoin and altcoins.
Accordingly, reading below expectations might trigger profit-taking, denting confidence in the economy’s overall strength.
With global trade tensions, an unexpected decline could amplify safe-haven demand for Bitcoin, though volatility remains a risk.
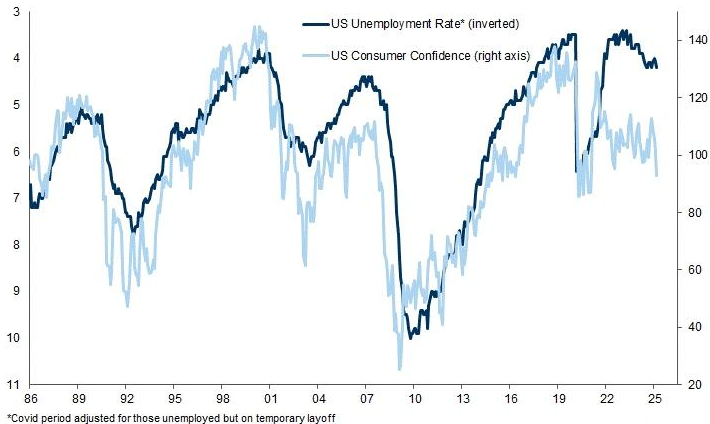
“The soft data suggests that the hard data is set to fall. Consumer Confidence can lead the unemployment rate (inverted). If that ends up being the case this time around, we’re looking at around 6% or higher,” wrote Markets and Mayhem.
JOLTS Job Openings
This week, the Job Openings and Labor Turnover Survey (JOLT), which tracks demand, adds to the list of US economic indicators.
The last JOLTS report was released on April 1, covering February 2025 data. It reported job openings at 7.6 million, hires at 5.4 million, and total separations at 5.3 million. The next JOLTS report, for March 2025, is due on Tuesday, with a median forecast of 7.4 million.
A rebound above 7.6 million for crypto could signal economic resilience, boosting risk assets like Bitcoin. Strong openings suggest hiring confidence, potentially increasing disposable income for crypto investments.
However, a weaker-than-expected figure, potentially below the median forecast of 7.4 million, might stoke recession fears. Such an outcome would drive investors toward Bitcoin as a hedge.
Crypto markets react to labor market signals as they influence Federal Reserve (Fed) policy expectations. With rates at 4.25%–4.5%, a tight labor market could delay cuts, pressuring speculative assets.
ADP Employment
The ADP National Employment Report tracks private-sector job growth and will be out on Wednesday. March 2025’s 155,000 jobs beat expectations, signaling labor market strength despite tariff concerns.
A strong reading above 160,000 for crypto could ignite bullish sentiment, as job growth fuels consumer spending and risk appetite. If employment data suggests economic expansion, Bitcoin could gain more upside potential.
However, a miss below the March reading of 155,000 or below the median forecast of 110,000 might spark fears of a slowdown. This could push investors toward stablecoins or Bitcoin as safe havens.
Unlike the Bureau of Labor Statistics’ Non-farm Payrolls (NFP), ADP’s payroll-based methodology excludes government jobs. This methodology offers a granular view.
With markets eyeing Fed policy, ADP’s outcome will set the tone for Friday’s NFP.
Q1 GDP
The advance estimate for Q1 2025 GDP will be released on Wednesday. This data also measures economic growth.
Q3 2024’s 2.8% annualized rate fell short of expectations, pressured by trade deficits. Meanwhile, Q4 2024’s 2.4% reading came following a downward revision to imports.
Strong GDP growth above 3% in crypto signals economic health, often boosting Bitcoin as investors embrace risk. Nevertheless, crypto markets are sensitive to GDP revisions and influence Fed rate decisions.
With inflation concerns lingering, a strong GDP, higher than Q4’s 2.4%, might reduce rate-cut hopes, pressuring speculative cryptos. Conversely, sluggish growth could spur expectations of monetary easing.
PCE
The Fed’s preferred inflation gauge is the Core PCE (Personal Consumption Expenditures) Price Index. This US economic indicator, covering March, will come out on Wednesday this week after the March 28 data covering February.
After February 2025 saw a 2.5% year-over-year (YoY) PCE index, economists anticipate a modest drop to 2.2% for March, reflecting persistent price pressures.
Nevertheless, a PCE reading below 2.5% for Bitcoin could signal cooling inflation, raising hopes for rate cuts and boosting sentiment toward Bitcoin.
A hotter-than-expected figure above the previous reading of 2.5% might tighten Fed policy expectations. PCE’s exclusion of volatile food and energy prices offers a stable inflation view, making it a key driver of crypto sentiment.
With markets sensitive to monetary policy shifts, traders should monitor services spending, as it reflects consumer resilience. Nevertheless, volatility is likely, as PCE shapes the Fed’s rhetoric.
“March PCE inflation (out on Wed Apr 30) should read 2.1% (rounded). April PCE (out in late May) should read 2.0% (rounded). Tariffs are a boss but this is the Fed’s target measure. It could be time to cut, to be honest, politics aside,” wrote hedge fund manager Ophir Gottlieb.
Initial Jobless Claims
This week, the Initial Jobless Claims, reported every Thursday, adds to the list of US economic indicators. This data measures weekly unemployment filings. Claims are a high-frequency indicator, offering real-time labor market insights, and crypto markets often react swiftly to surprises.
For the week ending April 18, 222,000 claims indicated a steady labor market despite tariff chaos. Accordingly, claims below 222,000 could signal growing employment, fostering risk-on sentiment, and lifting Bitcoin.
However, higher claims above 222,000 could spark concerns of economic softening, driving investors to stablecoins or Bitcoin for safety. With the Fed closely monitoring labor data, an unexpected spike might fuel rate-cut speculation.
Non-farm Payrolls
The Non-farm Payrolls (NFP) report will be released on Friday. March 2025’s 228,000-job gain exceeded expectations, with unemployment at 4.2%.
A strong NFP could drive bullish momentum, as job growth signals consumer spending power. A weak report below the median forecast of 130,000 might trigger recession fears, pushing capital to Bitcoin as a hedge or stablecoins for stability.
NFP’s broad scope, covering 80% of GDP-contributing workers, makes it a market mover. Key interest will also be on wage growth, as 0.3% monthly increases suggest inflation pressures, potentially capping crypto gains.
With markets pricing in Fed policy, surprises could spark sharp volatility.
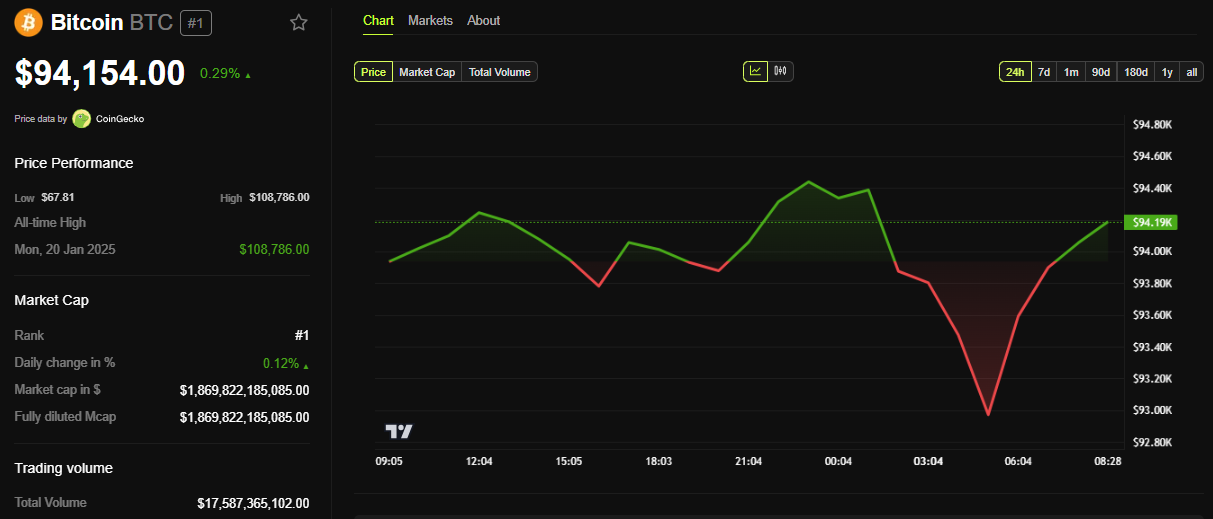
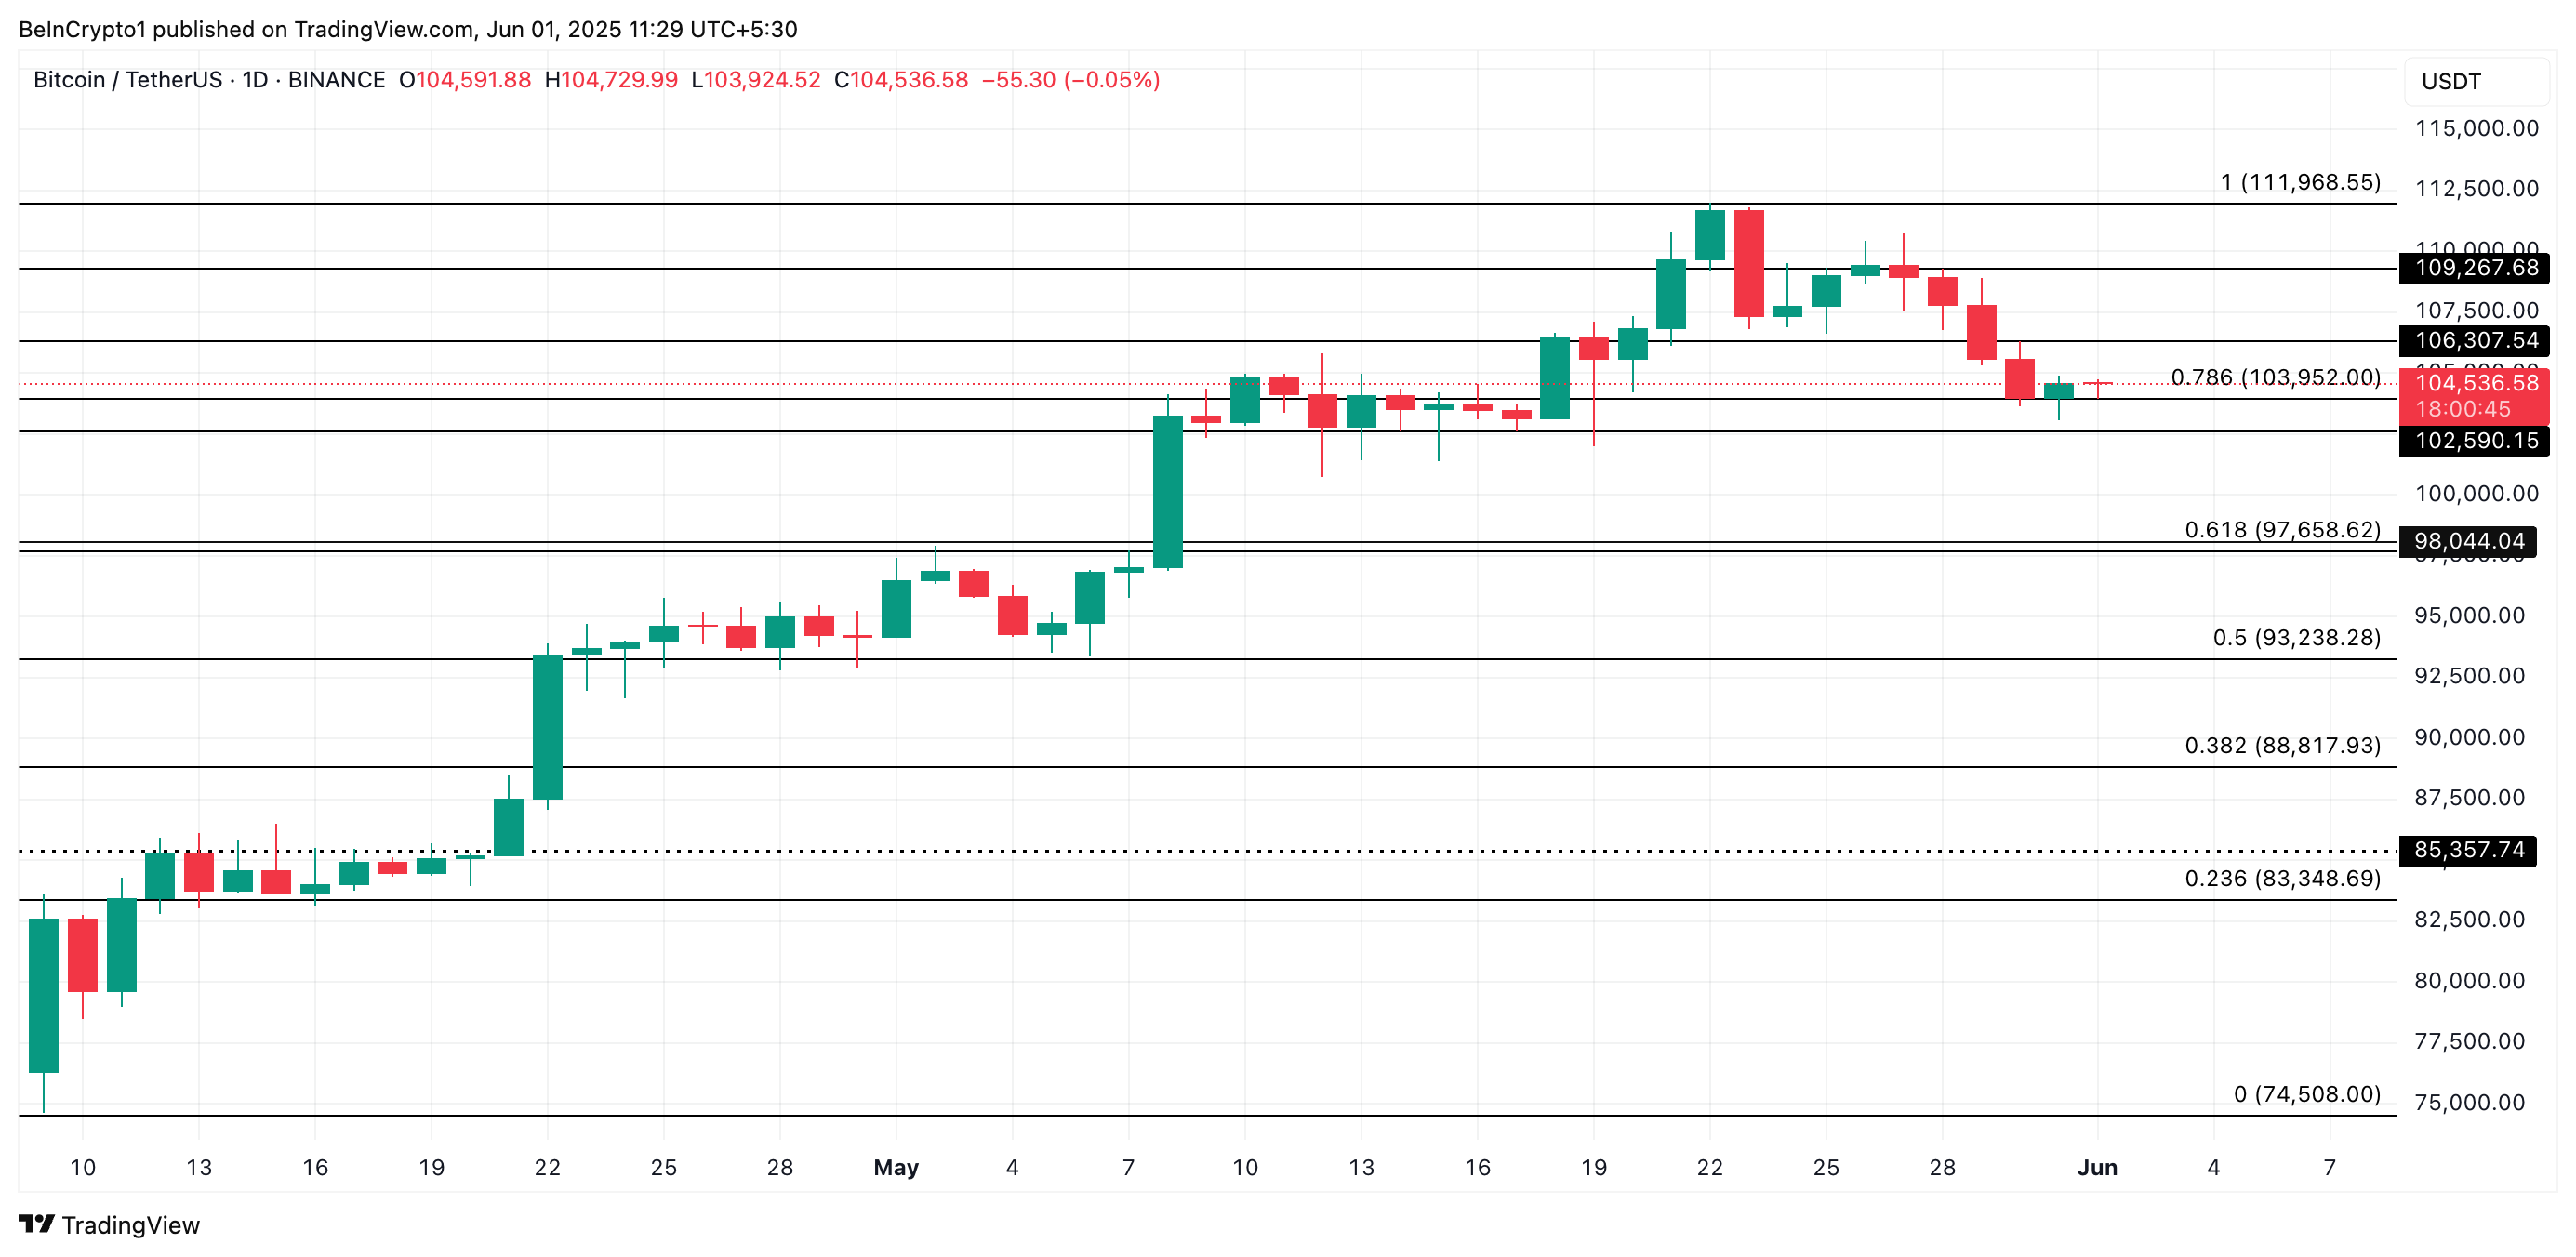
Leading coin Bitcoin has been in a corrective phase since hitting its all-time high of $111,968 on May 22. The king coin has slipped below the key $105,000 support level to trade at $104,536 at press time, reflecting the selling pressure.
However, on-chain data suggests a potential rebound above this critical support level, with a possible retest of BTC’s all-time high on the horizon. This analysis breaks down the key insights.
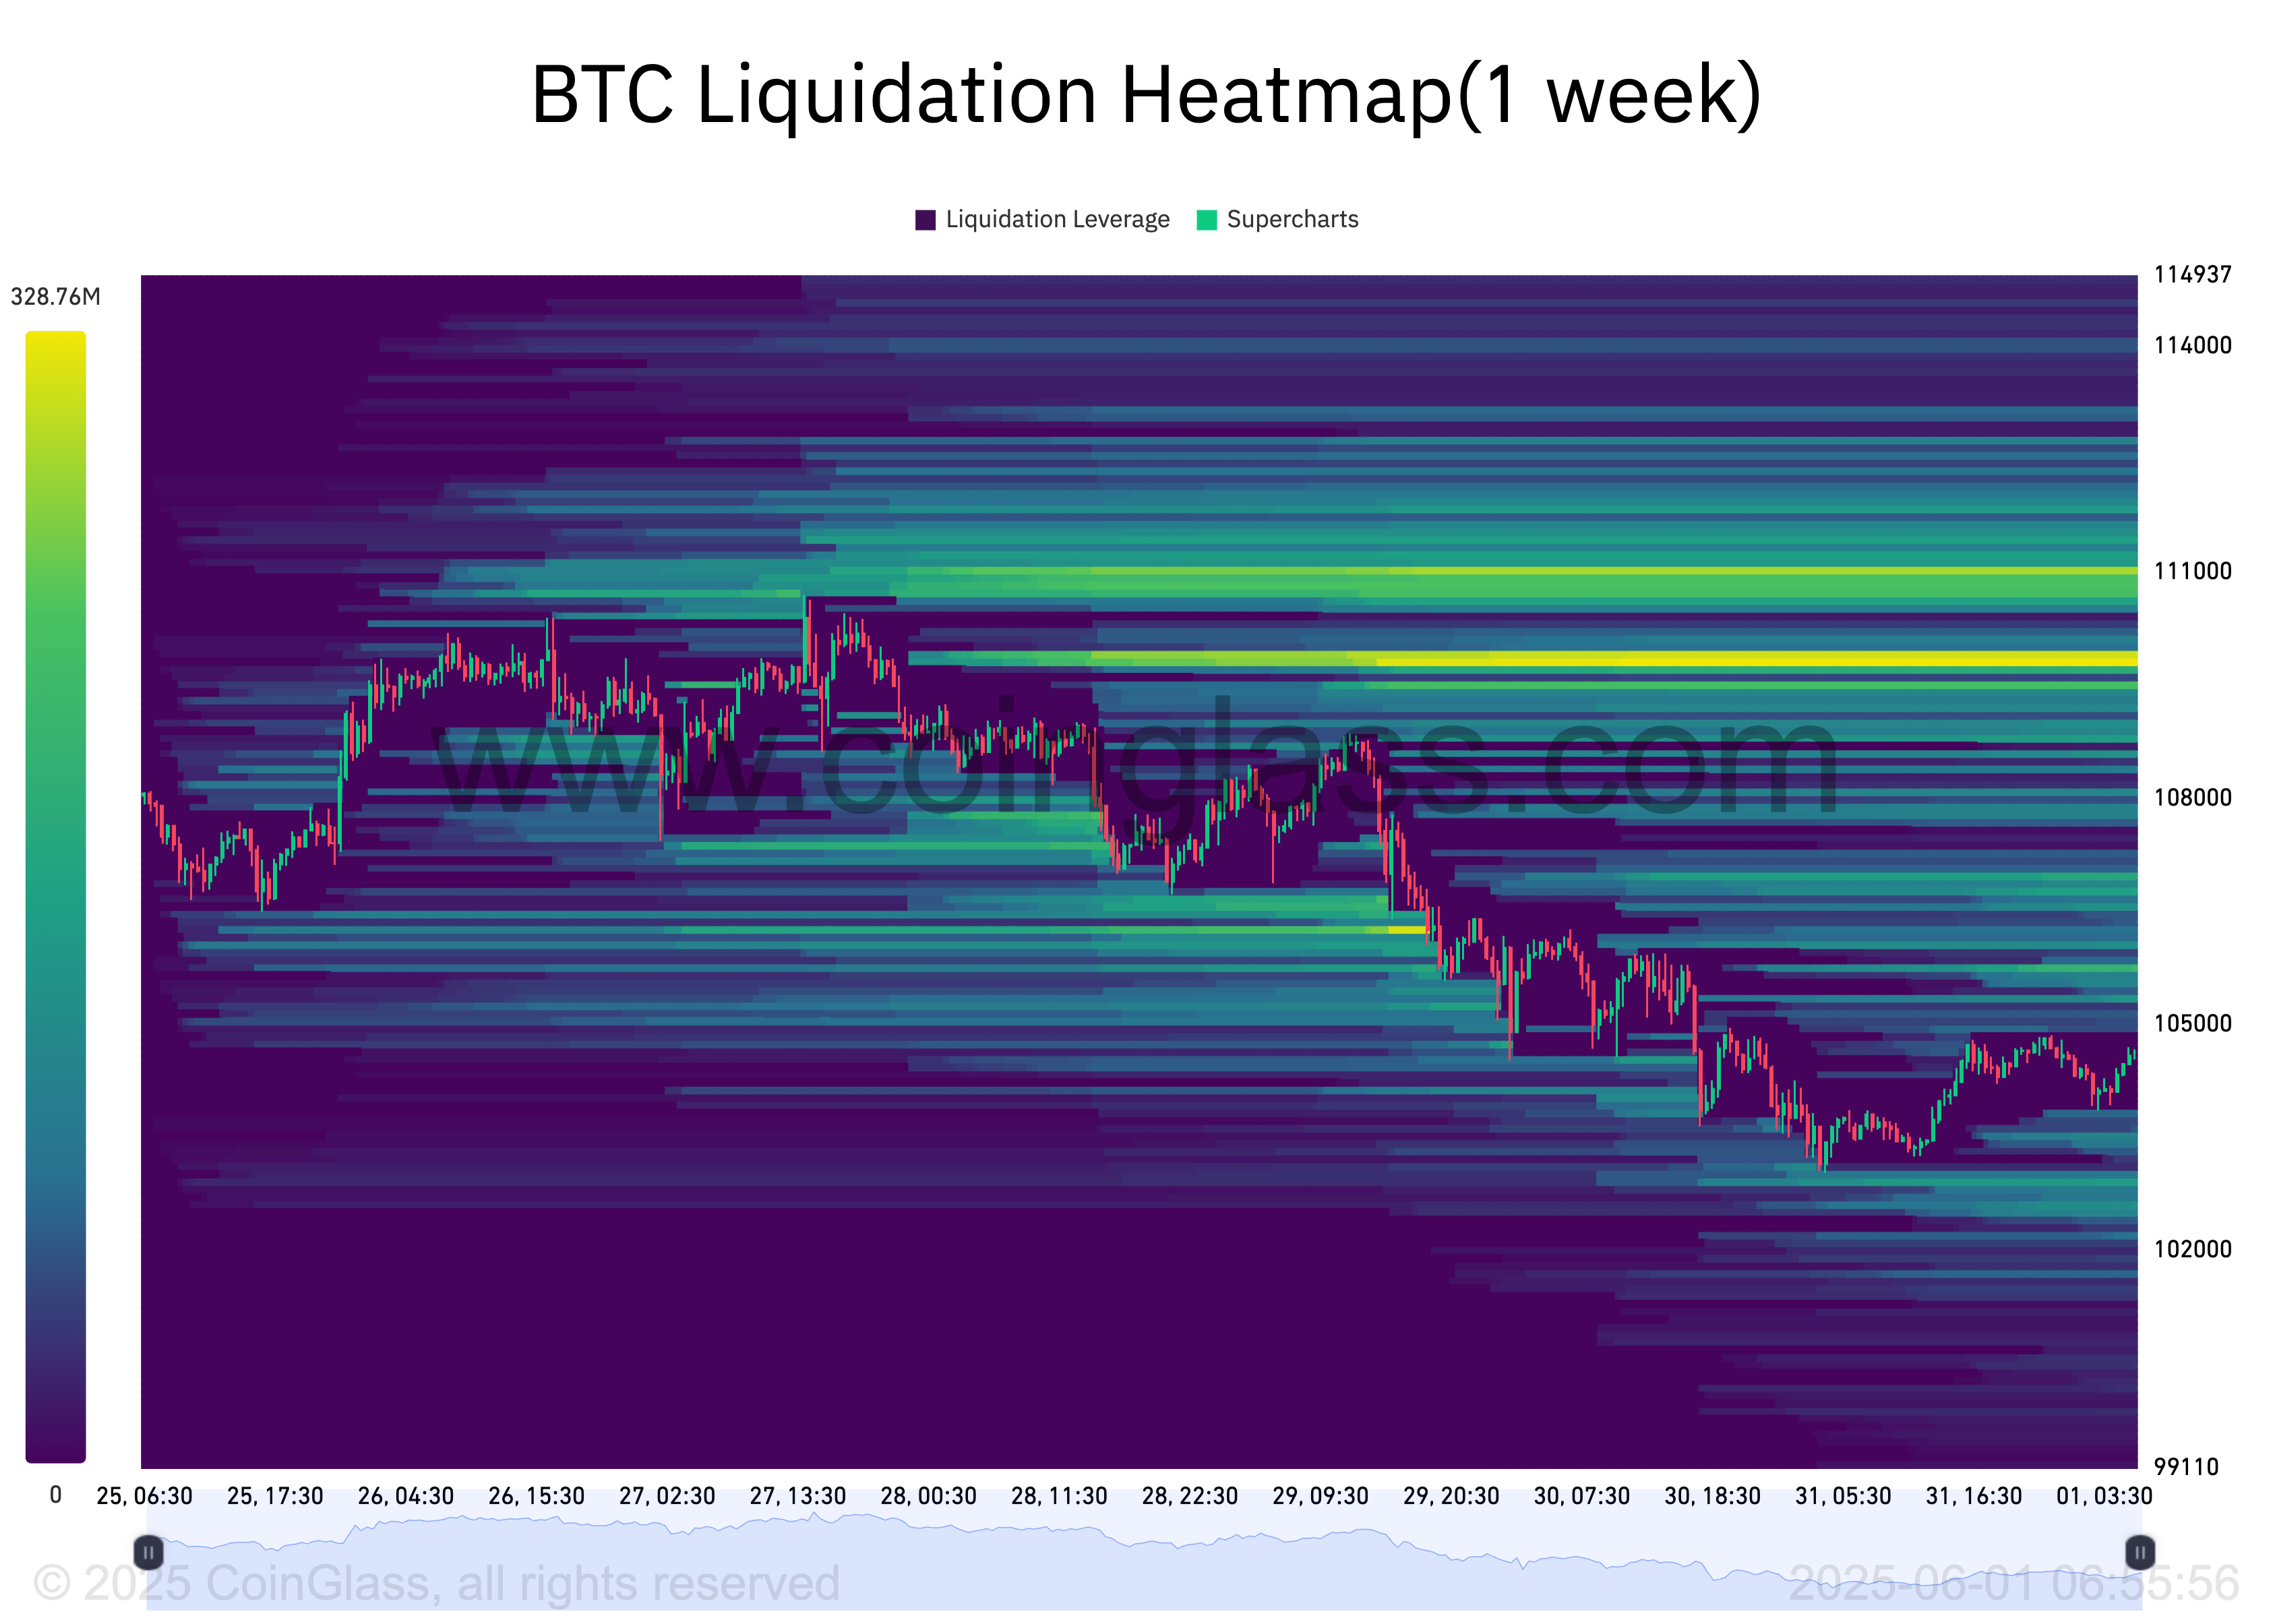
BTC Liquidity Clusters Signal Surge Toward $109,000
An assessment of BTC’s liquidation heatmap shows a notable concentration of liquidity around the $109,933 price zone.
Liquidation heatmaps identify price levels where large clusters of leveraged positions are likely to be liquidated. These maps highlight areas of high liquidity, often color-coded to show intensity, with brighter zones (yellow) representing larger liquidation potential.
Usually, these cluster zones act as magnets for price action, as the market tends to move toward these areas to trigger liquidations and open fresh positions.
Therefore, for BTC, the convergence of a high volume of liquidity at the $109,933 price level indicates a strong trader interest in buying or closing short positions at that price. It creates room for a surge toward the $109,000 mark.
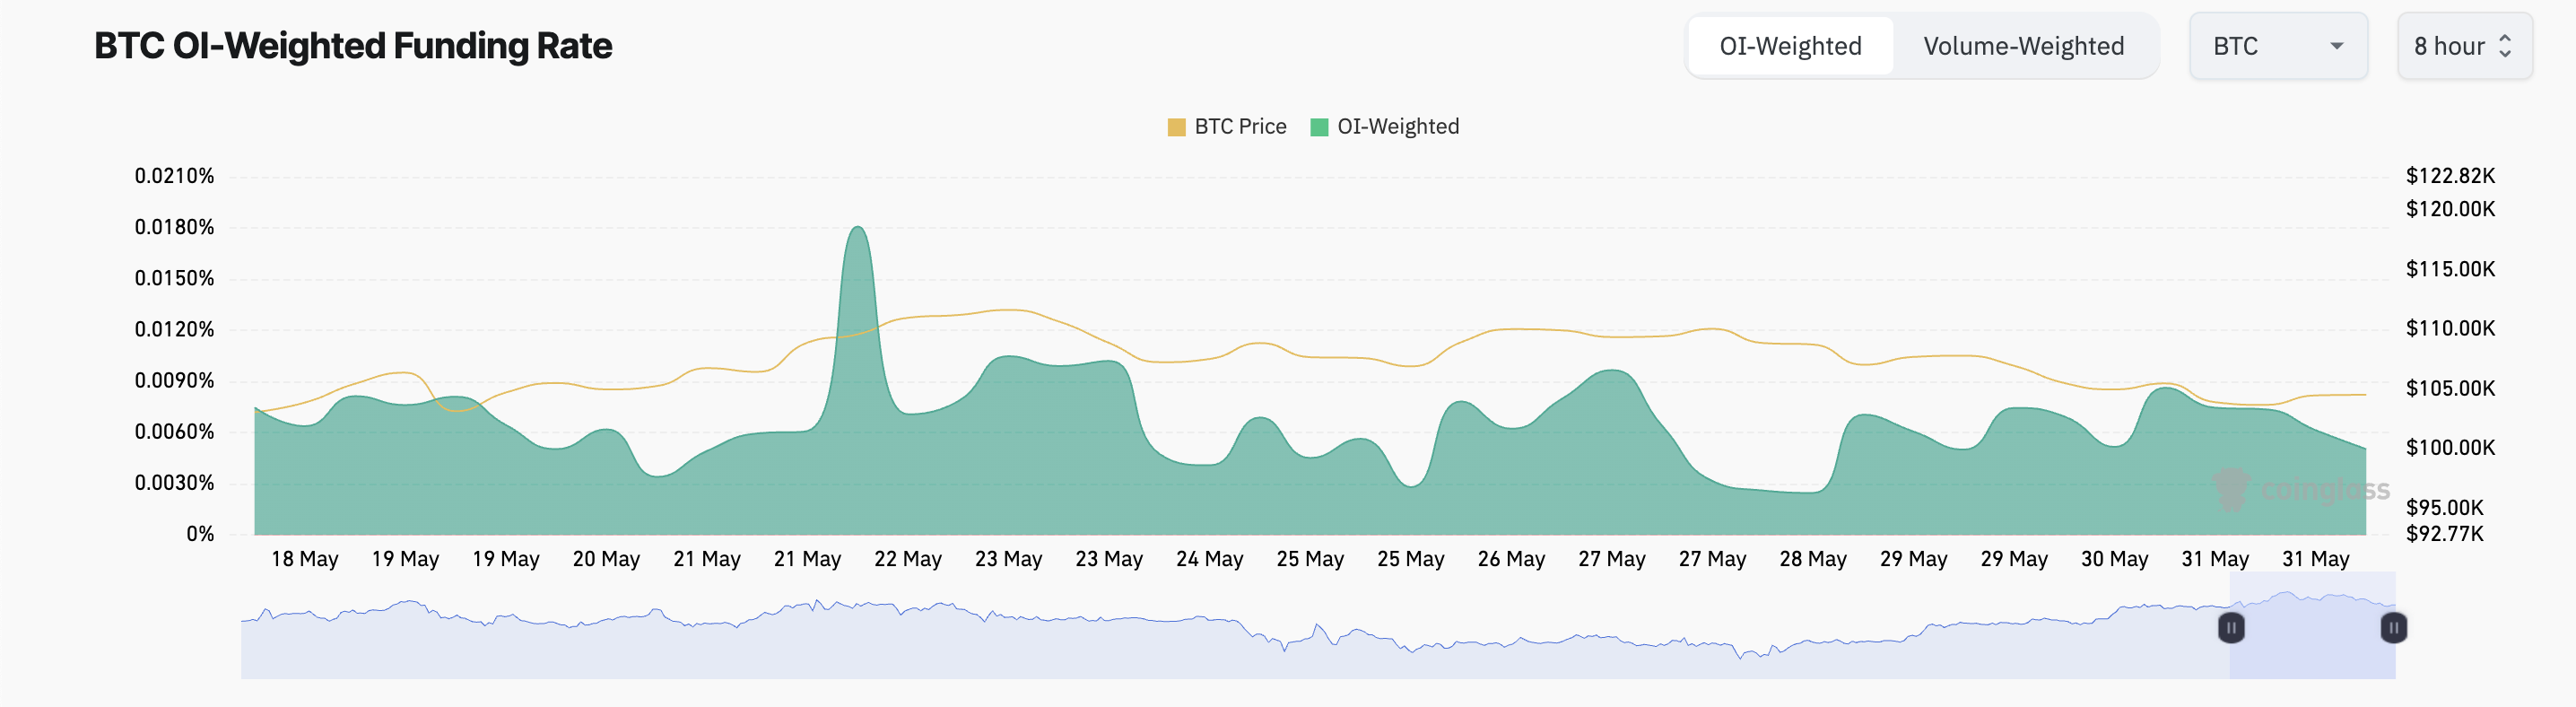
Further, the coin’s funding rate has remained positive despite its recent price pullback. At press time, this stands at 0.005%, per Coinglass.
The funding rate is a periodic payment between traders in perpetual futures contracts to keep the contract price aligned with the spot price. When the funding rate is positive, there is a higher demand for long positions.
This means more traders continue to bet on BTC’s price going up, even in the face of strengthening bearish momentum.
BTC Price Teeters Between $103,000 Support and $109,000 Liquidity Zone
BTC has posted a modest 1% gain in the past 24 hours, bouncing off the $103,952 support level. If demand soars, this support floor could hold firm and push prices above the psychological barrier at $105,000, potentially targeting $106,307.
A clean break above this zone may open the door to the $109,000 price area dense with leveraged positions.
BTC Price Analysis. Source: TradingView
However, increased profit-taking could drag BTC back below $103,952, with a further decline toward $102,590 likely.