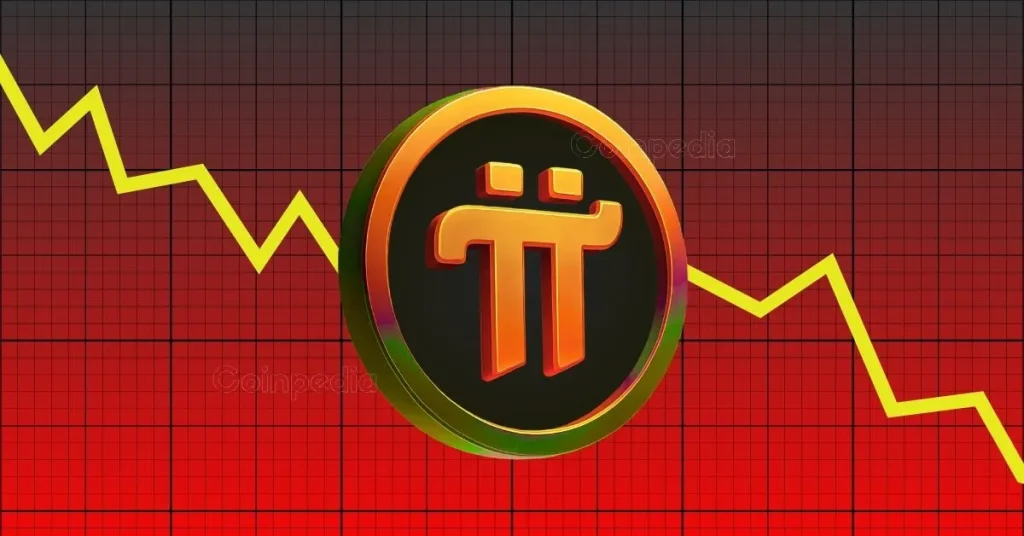
It has been over 3 months since the Pi Network’s open mainnet was launched after a long wait of over 4 to 5 years. In these months, the network has made some huge progress, including breaking into the top 20 crypto post-launch. Trending across social media platforms and boasting over 60 million users. Moving forward, Pi price appeared to be more secure with an increase in real-world adoption along with more exchange listings. However, the PI price has remained highly volatile, while heavy token unlocks have made it too risky to deal with.
Now that the bearish flags have been fluttering over the Pi price rally, will the bulls prevent excessive price drain?
After the rebound from the support below $0.7, the PI price appeared to have triggered a fine reversal. Meanwhile, a close observation suggests diverse price action. The token experienced two major spikes followed by liquidations, with a clear bearish setup leading to a decline of over 52%. In the long term, the outlook remains bearish with a target near $0.3, representing about an 80% potential downfall.
In a wider perspective, the PI price has remained under massive bearish influence, which portrays the Gaussian Channel. The price is trading much below the resistance of the channel. which is currently bearish. Besides, the CMF has triggered a bearish divergence while in an attempt to trigger a recovery. Moreover, the volume has dropped significantly, signalling a drop in trading activity. With this, the PI price seems to be preparing for another pullback, which may drag the price down by another 10% to 15%.
Will the PI price remain stuck within a bearish trend?
The PI price may undergo minor price variations in the short term, which could keep the token consolidated above the crucial support in the long term. Besides, the upcoming unlocks are expected to increase the volatility, which could, in turn, have a positive impact on the rally. However, to do so, the PI price is required to breach above $1 and sustain for a long time without undergoing a correction.
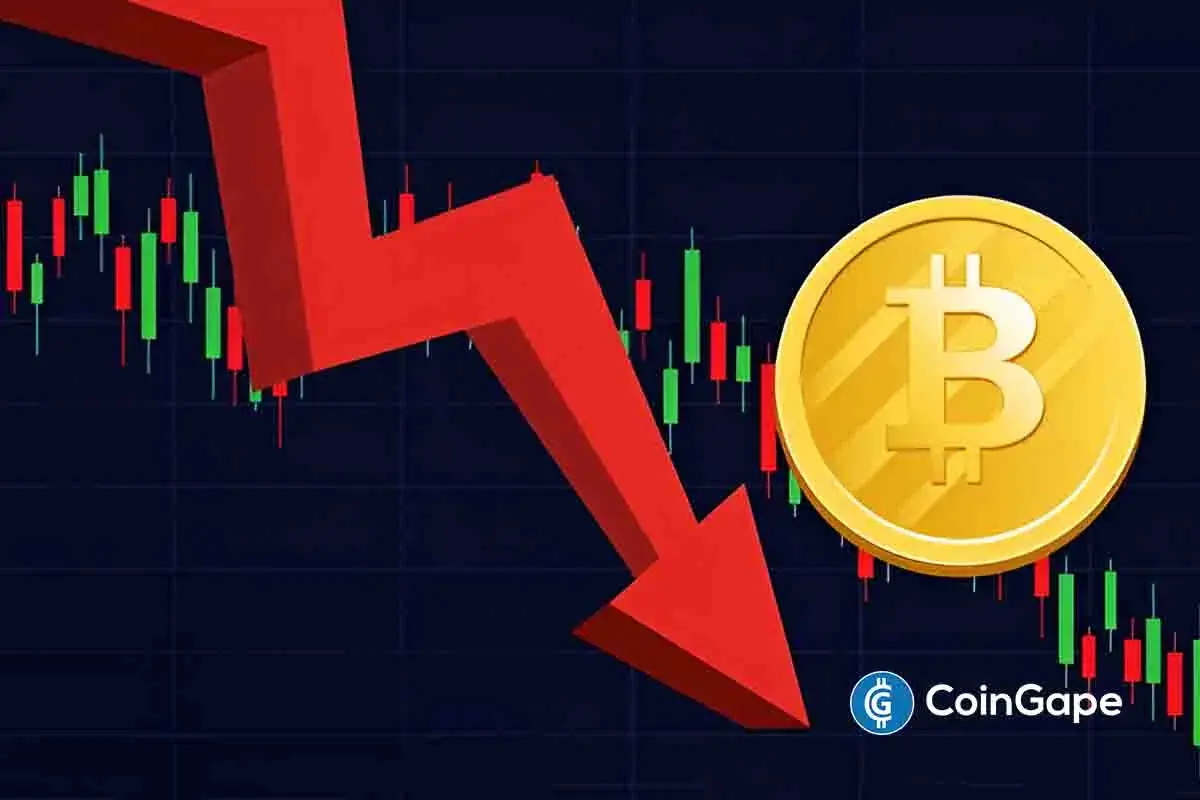
Bitcoin price forecast enters a critical phase as BTC trades near record highs. While macro trends and ETFs support the rally, on-chain activity warns of a looming correction, with long-term holders offloading coins near peak levels.
Bitcoin price tops $94K setting new peak in 3 consecutive days
Bitcoin extended its recent rally to reach a new all-time high of $94,220 on April 23, climbing nearly 4% over the last 24 hours. This marks the third consecutive day the leading cryptocurrency has posted a fresh peak, beginning April 20.
Bitcoin price action, April 23 | Coingecko
The bullish momentum follows renewed macroeconomic uncertainty, as former President Donald Trump intensifies political pressure on Federal Reserve Chair Jerome Powell, reigniting investor concerns over monetary policy direction.
Traders and institutional players appear to be pricing in heightened volatility in traditional markets, as Trump publicly criticized the Fed’s current leadership and reaffirmed his stance on aggressive tariffs.
These statements have catalyzed a rotation of capital from risk-weighted equity sectors into Bitcoin and related crypto products. This trend is in line with BTC’s historical behavior as a hedge asset during periods of political and monetary instability.
Bitcoin ETFs pulled highest inflows since inception
Bitcoin ETFs posted their strongest single-day net inflow in 2025 on Tuesday, with over $921 million added to fund holdings, according to Farside data. The record-breaking inflow underscores rising institutional demand, particularly as macroeconomic concerns and trade policy risks escalate.
Bitcoin ETF flows, April 22, 2025 | Source: Farside
The spike in ETF allocations occurred as traditional stock indices wavered midweek amid renewed trade rhetoric from Trump’s camp and speculation surrounding the potential ousting of Fed Chair Jerome Powell.
Analysts interpret this as a reallocation of capital, with Bitcoin ETFs benefitting from risk-off sentiment in equities.
The $100,000 psychological barrier now appears within reach, yet on-chain signals suggest underlying risks that could derail momentum.
Age Consumed surged to 12 million BTC signalling intense profit take from long-term holders
While price and institutional inflows point to a strengthening bull cycle, on-chain data tells a more nuanced story.
According to Santiment, Bitcoin’s Age Consumed—a metric tracking the movement of previously dormant coins—spiked dramatically from 2.03 million BTC on April 19 to over 12 million BTC by April 23.
This sharp increase in Age Consumed signals that Bitcoin long-term holders are moving large quantities of previously idle coins, often associated with profit-taking or strategic exits.
Bitcoin Age Consumed vs. BTC price | Source: Santiment
The sudden surge in Age Consumed typically reflects distribution from older wallets, a trend that has historically preceded local tops or significant pullbacks.
The movement suggests that some long-term investors may be capitalizing on Bitcoin’s latest highs, potentially dampening bullish momentum in the near term.
While not definitive on its own, the Age Consumed spike introduces a cautionary signal as Bitcoin approaches the psychological $100,000 mark. If selling pressure from long-term holders intensifies, it could introduce volatility or stall further gains—even in the face of bullish macro and institutional trends.
Bitcoin price forecast today: Bull trap risk looms near $94K as weekly chart hits upper Bollinger band
Bitcoin price forecast signals today show bulls attempting to breach the $95,000 as BTC taps the upper Bollinger Band on the weekly chart. While the rally from sub-$80,000 lows marks a strong technical rebound, traders may need to exercise caution.
BTC price has now entered the resistance zone near $94,000–$107,000, where past weekly candles have previously faced rejection.
The Bollinger Bands (BB) upper line at $107,383 acts as a key resistance ceiling. Unless this level is breached with volume, BTC risks rejection at the top of its volatility envelope.
Momentum indicators show mixed signals. The Relative Strength Index (RSI) stands at 57.37, just above its moving average (54.20), hinting at mild bullish bias—but still well below overbought levels.
However, the RSI Moving Average Histogram (RSI-MA) shows a divergence, with the slower red MA at 60.61 still declining while the green bar is only at 47.61. This suggests momentum remains fragile.
Given these conditions, Bitcoin price forecast may be susceptible to a bull trap if price fails to decisively close above $94,000 with strong follow-through. Without confirmation, profit-taking could trigger a reversal toward the mid-Bollinger level around $92,200 or lower support near $77,000.
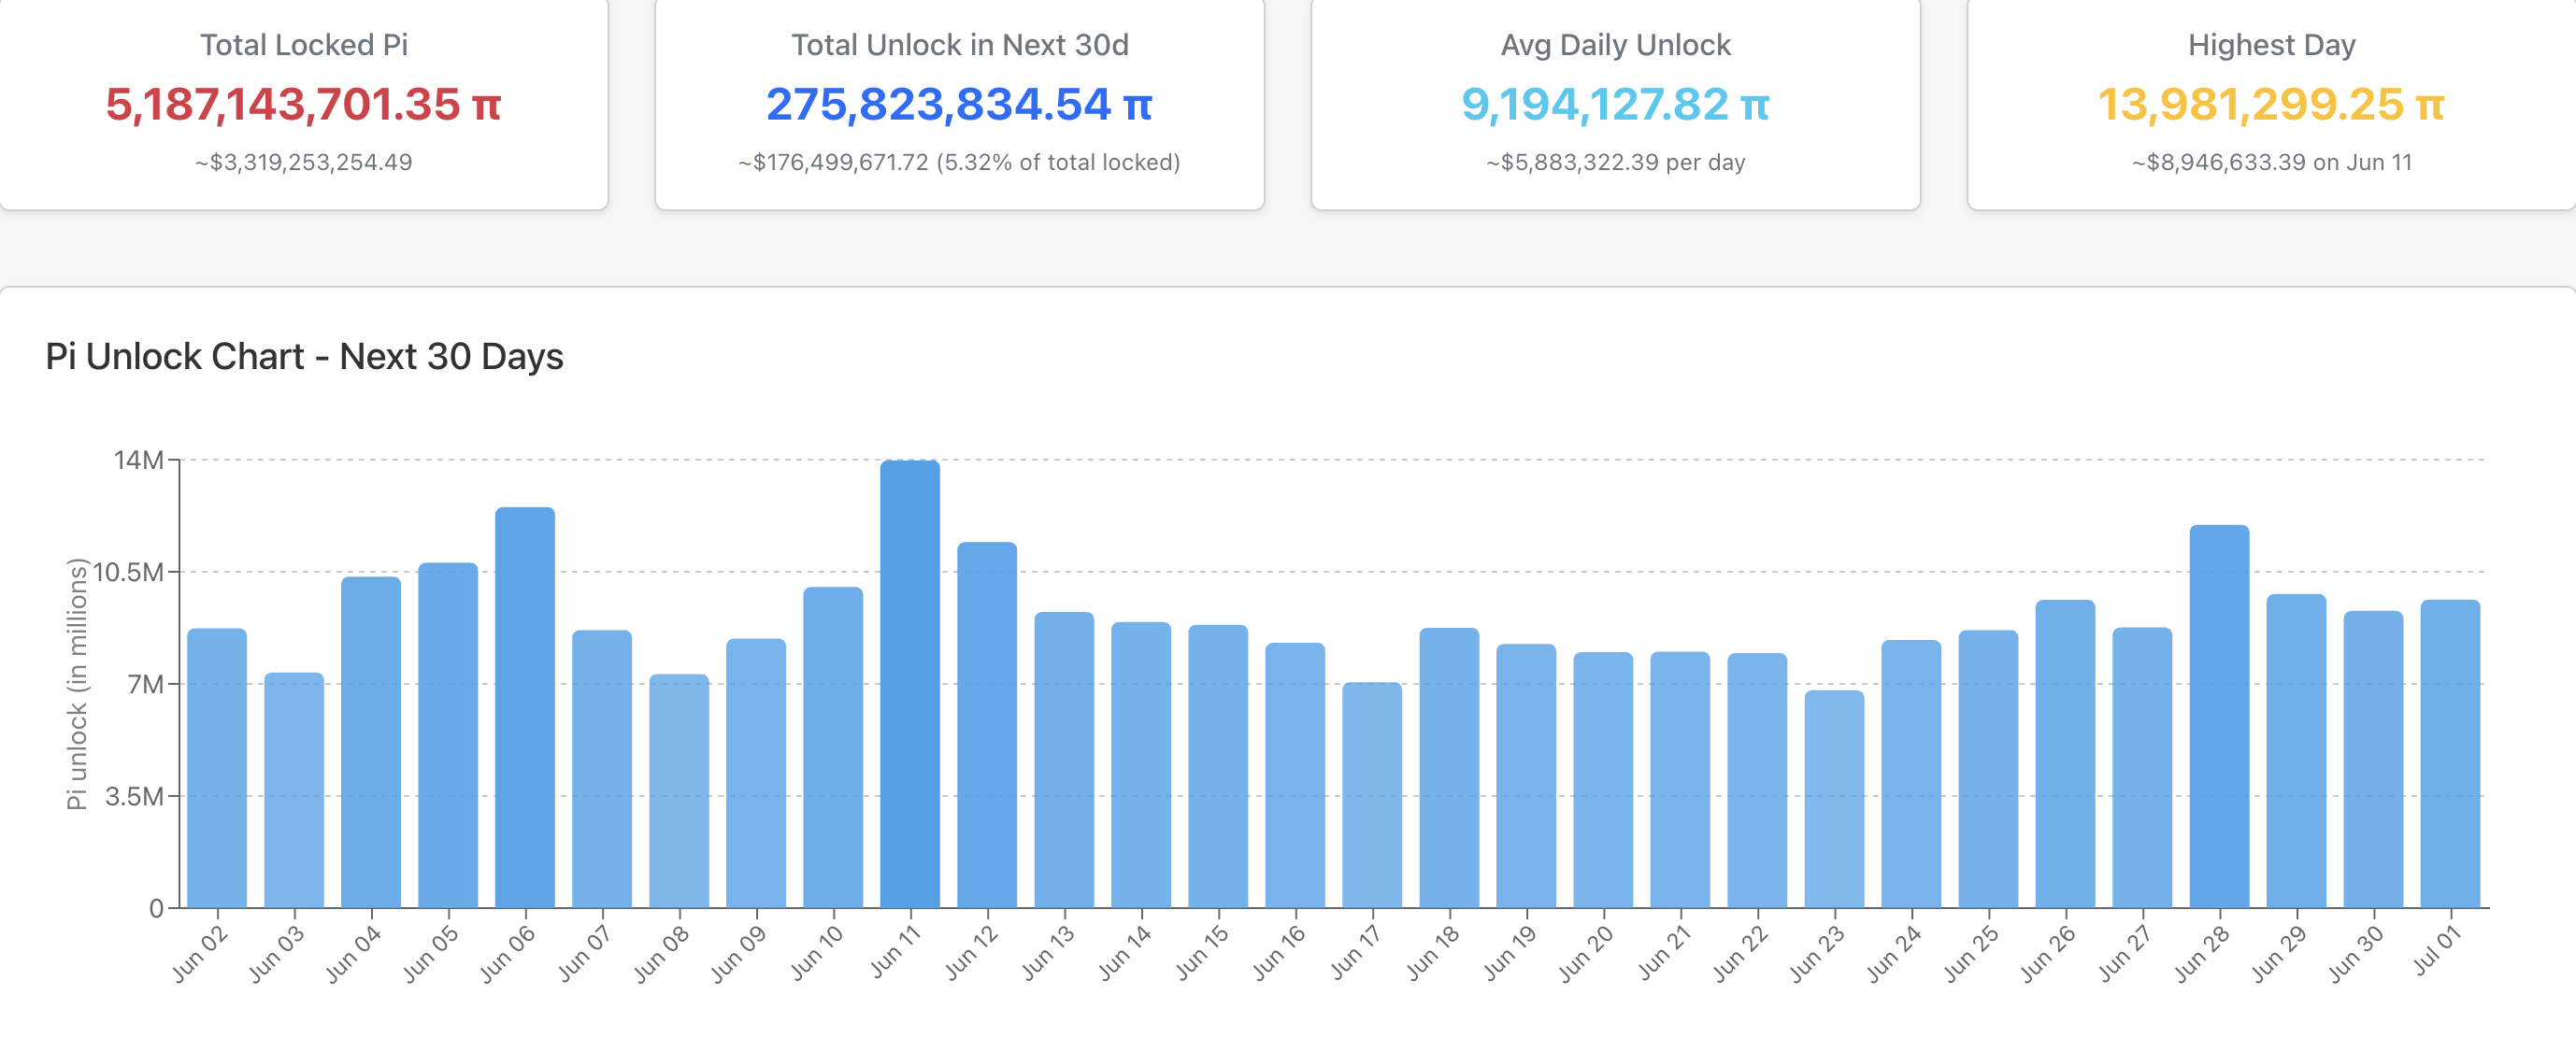
PI is poised to unlock over 250 million tokens in June, a move that could significantly intensify the selling pressure already weighing on the altcoin.
With technical indicators showing dwindling investor interest, PI could slide to its all-time low of $0.40 or even breach that threshold.
Pi Network Braces for June Unlock
According to data from PiScan, Pi Network is scheduled to unlock 276 million PI tokens in June. At market prices, these tokens are currently valued at approximately $176 million.
With market participants already cautious due to ongoing price weakness and low trading volume, the timing of this unlock could be particularly disruptive. Generally, an influx of tokens leads to heightened selling pressure, especially when investor sentiment is already bearish and there is no adequate demand to absorb the new supply.
This is the case with PI, as readings from its daily chart show signs of a continued decline in capital inflows. For example, the token’s Relative Strength Index (RSI) is in a downward trend and below the 50-neutral line at 40.49.
The RSI indicator measures an asset’s overbought and oversold market conditions. It ranges between 0 and 100. Values above 70 suggest that the asset is overbought and due for a price decline, while values under 30 indicate that the asset is oversold and may witness a rebound.
PI’s RSI readings indicate a preference among market participants for distribution over accumulation. If this trend continues, its price could continue to slip.
Furthermore, the token’s Aroon Down Line is at 86%, confirming the strength of the decline. The Aroon indicator is used to identify trend direction and strength. When the Aroon Down line is close to 100%, it suggests that recent price action has consistently hit new lows, indicating strong bearish momentum.
Cryptocurrency exchange Gemini has announced the listing of Ripple’s stablecoin RLUSD on its exchange, enabling trading, deposits, and withdrawals.
This marks a significant step forward in the global adoption of RLUSD. Moreover, the listing triggered a surge in RLUSD’s trading volume, which has increased by 63.7%.
“RLUSD is now available for trading on Gemini. Deposits and withdrawals are enabled. Buy, sell, and store today,” the post read.
The move positions Gemini alongside other major exchanges supporting RLUSD trading. For instance, Bitstamp enabled trading for the stablecoin on January 8. Meanwhile, Kraken followed suit on April 2.
Notably, Gemini’s listing had a positive impact on RLUSD. Following the announcement, the stablecoin’s 24-hour trading volume surged to over $52 million, reflecting a 63.7% increase over the past day, according to data from CoinGecko.
Since its launch late last year, the stablecoin has seen remarkable growth. Its market capitalization has risen 338.6% since the beginning of 2025. As of the latest data, it stands at $317 million.
Although the market cap remains modest compared to industry leaders like Tether (USDT) and USDC (USDC), analysts remain optimistic about RLUSD’s prospects.
“Ripple’s RLUSD stablecoin has exploded since launch, now pushing over $860 million in monthly volume. It’s fully backed, built on the XRP Ledger and Ethereum, and already integrated into Ripple Payments. Kraken, Bitstamp, and LMAX Digital have listed it. This is Ripple’s enterprise-grade answer to global stablecoin demand, and it’s built for compliance, scalability, and cross-border dominance,” a user wrote on X.
Meanwhile, the broader stablecoin ecosystem is also positioned for significant growth. According to forecasts from the US Treasury, the market capitalization could reach $2 trillion by 2028.
Furthermore, Citigroup’s projections estimate that the market cap could soar to $3.7 trillion by 2030. This overall expansion of the stablecoin market is expected to benefit RLUSD as well, driving further integration and usage as the demand for stablecoins continues to rise.