The crypto market faces a bearish weekend, and Cardano (ADA) has not been spared after a 3% drop to trade at $0.75. ADA price is also losing its footing after dropping in market cap ranking to the ninth position. Despite the bearish outlook, there are distinct reasons why ADA may recover to the upside and possibly reach higher levels. These include a strong technical outlook and higher odds that the SEC will approve a spot Cardano ETF. ADA Price Gears for a 75% Rally The key reason behind a bullish Cardano price forecast is a bullish technical outlook as it tests resistance at the upper trendline of a descending triangle pattern. ADA has been testing a breakout from this resistance line for the past two weeks. If demand rises and Cardano overcomes resistance at the 50% Fibonacci level of $0.91, it will fuel a 75% run to the $1.32 price…. Read More at Coingape.com
The crypto market is stabilizing as Bitcoin (BTC) recovers above $85K, with Ethereum and XRP prices maintaining above $1,500 and $2 respectively. This comes after China announced new tariffs on U.S. imports in response to President Donald Trump’s 145% tariff on Chinese products. Additionally, this week’s CPI and PPI data came below expectation, boosting the prices of Bitcoin and altcoin markets. This has left room for a significant recovery rally in the coming week as buying demand rises exponentially.
Bitcoin Price Analysis
Bitcoin has surged above the crucial $85K level and is now aiming to maintain its recovery rally toward upcoming resistance channels. As of writing, BTC price trades at $84,864, surging over 3.2% in the last 24 hours.
The 20-day average price ($82,246) is starting to rise, but the RSI (which measures buying and selling strength) is hovering within the buying region at level 64, suggesting that the downward pressure is easing up a bit. As Bitcoin hovers around strong resistance channels, it’s likely to face downward correction. However, if buyers hold the momentum above $85K, the price might climb to $89,000 and possibly even $95,000 next week.
On the flip side, sellers will likely try to block that move and push the price back down below the $78K support. If they succeed, Bitcoin could fall again to retest the crucial $74.5K support level.
Ethereum Price Analysis
Ether bounced off critical $1,500 as sellers are having a hard time keeping the price down. As of writing, ETH price trades at $1,645, surging over 5% in the last 24 hours.
The moving averages are trending up, and the RSI is in positive territory, which means buyers are having an advantage. They’ll likely try to hold the price above the descending resistance line. If this happens, we might see ETH price skyrocketing toward the crucial resistance around $2,000 next week.
To avoid that, sellers need to quickly push the price below the EMA20 trend line. If they manage that, Ether could decline toward $1,386. That level is important because if the price goes below it, it could signal a short-term change in momentum away from the bulls.
XRP Price Analysis
XRP climbed back above the $2 level and is aiming to maintain a trend above the EMA200 trend line on the 4-hour chart. As of writing, XRP price trades at $2.13, surging over 5.51% in the last 24 hours.
If XRP manages to rise above the 200-day moving average, it would suggest that the recent drop toward $2 heavily attracted buying demand. In that case, the price could continue to climb toward the resistance line at $2.25, where sellers are likely to step in again. A surge above this level might send the price toward $2.6.
If the price drops from the $2.25 level, sellers might try to push XRP/USDT down to the key support at $2. Buyers will likely defend that level strongly, because if it breaks, the price could fall further to around $1.6.
The post Bitcoin, Ethereum, and XRP Price Prediction: Will BTC, ETH, and XRP See a Bullish Week Ahead? appeared first on Coinpedia Fintech News
The crypto market is stabilizing as Bitcoin (BTC) recovers above $85K, with Ethereum and XRP prices maintaining above $1,500 and $2 respectively. This comes after China announced new tariffs on U.S. imports in response to President Donald Trump’s 145% tariff on Chinese products. Additionally, this week’s CPI and PPI data came below expectation, boosting the …
The leading altcoin, Ethereum, experienced a challenging month in March, marked by a series of bearish trends that reflected a broader market slowdown.
However, as the market begins to show signs of recovery, the key question for April remains: Can Ethereum regain its bullish momentum?
Ethereum’s March Woes: Price Crash, Activity Slump, and Growing Supply Pressure
On March 11, Ethereum plummeted to a two-year low of $1,759. This prompted traders to “buy the dip,” triggering a rally to $2,104 by March 24.
However, market participants resumed profit-taking, causing the coin’s price to fall sharply for the rest of the month. On March 31, ETH closed below the critical $2,000 price level at $1,822.
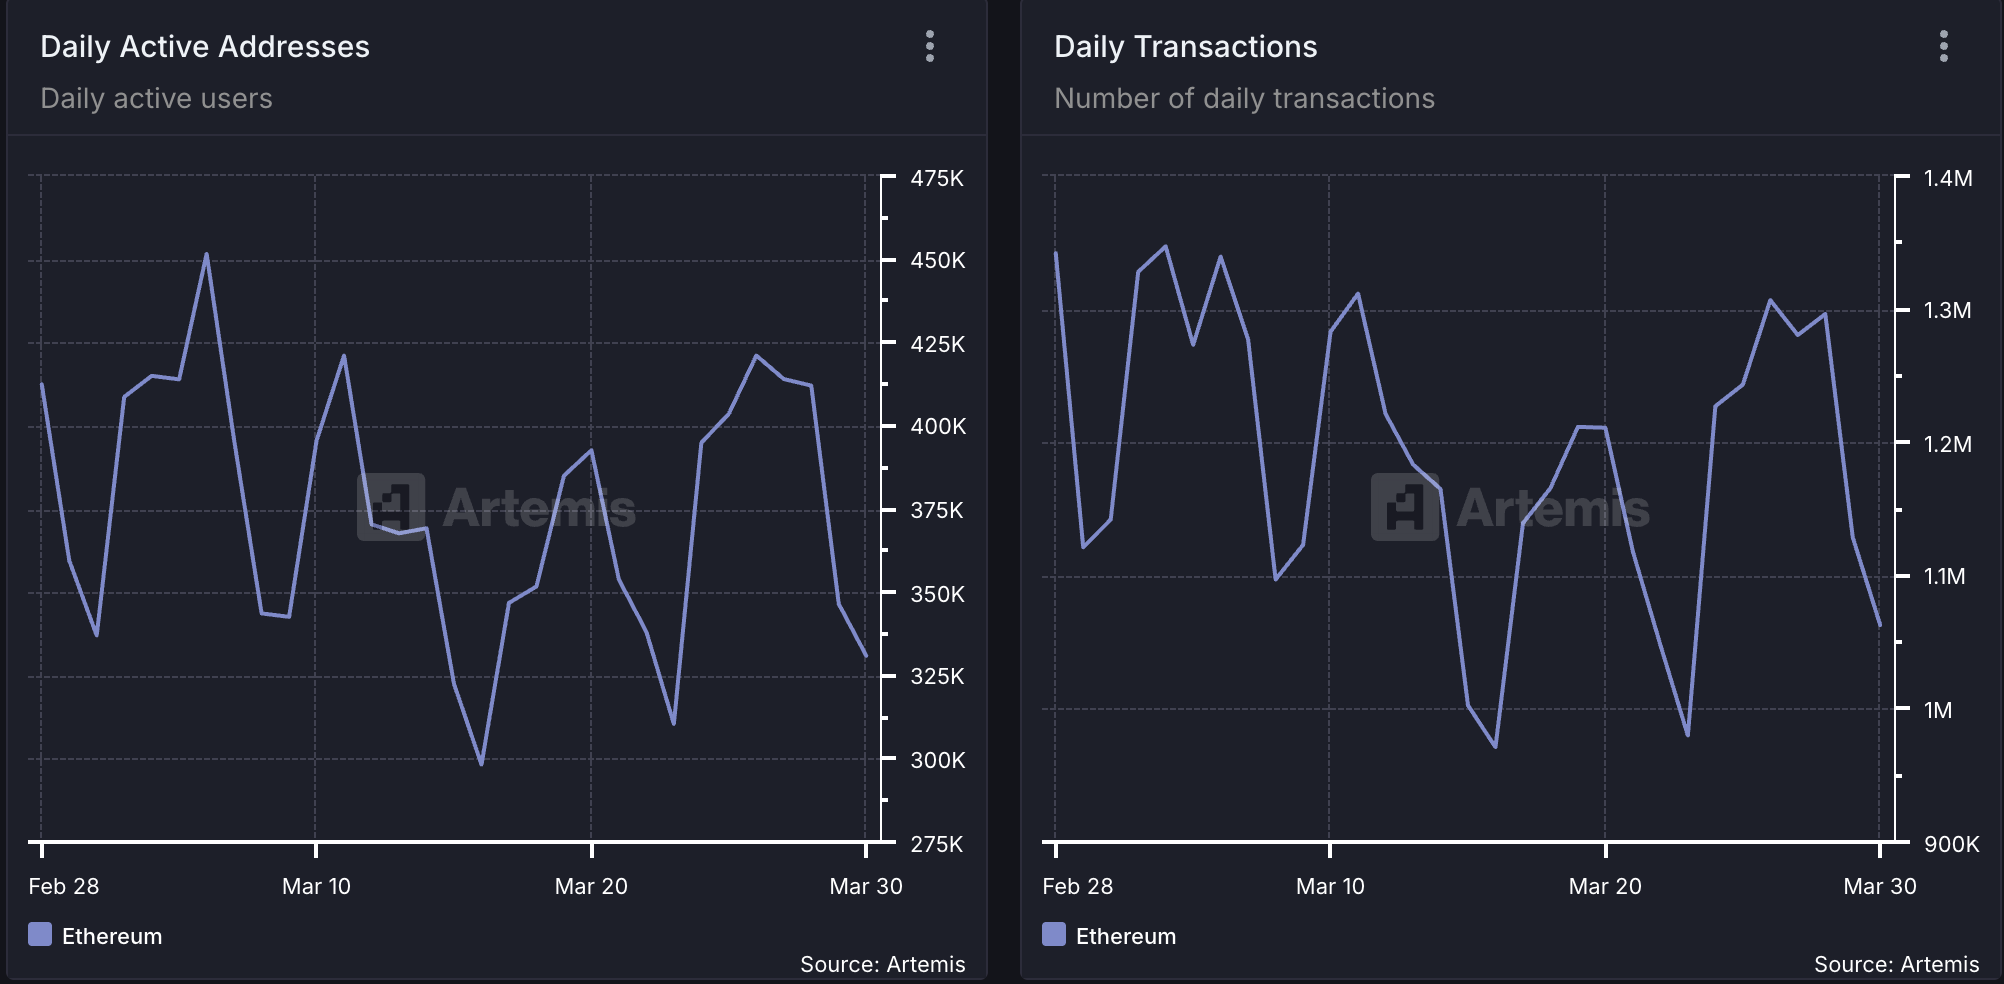
Amid ETH’s price troubles, the Ethereum network also experienced a severe decline in activity in March. Per Artemis, the daily count of active addresses that completed at least one ETH transaction fell by 20% in March.
As a result, the network’s monthly transaction count also plummeted. Totaling 1.06 million during the 31-day period in review, the number of transactions completed on Ethereum fell by 21% in March.
Generally, as more users transact and engage with Ethereum, the burn rate (a measure of ETH tokens permanently removed from circulation) increases, contributing to Ether’s deflationary supply dynamic. However, when user activity drops, ETH’s burn rate reduces, leaving many coins in circulation and adding to its circulating supply.
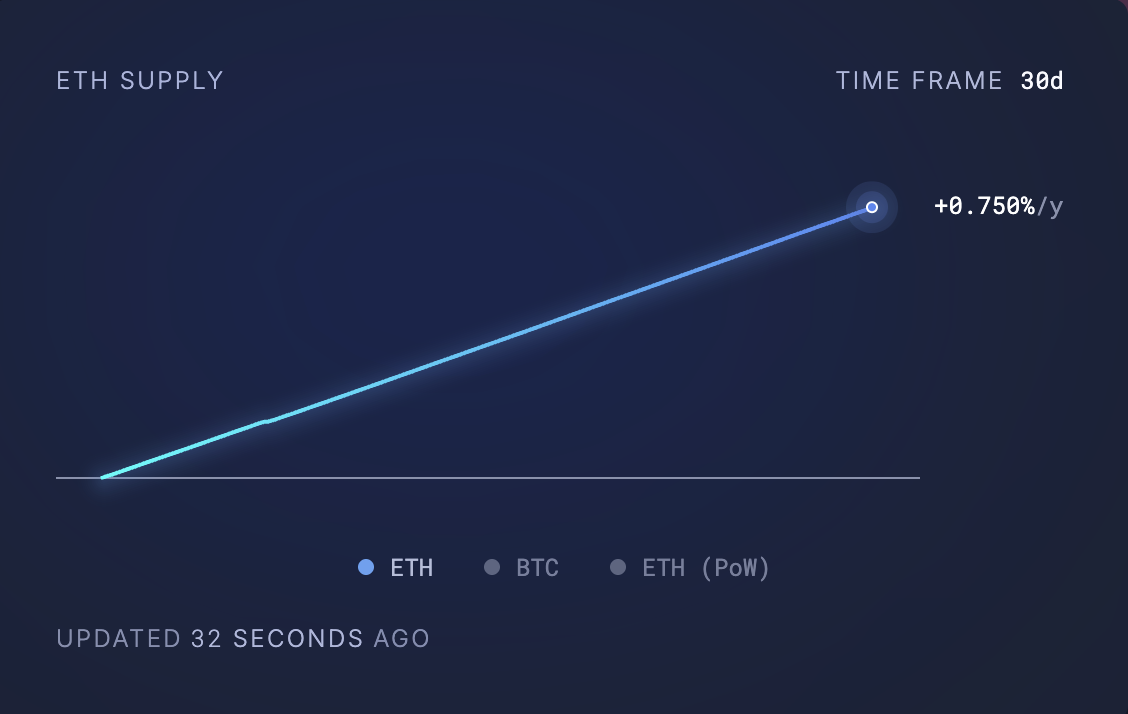
This was the case for ETH in March when it saw a spike in its circulating supply. According to data from Ultrasound Money, 74,322.37 coins have been added to ETH’s circulating supply in the past 30 days.
Usually, when an asset’s supply spikes like this without a corresponding demand to absorb it, it increases the downward pressure on its price. This puts ETH at risk of extending its decline in April.
What’s Next for Ethereum? Expert Says Inflation May Not Be a Major Concern
In an exclusive interview with BeInCrypto, Gabriel Halm, a Research Analyst at IntoTheBlock, noted that ETH’s current inflationary trends “may not be a major red flag” to watch out for in April.
Halm said:
“Even though Ethereum’s supply has recently stopped being deflationary, its annualized inflation rate is still only 0.73% over the last month, which is still dramatically lower than pre-Merge levels and lower than that of Bitcoin. For investors, this moderate level of inflation may not be a major red flag, provided that network usage, developer activity, and institutional adoption remain robust.”
Moreover, regarding whether Ethereum’s declining network activity has played a significant role in its recent price struggles, Halm suggested that its impact may be overstated.
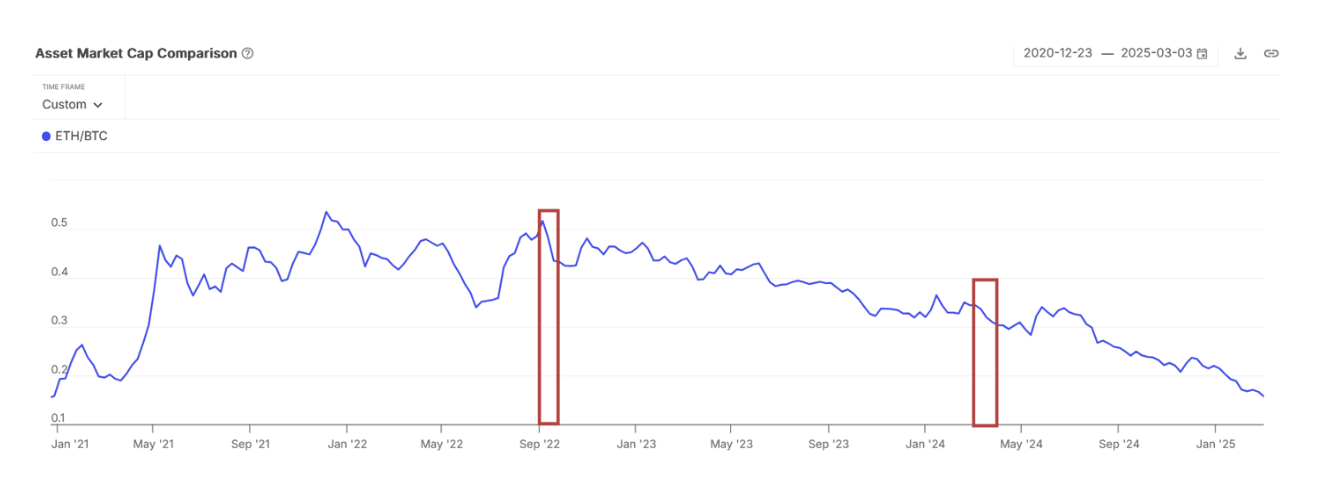
“Historically, from September 2022 to early 2024, Ethereum’s supply remained deflationary, yet the ETH/BTC pair still trended lower. This suggests that macroeconomic and broader market forces can play a far more significant role than token supply changes alone.”
ETH/BTC Market Cap Comparison. Source: IntoTheBlock
On what ETH holders should anticipate this month, Halm said:
“Ultimately, whether Ethereum dips or rallies in April will likely depend more on market sentiment and macro trends than on its short-term supply dynamics. Still, it’s essential to keep an eye on network developments that could spur renewed activity and reinforce ETH’s leading position in the broader crypto landscape.”