In the wave of memes, MemeBox is accelerating the expansion of its multi-chain ecosystem. Recently, Gate.io MemeBox announced its official integration with the Solana ecosystem, marking a new stage in its multi-chain strategy that will introduce more high-quality assets to the platform and strengthen its influence in meme-asset trading.
To date, MemeBox has built a robust trading foundation on major public chains such as Ethereum, BNB Chain, and Base, occupying the core positions for trading popular assets Gate.io. This expansion to the Solana ecosystem is a crucial step toward creating a global hub for on-chain trending-asset trading, further enhancing the strategic layout of its cross-chain trading network.
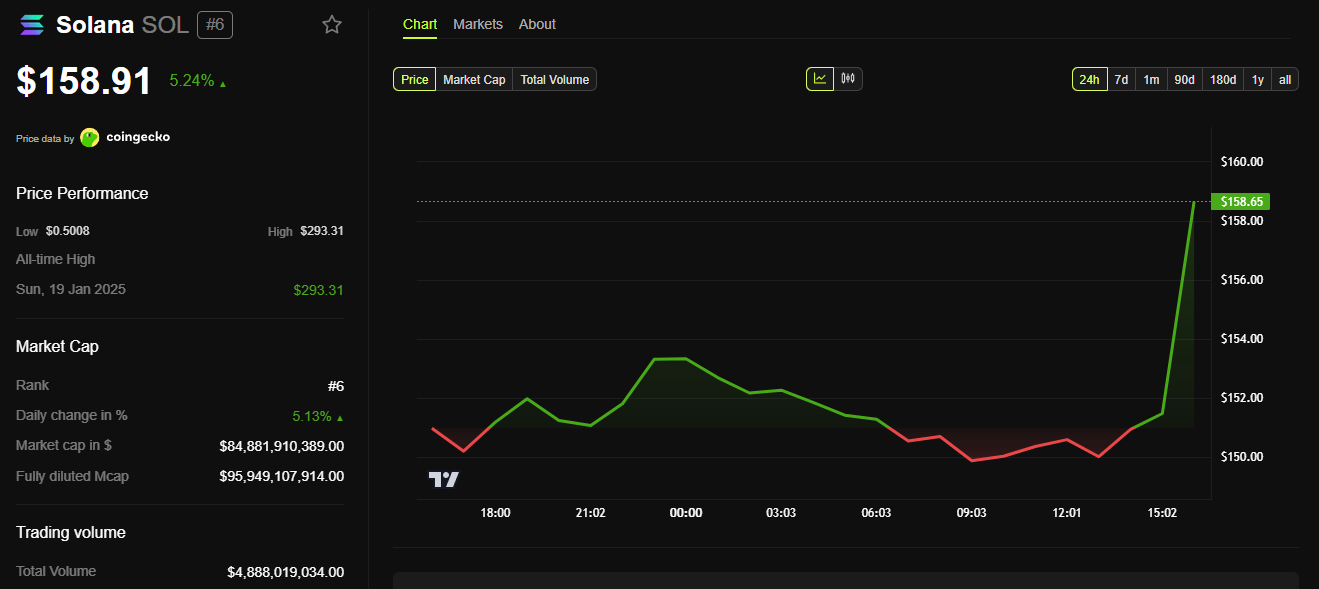
Solana: The Golden Magnet for Meme Projects, Opportunities Abound
As a flagship of third-generation high-performance public blockchains, Solana is rapidly evolving into the golden magnet for meme projects, drawing worldwide attention. Its proprietary Proof of History (PoH) consensus mechanism shatters the performance constraints of traditional chains, enabling up to 65,000 transactions per second, far surpassing other major public chains. At the same time, transaction fees drop to mere cents, creating an ideal environment for low-barrier meme adoption and ultra-high-frequency trading.
On this fertile technical foundation, meme projects have sprung up across the Solana ecosystem, each boasting unique features and vibrant energy. For example, BONK, championing itself as “the people’s coin,” airdropped 50% of its total supply free of charge to Solana community members, including artists, developers, and NFT collectors, quickly galvanizing a powerful on-chain community consensus and setting the benchmark for community-driven meme tokens.
Meanwhile, WIF, with its whimsical “dog wif a hat” mascot and an ultra-minimalist marketing approach, went viral across social platforms, even displayed on the iconic Sphere in Las Vegas, capturing global attention.
BOME has innovatively introduced a truly fair-launch mechanism, no presale, no premine and no team allocation, so that everyone starts on exactly the same footing. Users simply donate SOL to receive tokens, and every penny donated goes straight into the liquidity pool. This approach struck a powerful chord, sending BOME’s market capitalization soaring past the $1 billion mark in record time and creating one of crypto’s most remarkable growth stories.
The meteoric rise of these phenomenon-level meme projects owes everything to Solana’s high-throughput, low-cost environment. Yet for investors, the real challenge is spotting a project’s potential and value signals right at the moment it first appears.
By deploying into the Solana ecosystem, MemeBox aims to build a bridge to the hottest Solana assets for investors. It not only gives users rapid on-chain access to top-tier meme projects but also throws open the gateway to discovering high-potential assets and capturing emerging value.
MemeBox × Solana: In-Depth Strategic Layout Analysis
MemeBox’s integration of Solana is not merely a technical consolidation but a carefully weighed strategic deployment. As a leading on-chain hub for trending-asset trading, MemeBox has always been committed to broadening and diversifying users’ asset choices. Solana, with its unparalleled performance advantages and ever-accelerating project incubation, is now a pivotal pillar in MemeBox’s multi-chain strategy.
By onboarding the Solana ecosystem, MemeBox takes another significant step along its multi-chain rollout path: it not only breaks down ecological barriers between core networks, but also rapidly incorporates Solana’s high-quality assets into its trading infrastructure. This move is designed to sharpen the platform’s responsiveness to emerging market opportunities, and it underscores MemeBox’s unwavering resolve to meet users’ varied investment needs.
Leveraging its platform resources and deep liquidity, MemeBox will offer Solana-based meme projects greater market visibility and trading support, helping them achieve rapid growth across a broader market landscape.
Solana Ecosystem’s Hottest Assets Landing Soon on MemeBox
MemeBox is primed and ready to officially support the Solana chain. The first wave of listings will feature Solana ecosystem’s most sought-after assets, each backed by vibrant communities and strong growth potential. Their arrival will give MemeBox users even more diversified investment opportunities and an entirely new on-chain asset experience.
To celebrate the integration of the Solana network, Gate.io will launch a limited-time SOL airdrop event from April 30 at 2:00 to May 6 at 2:00 (UTC). During the event, users who complete their first trade on MemeBox will receive a random reward of 0.01 to 0.5 SOL from a total prize pool of 150 SOL. Pilot users trading SIGN on MemeBox for the first time will receive an additional 0.02 SOL bonus. The event will also feature lucky draws and exclusive benefits available through social media channels.
This is just the beginning of MemeBox’s expansion into Solana. Going forward, MemeBox will continuously track on-chain developments to surface the brightest up-and-coming projects. With its sharp market instincts and a lightning-fast listing process, MemeBox will be the first to deliver Solana’s hottest assets to users around the globe, ensuring investors always stay at the forefront of the next big opportunity.
MemeBox: Ushering in a New Era of On-Chain Trending Asset Trading
MemeBox is redefining the landscape of on-chain trending asset trading through its unique product advantages. By integrating AI technology, the platform is capable of scanning blockchain networks and on-chain activities in real time to accurately identify market trends and automatically list new projects at high speed. This rapid-response mechanism enables users to invest in meme tokens at the earliest stage of their breakout, securing a first-mover advantage.
In terms of multi-chain integration, MemeBox has built a diversified trading ecosystem spanning multiple major public chains. By incorporating core blockchain networks, including Solana, the platform delivers a seamless, one-stop experience for trading trending on-chain assets. Users can trade across chains without the need to constantly switch wallets or perform complex cross-chain operations, significantly improving both usability and trading efficiency.
When it comes to project vetting, MemeBox adheres to a user-centric approach, establishing a comprehensive, multi-dimensional screening framework. From smart contract security audits and token holder analysis to identifying potential “rat trading” addresses, the platform conducts comprehensive due diligence to detect problematic tokens and aims to provide a secure and trustworthy trading environment for its users.
In terms of user experience, MemeBox embraces an ultra-simple product philosophy. Users don’t need to master complex Web3 concepts or manage cumbersome wallets or private keys. They can trade on-chain, high-profile meme assets with a single click using USDT already sitting in their Gate.io account. This zero-threshold design means even blockchain newcomers can effortlessly seize investment opportunities in the meme market.
At present, the meme-token market is undergoing explosive growth, and the Solana ecosystem, one of the most dynamic incubators in that space, harbors enormous upside potential. By strategically entering Solana, MemeBox not only opens a direct gateway to the core of the meme economy but also empowers users to capture first-mover advantages and fully participate in, and share, the rapid-growth dividends of the meme market.
Competing in the Multi-Chain Era, MemeBox Leads a New Wave of Investment
The integration of the Solana ecosystem marks a pivotal advancement in MemeBox’s multi-chain strategy. This move not only expands the platform’s ecosystem boundaries by onboarding more high-quality on-chain assets, but more importantly, opens the gateway for users to tap into emerging investment opportunities, broadening both the scope and vision of their asset allocation strategies.
Looking ahead, MemeBox will remain committed to its core development philosophy of “innovation-driven, professionalism-rooted, and user-first.” The platform will continue to explore the vast possibilities within the blockchain world, identifying high-potential projects and promising ecosystems. At the same time, it will refine its offerings across product performance, user experience, and trading efficiency, striving to become the premier launchpad and value hub for trending on-chain assets worldwide.
Disclaimer: This content does not constitute an offer, solicitation, or recommendation. You should always seek independent professional advice before making investment decisions. Gate.io may restrict or prohibit certain services in specific jurisdictions. For more details, please read the User Agreement: https://www.gate.io/zh/user-agreement.
The post Gate.io MemeBox Now Integrated into the Solana Ecosystem for Faster On-Chain Asset Trading appeared first on BeInCrypto.


 SOL + Staking ETF, designed to track the performance of Solana while generating yield through on-chain staking.
 SOL exposure