Bitcoin open interest has seen a substantial increase following the Federal Reserve’s May 7 FOMC meeting when BTC briefly touched $96,000. According to the data, aggregated open interest jumped as Bitcoin’s price climbed toward the $100,000 level.
Bitcoin open interest adds $2B
Bitcoin open interest has jumped by $2 billion in a single day following BTC’s movement around the $96,000 level during the May 7 FOMC meeting. According to the chart data, aggregated open interest rose from approximately $17.5 billion to $19.15 billion. This is an 11.63% increase in just 24 hours.
The timing of this open interest surge coincides directly with Bitcoin’s price action on May 7-8. This was when the cryptocurrency began a strong upward move from the $95,000 range toward $100,000. The chart clearly shows that open interest began climbing on May 7, with the steepest increase occurring over a 16-hour period.
This $2 billion influx of new positions is nothing but fresh capital entering the Bitcoin futures market. This may mean that the traders are more confident these days following a decision by the Federal Reserve to keep interest rates constant. The volume indicator of the price chart shows that higher trading occurred in this time period. This further confirms that more individuals are getting into the market.
Bitcoin open interest is the aggregate value of open futures contracts. Abrupt spikes usually indicate shifts in market sentiment and potential price movements. The current value of $19.15 billion in BTC open interest indicates that traders are placing massive bets on price action in the near future.
Bitcoin wallets return to a state of profit
The recent Bitcoin price rally has improved the profitability profile of market participants according to Glassnode data. When BTC dipped to the local low of $74,000, more than 5 million Bitcoin were held in underwater positions. However, the subsequent recovery has reduced this number to approximately 1.9 million BTC. This shows that over 3 million Bitcoin have returned to a profitable state.
As the market approached the current local low of $74k, more than 5M BTC were held in an underwater position. However, as the market recovery has taken place, this number has fallen to around 1.9M BTC, indicating that over 3M BTC have returned to a state of profit. pic.twitter.com/J7cmxlRyMH
This transition from loss to profit for many holders generally strengthens market sentiment, as investors experience financial relief. This comes amidst the surge in Bitcoin open interest. The data shows that a considerable number of short-term holder coins have returned to profitability as Bitcoin pushed above $95,000. This change is likely to drive profit-taking events as the market continues to show strength, as per Glassnode.
With Bitcoin’s price reaching as high as $99,800, the market has attracted fresh capital inflows. The realized cap, which measures the value of all Bitcoin at the price at which they last moved, has climbed to an all-time high of $889 billion. This metric confirms that new money is entering the Bitcoin ecosystem and supports the current price levels.
Pi Network (PI) is under heavy pressure, down more than 9% in the last 24 hours and 29% over the past week. Its market cap has dropped to $5.5 billion, a sharp fall from its $19 billion peak at the end of February.
Technical indicators show sellers are in full control, with no strong signs of momentum returning yet. As PI tests key support levels, the coming days could be critical in determining whether it stabilizes—or continues its slide.
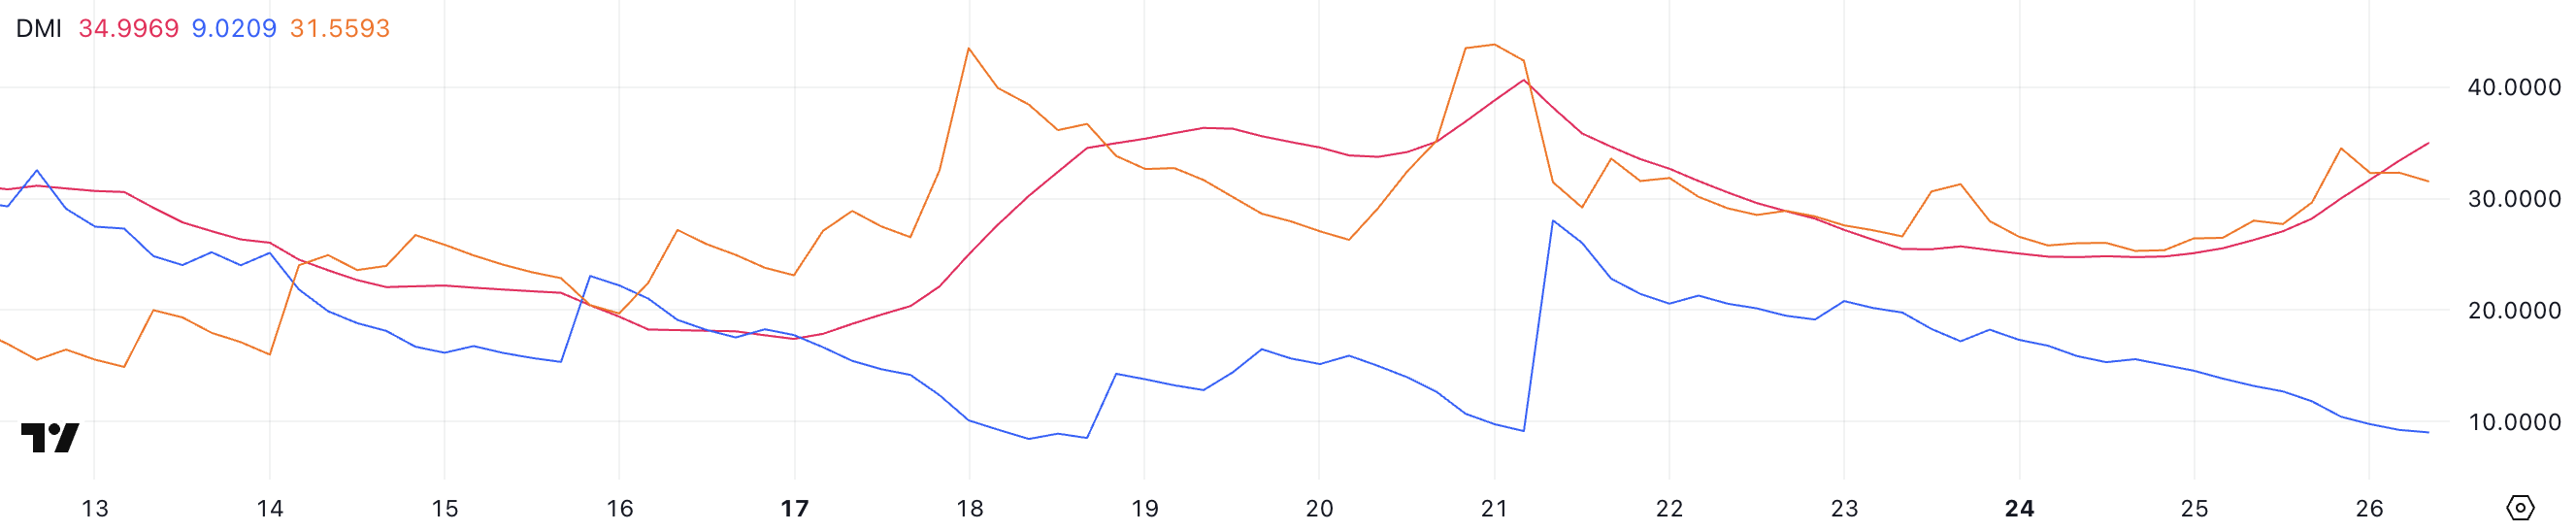
Pi Network DMI Shows Sellers Are In Full Control
Pi Network’s DMI chart shows that its ADX has climbed to 34.99 from 25.1 just a day ago, signaling a strong increase in trend strength. The ADX, or Average Directional Index, measures the intensity of a trend without indicating its direction.
Values above 25 suggest a strong trend is forming, and readings over 30 confirm it. With ADX now nearing 35, Pi Network is firmly in trending territory—but it’s important to identify the direction of that trend.
Currently, the -DI (Directional Indicator for bearish pressure) has risen to 31.55 from 25.31, while the +DI (bullish pressure) has dropped to 9 from 15.59. This widening gap between the two confirms that the downtrend is strengthening, as an analyst recently reviewed why PI wasn’t listed on Binance and Coinbase.
Despite the sharp rise in trend strength shown by the ADX, the declining +DI and rising -DI indicate sellers remain in full control. Unless the trend reverses soon, Pi Network could continue to face further downside pressure in the short term.
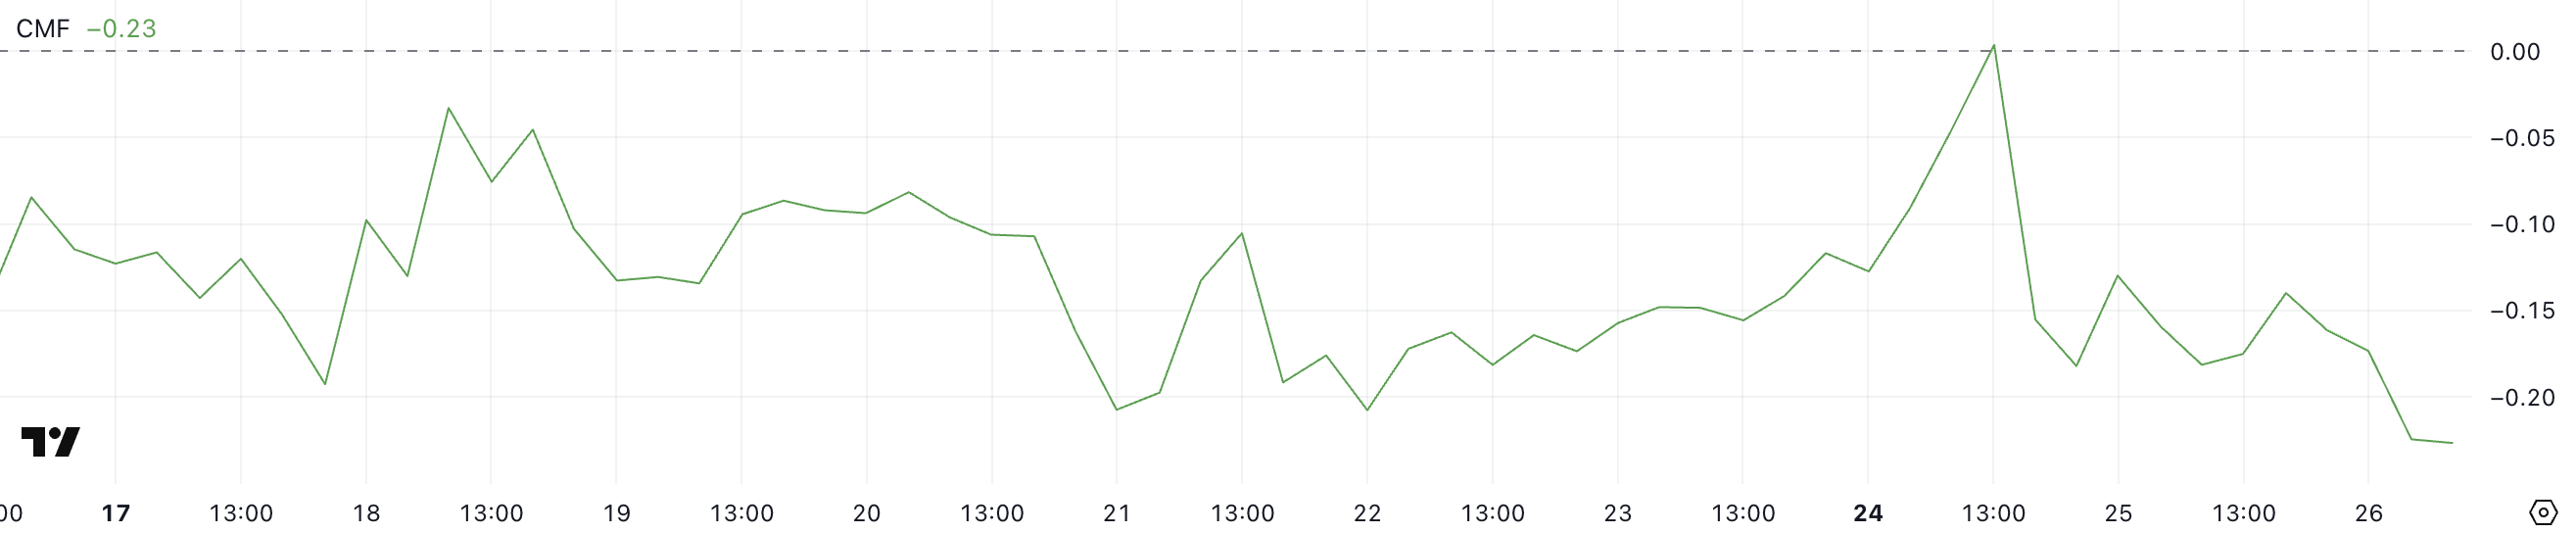
PI Lacks a Strong Momentum
Pi Network’s Chaikin Money Flow (CMF) is currently at -0.23, a notable drop from 0 just two days ago. The CMF is a volume-weighted indicator that measures buying and selling pressure over a set period, typically 20 or 21 days.
Values above 0 suggest accumulation (buying pressure), while values below 0 indicate distribution (selling pressure). The further from zero, the stronger the pressure in that direction.
With a reading of -0.23, Pi Network’s CMF is at its lowest level ever, showing heavy and persistent outflows. Notably, the indicator hasn’t turned positive since March 15—nearly 15 days ago—highlighting sustained selling activity.
This deep negative value signals a strong bearish bias, suggesting that capital is consistently leaving the market. Unless CMF begins to recover, the ongoing distribution phase could continue to weigh on Pi Network’s price.
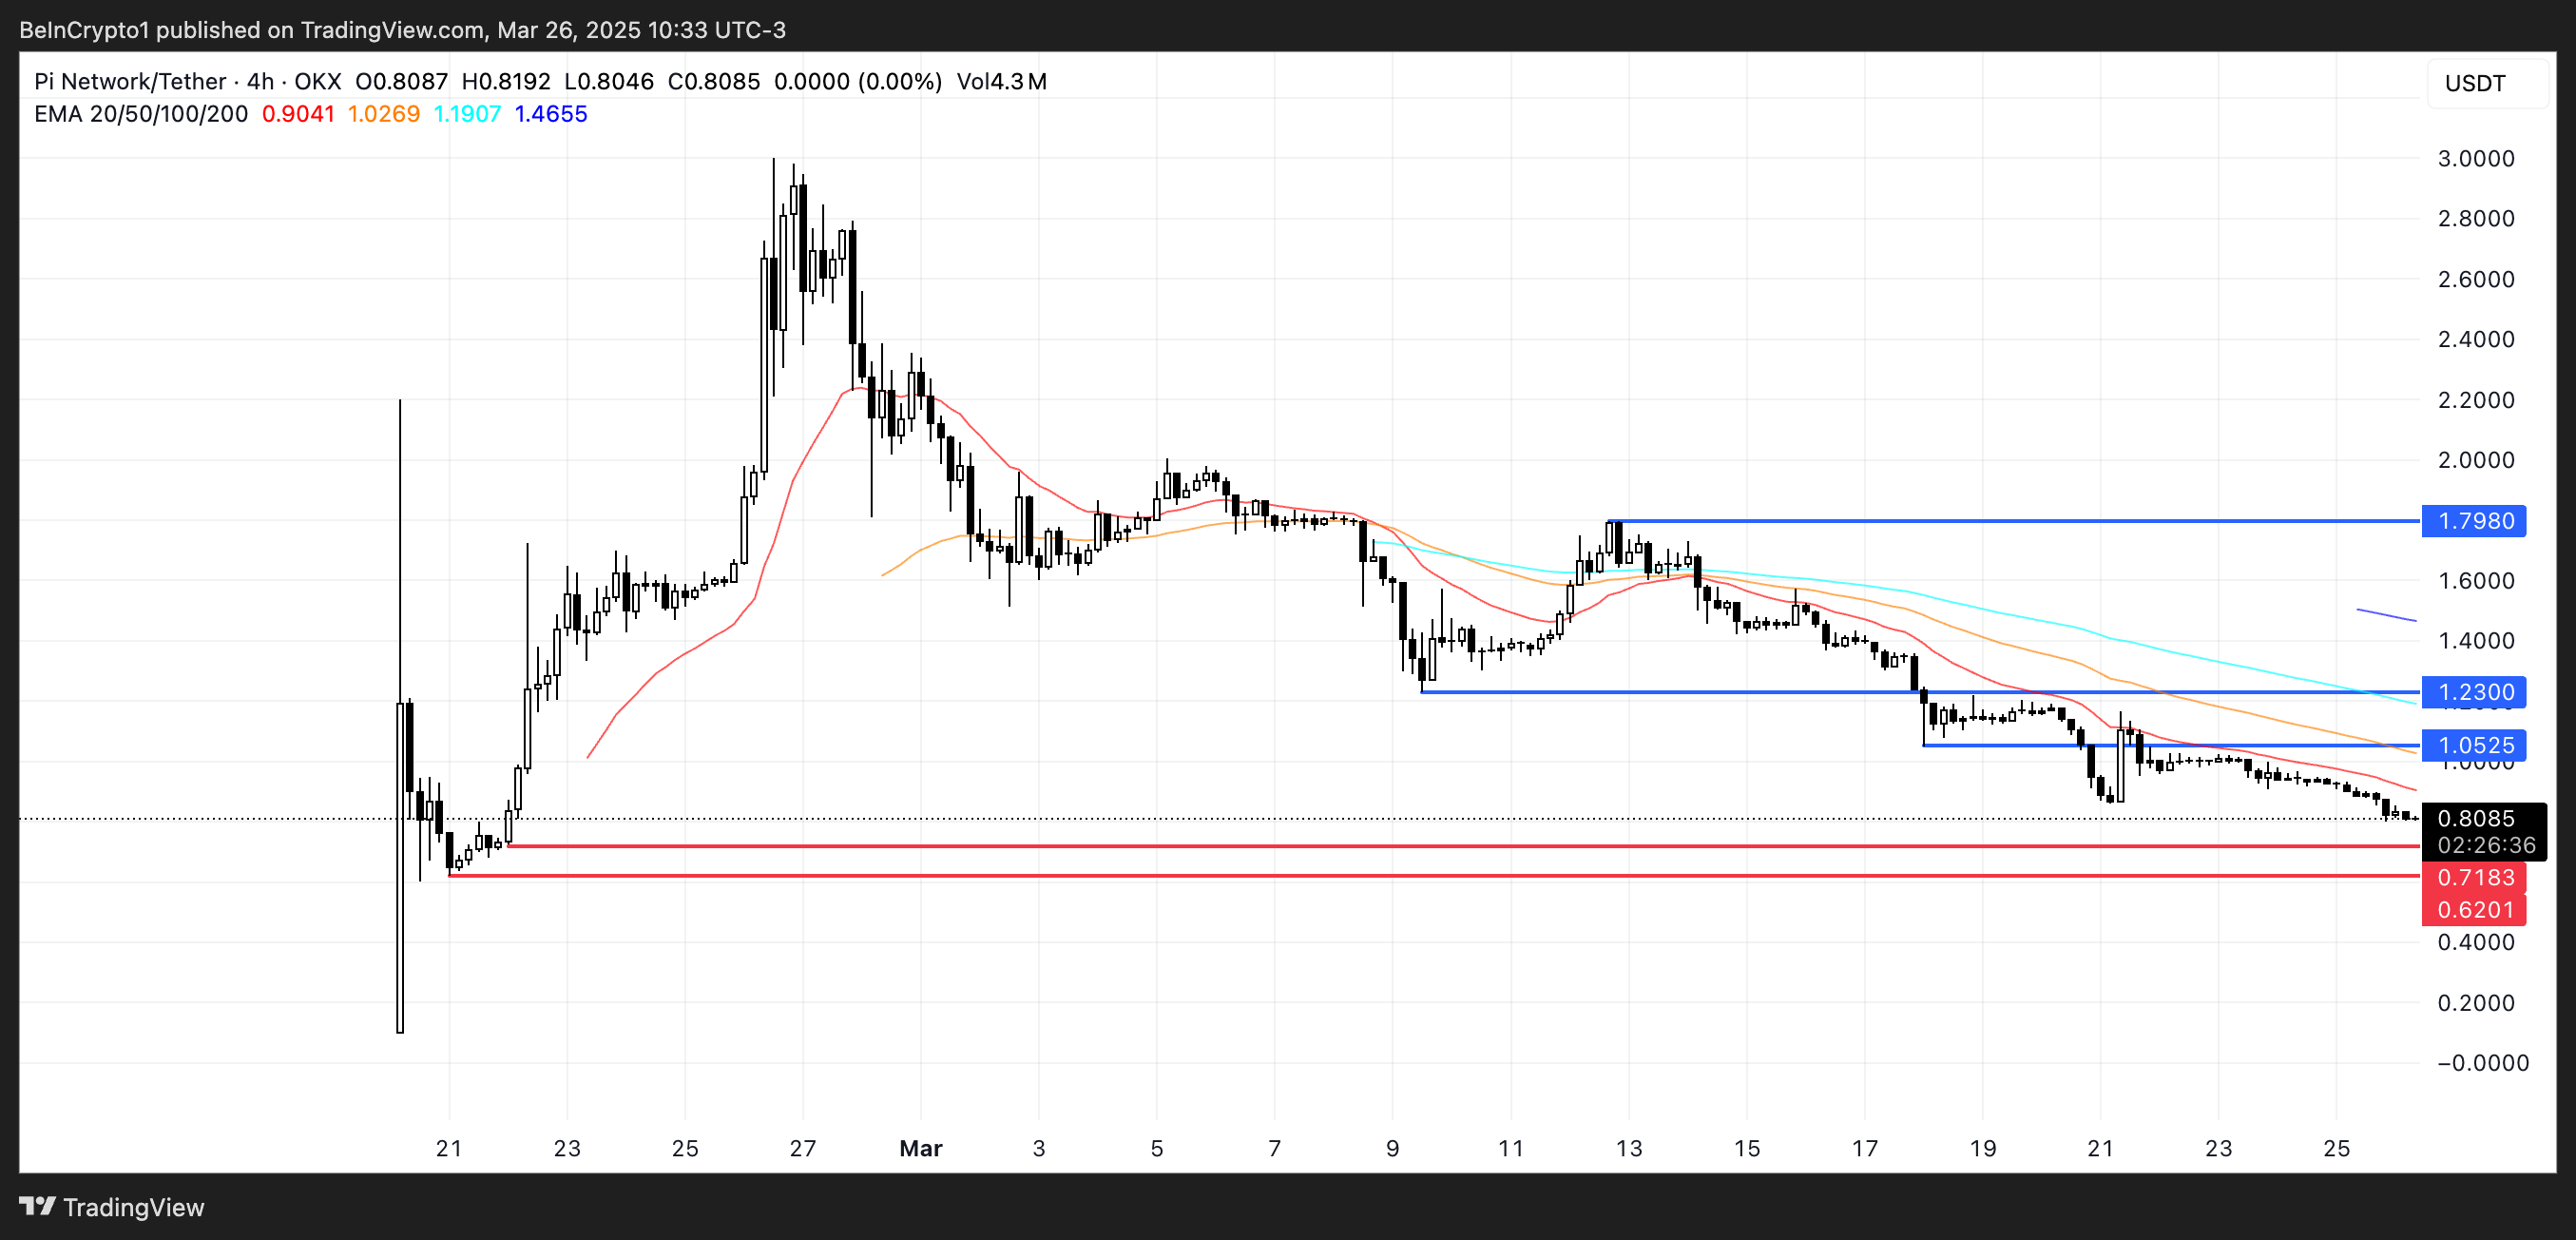
Can Pi Network Drop Below $0.70 Soon?
Pi Network price chart shows a critical support level at $0.718, which has held the price up in recent sessions.
If this level is lost, it could trigger a sharper drop toward $0.62, marking the lowest price since February 21.
On the flip side, if Pi Network manages to reverse its trend and regain momentum, the first key resistance to watch is at $1.05. A breakout above that could open the path toward $1.23, and if bullish sentiment returns, the price could climb as high as $1.79.
That would represent a potential 54% upside from current levels, but it would require a strong shift in momentum and renewed market hype.
The collapse of the MANTRA (OM) token has left investors reeling, with many facing significant losses. As analysts comb through the causes of the collapse, many questions remain.
BeInCrypto consulted industry experts to identify five critical red flags behind MANTRA’s downfall and reveal strategies investors can adopt to steer clear of similar pitfalls in the future.
MANTRA (OM) Crash: What Investors Missed and How to Avoid Future Losses
On April 13, BeInCrypto broke the news of OM’s 90% crash. The collapse raised several concerns, with investors accusing the team of orchestrating a pump-and-dump scheme. Experts believe that there were many early signs of trouble.
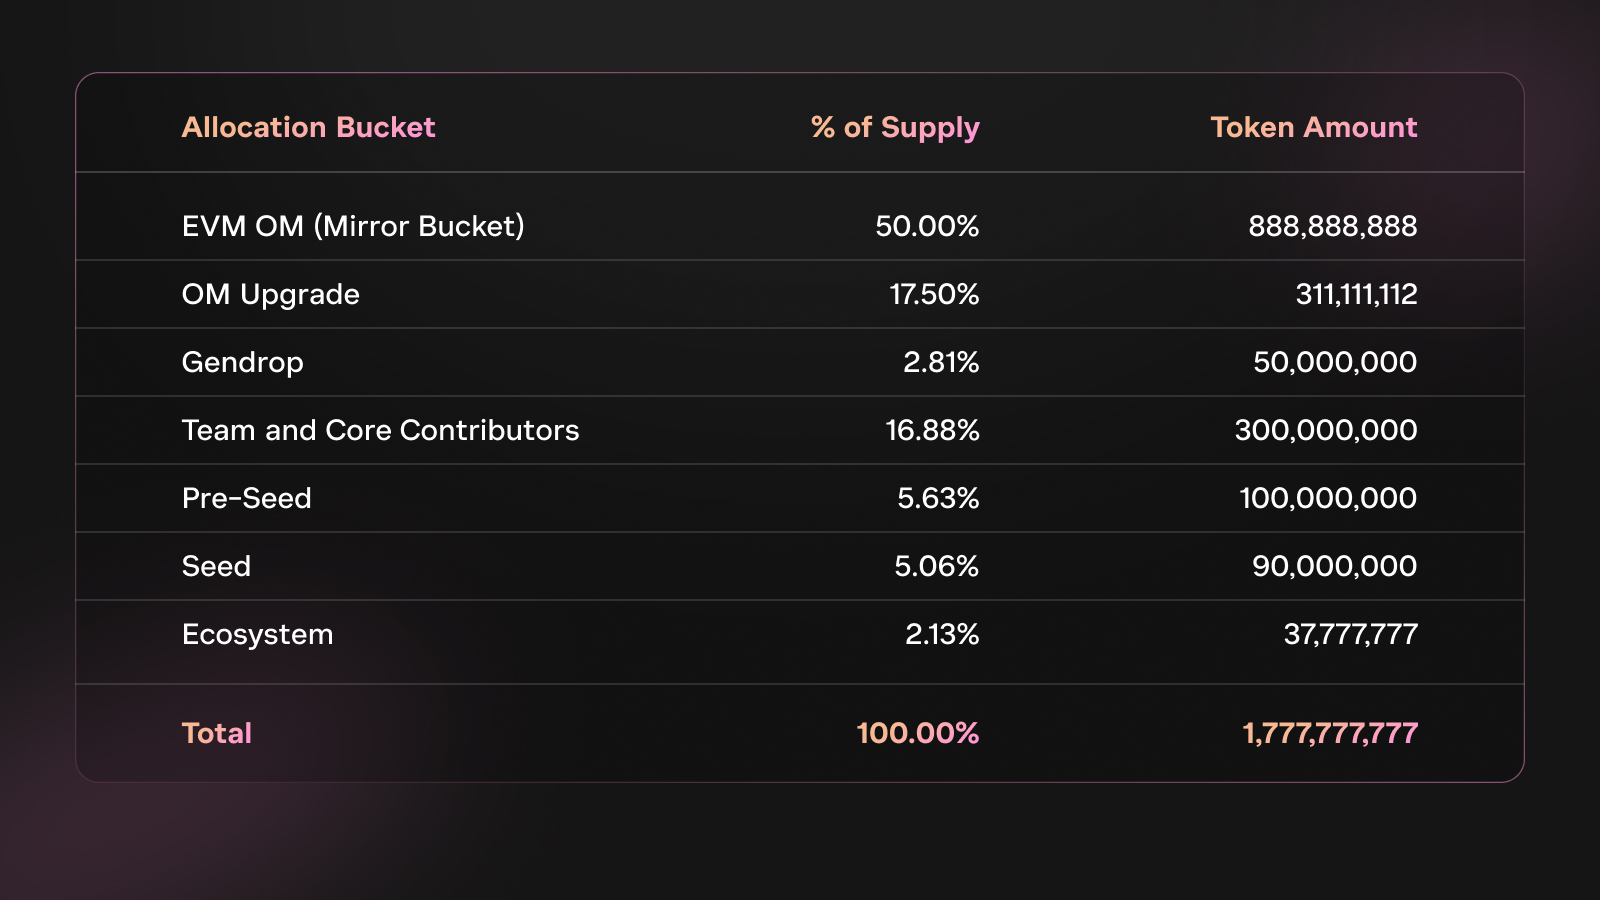
In addition, the project adopted an inflationary tokenomic model with an uncapped supply, replacing the previous hard cap. As part of this transition, the total token supply was also increased to 1.7 billion.
However, the move wasn’t without drawbacks. According to Jean Rausis, co-founder of SMARDEX, tokenomics was a point of concern in the OM collapse.
“The project doubled its token supply to 1.77 billion in 2024 and shifted to an inflationary model, which diluted its original holders. Complex vesting favored insiders, while low circulating supply and massive FDV fueled hype and price manipulation,” Jean Rausis told BeInCrypto.
Moreover, the team’s control over the OM supply also raised centralization concerns. Experts believe this was also a factor that could have led to the alleged price manipulation.
“About 90% of OM tokens were held by the team, indicating a high level of centralization that could potentially lead to manipulation. The team also maintained control over governance, which undermined the project’s decentralized nature,” said Phil Fogel, co-founder of Cork.
Phil Fogel acknowledged that a concentrated token supply isn’t always a red flag. However, it’s crucial for investors to know who holds large amounts, their lock-up terms, and whether their involvement aligns with the project’s decentralization goals.
Moreover, Ming Wu, the founder of RabbitX, also argued that analyzing this data is essential to uncover any potential risks that could undermine the project in the long term.
“Tools like bubble maps can help identify potential risks related to token distribution,” Wu advised.
2. OM Price Action
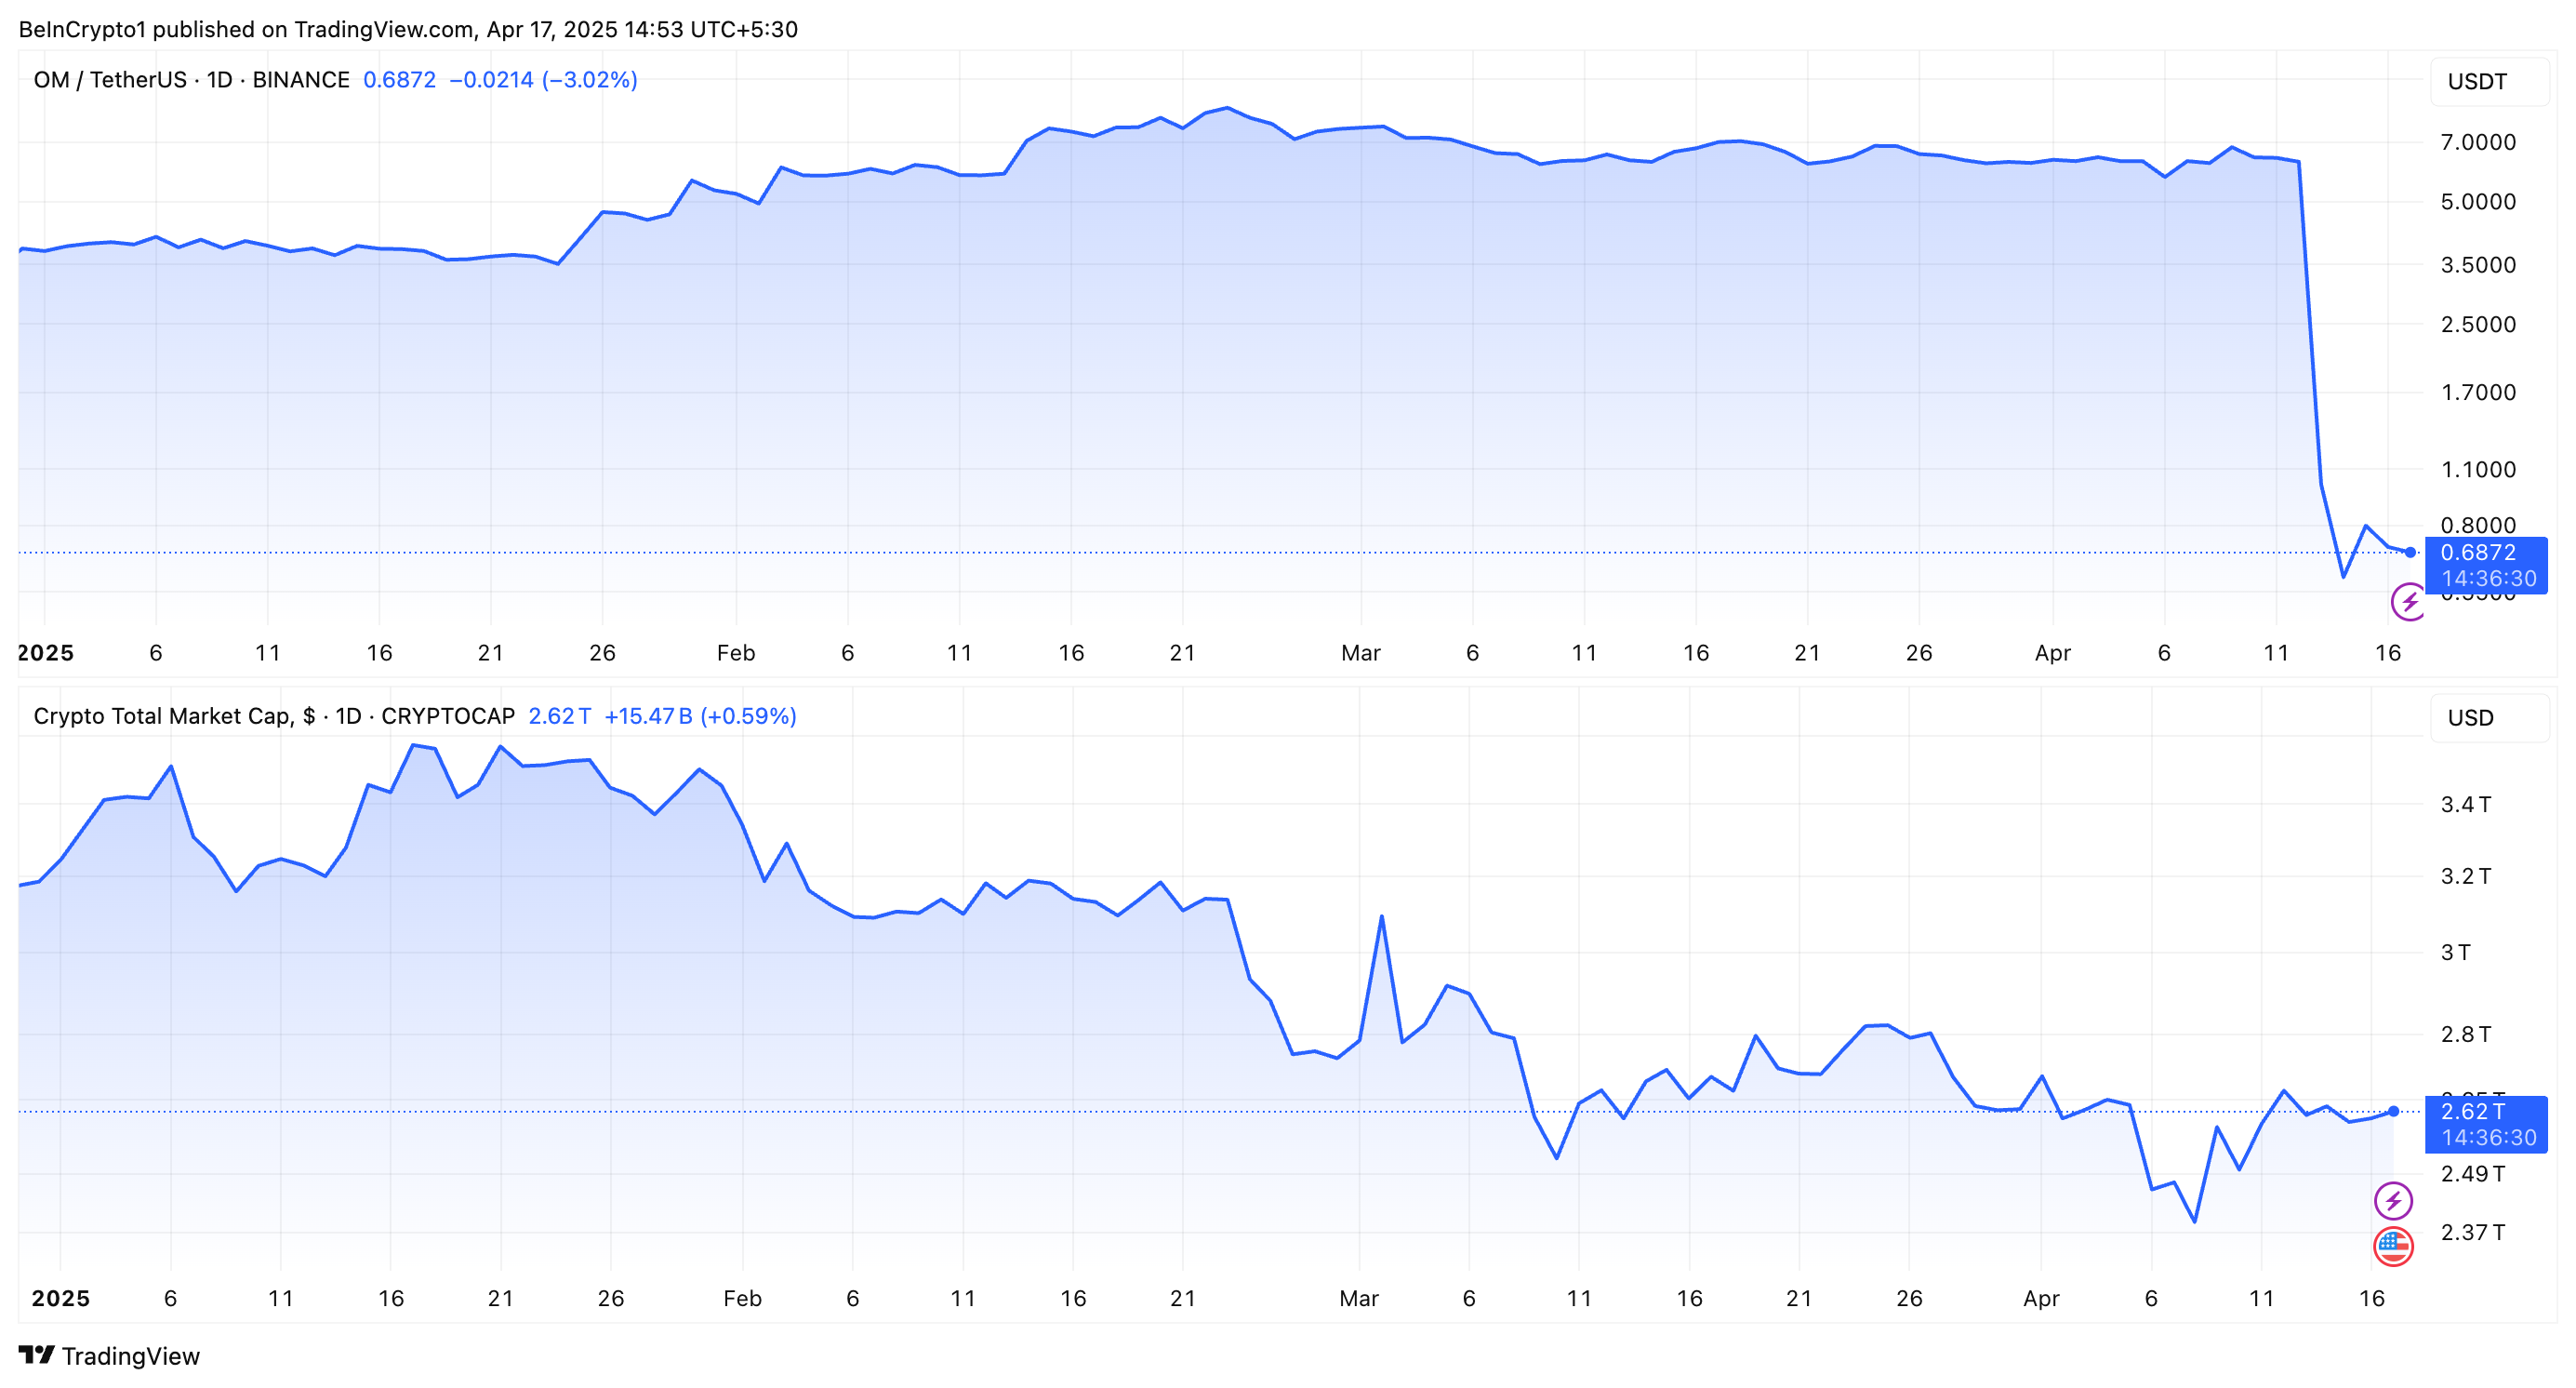
2025 has been marked as the year of significant market volatility. The broader macroeconomic pressures have weighed heavily on the market, with the majority of the coins experiencing steep losses. Yet, OM’s price action was relatively stable until the latest crash.
OM vs. TOTAL Market Performance. Source: TradingView
“The biggest red flag was simply the price action. The whole market was going down, and nobody cared about MANTRA, and yet its token price somehow kept pumping in unnatural patterns – pump, flat, pump, flat again,” Jean Rausis disclosed.
He added that this was a clear sign of a potential issue or problem with the project. Nevertheless, he noted that identifying the differentiating price action would require some technical analysis know-how. Thus, investors lacking the knowledge would have easily missed it.
Despite this, Rausis highlighted that even the untrained eye could find other signs that something was off, ultimately leading to the crash.
Strategies to Protect Yourself
While investors remained optimistic about OM’s resilience amid a market downturn, this ended up costing them millions. Eric He, LBank’s Community Angel Officer, and Risk Control Adviser emphasized the importance of proactive risk management to avoid OM-style collapses.
“First, diversification is key—spreading capital across projects limits single-token exposure. Stop-loss triggers (e.g., 10-20% below buy price) can automate damage control in volatile conditions,” Eric shared with BeInCrypto.
Ming Wu had a similar perspective, emphasizing the importance of avoiding over-allocation to a single token. The executive explained that a diversified investment strategy helps mitigate risk and enhances overall portfolio stability.
“Investors can use perpetual futures as a risk management tool to hedge against potential price declines in their holdings,” Wu remarked.
Meanwhile, Phil Fogel advised focusing on a token’s liquidity. Key factors include the float size, price sensitivity to sell orders, and who can significantly impact the market.
3. Project Fundamentals
Experts also highlighted major discrepancies in MANTRA’s TVL. Eric He pointed out a significant gap between the token’s fully diluted valuation (FDV) and the TVL. OM’s FDV reached $9.5 billion, while its TVL was only $13 million, indicating a potential overvaluation.
“A $9.5 billion valuation against $13 million TVL, screamed instability,” Forest Bai, co-founder of Foresight Ventures, stated.
Notably, several issues were also raised regarding the airdrop. Jean Rausis called the airdrop a “mess.” He cited many issues, including delays, frequent changes to eligibility rules, and the disqualification of half the participants. Meanwhile, suspected bots were not removed.
“The airdrop disproportionately favored insiders while excluding genuine supporters, reflecting a lack of fairness,” Phil Fogel reiterated.
The criticism expanded further as Fogel pointed out the team’s alleged associations with questionable entities and ties to questionable initial coin offerings (ICOs), raising doubts about the project’s credibility. Eric He also suggested that MANTRA was allegedly tied to gambling platforms in the past.
Strategies to Protect Yourself
Forest Bai underscored the importance of verifying the project team’s credentials, reviewing the project roadmap, and monitoring on-chain activity to ensure transparency. He also advised investors to assess community engagement and regulatory compliance to gauge the project’s long-term viability.
Ming Wu also stressed distinguishing between real growth and artificially inflated metrics.
“It’s important to differentiate real growth from activity that’s artificially inflated through incentives or airdrops, unsustainable tactics like ‘selling a dollar for 90 cents’ may generate short-term metrics but don’t reflect actual engagement,” Wu informed BeInCrypto.
Finally, Wu recommended researching the background of the project’s team members to uncover any history of fraudulent activity or involvement in questionable ventures. This would ensure that investors are well-informed before committing to any project.
4. Whale Movements
As BeInCrypto reported earlier, before the crash, a whale wallet reportedly associated with the MANTRA team deposited 3.9 million OM tokens into the OKX exchange. Experts highlighted that this wasn’t an isolated incident.
“Large OM transfers (43.6 million tokens, ~$227 million) to exchanges days prior were a major warning of potential sell-offs,” Forest Bai conveyed to BeInCrypto.
Ming Wu also explained that investors should pay close attention to such large transfers, which often act as warning signals. Moreover, analysts at CryptoQuant also outlined what investors should look out for.
“OM transfers into exchanges amounted to as much as $35 million in just an hour. This represented an alert sign as: Transfers into exchanges are below $8 million in a typical hour (excluding transfers into Binance, which are typically large given the size of the exchange). Transfers into exchanges represented more than a third of the total OM transferred, which indicates a high transfer volume into exchanges,” CryptoQuant informed BeInCrypto.
Strategies to Protect Yourself
CryptoQuant stated that investors need to monitor the flows of any token into exchanges, as it could indicate increasing price volatility in the near future.
Meanwhile, Risk Control Adviser Eric He outlined four strategies to stay up-to-date when it comes to large transfers.
Chain Sleuthing: Tools like Arkham and Nansen allow investors to track large transfers and monitor wallet activity.
Set Alerts: Platforms like Etherscan and Glassnode notify investors of unusual market movements.
Track Exchange Flows: Users need to track large flows into centralized exchanges.
Check Lockups: Dune Analytics helps investors determine if team tokens are being released earlier than expected.
He also recommended focusing on the market structure.
“OM’s crash proved market depth is non-negotiable: Kaiko data showed 1% order book depth collapsed 74% before the fall. Always check liquidity metrics on platforms like Kaiko; if 1% depth is below $500,000, that’s a red flag,” Eric revealed to BeInCrypto.
Additionally, Phil Fogel underlined the importance of monitoring platforms like X (formerly Twitter) for any rumors or discussions about possible dumps. He stressed the need to analyze liquidity to assess whether a token can handle sell pressure without causing a significant price drop.
Interestingly, experts were slightly divided on how CEXs contributed to OM’s crash. Forest Bai claimed that CEX liquidations during low-liquidity hours worsened the crash by triggering cascading sell-offs. Eric He corroborated this sentiment.
“CEX liquidations played a major role in the OM crash, acting as an accelerant. With thin liquidity—1% depth falling from $600,000 to $147,000—forced closures triggered cascading liquidations. Over $74.7 million was wiped in 24 hours,” he mentioned.
“Analyzing the open interest in the OM derivatives market reveals that it was less than 0.1% of OM’s market capitalization. However, what’s particularly interesting is that during the market collapse, open interest in OM derivatives actually increased by 90%,” Wu expressed to BeInCrypto.
According to the executive, this challenges the idea that liquidations or forced closures caused the price drop. Instead, it indicates that traders and investors increased their short positions as the price fell.
Strategies to Protect Yourself
While the involvement of CEXs remains debatable, the experts did address the key point of investor protection.
“Investors can limit leverage to avoid forced liquidations, choose platforms with transparent risk policies, monitor open interest for liquidation risks, and hold tokens in self-custody wallets to reduce CEX exposure,” Forest Bai recommended.
Eric He also advised that investors should mitigate risks by adjusting leverage dynamically based on volatility. If tools like ATR or Bollinger Bands signal turbulence, exposure should be reduced.
The MANTRA (OM) collapse is a powerful reminder of the importance of due diligence and risk management in cryptocurrency investments. Investors can minimize the risk of falling into similar traps by carefully assessing tokenomics, monitoring on-chain data, and diversifying investments.
With expert insights, these strategies will help guide investors toward smarter, more secure decisions in the crypto market.
Several interesting developments happened this week in crypto, cutting across diverse ecosystems. Key highlights, however, centered on Bitcoin (BTC) and XRP ecosystems.
In case you missed it, here is a roundup of the top stories this week in crypto.
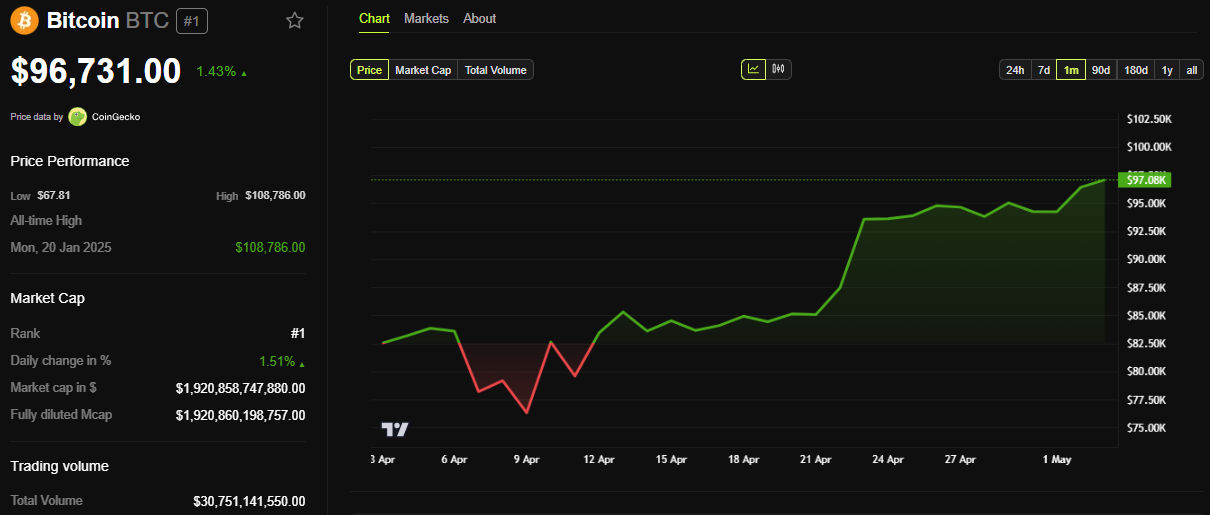
Bitcoin Tests $97,000
Starting the list of what happened this week in crypto, Bitcoin tested the $97,000 milestone for the first time since February 2025. However, as of this writing, the pioneer crypto pulled back shortly after and was trading for $96,731.
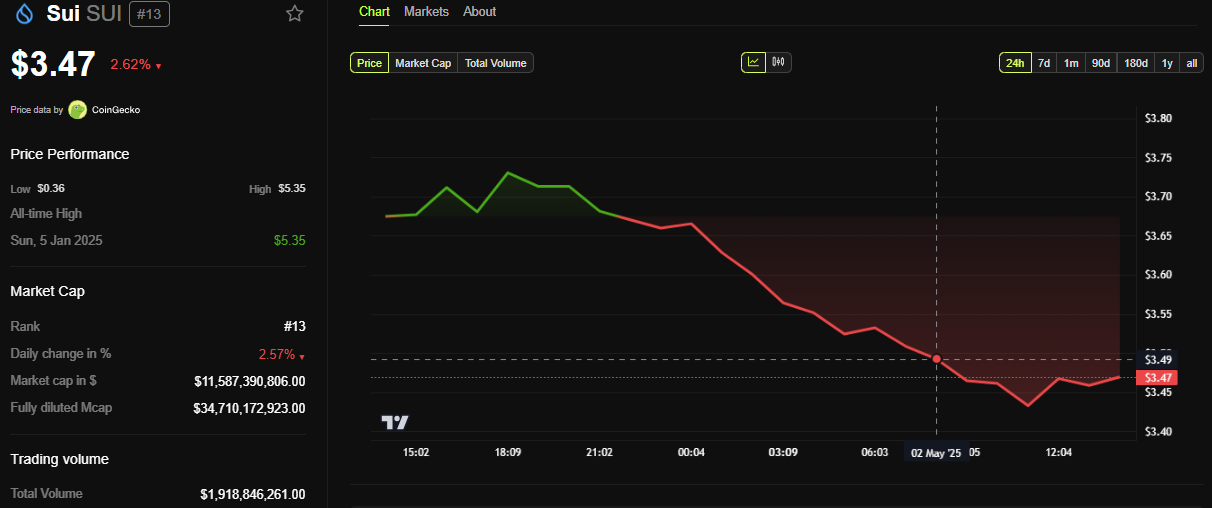
Another key highlight this week in crypto concerned speculation of a possible collaboration between the Sui blockchain and Pokémon. Amidst these talks, the SUI price soared over 60% within the week.
These rumors sparked after a privacy policy update for Pokémon HOME featured Parasol Technologies, LLC, as a new developer. Parasol Technologies is a Web3 gaming infrastructure company that Sui’s developer, Mysten Labs, acquired in March 2025.
Nevertheless, changes in one of the circulating documents quelled the speculation, clarifying what had been a key driver for the SUI price this week.
“The official Sui Foundation blog confirmed (and removed) Pokémon NFTs. They seem to be developing a cloud infrastructure that uses blockchain technology to address bugs, hacks, and duping while enabling transfers between compatible games—something that is already possible with Pokémon Home,” another user highlighted.
Nevertheless, the correction did not quell speculation that Parasol may be involved in developing new features for Pokémon.
The SUI price has fallen almost 3% in the last 24 hours. As of this writing, it was trading for $3.47.
ProShares XRP ETF Rumors
Adding to the list of speculation this week in crypto, rumors spread that the US SEC (Securities and Exchange Commission) had approved a ProShares XRP ETF (exchange-traded fund).
However, BeInCrypto shut down these claims, articulating that the approval was for ProShares’ Leveraged and Short XRP Futures ETFs. ETF analyst James Seyffart also provided further clarity, deeming the allegations false.
“UPDATE: A lot of people posting/reporting that ProShares will be launching XRP ETFs on April 30th. We have confirmed that this is not the case. We do not have a confirmed launch date yet but we believe they will launch — and likely launch in the short or possibly medium term,” Seyffart explained.
ProShares launched three futures-based ETFs: the Ultra XRP ETF, the Short XRP ETF, and the Ultra Short XRP ETF. This development followed the launch of Teucrium’s 2x Long Daily XRP ETF in early April.
ProShares’ XRP Futures ETF Sparked Optimism
Meanwhile, the approval of ProShares XRP futures ETF sparked optimism, inspiring sentiment that a spot XRP ETF would be next.
According to forecasts by industry expert Armando Pantoja, the move could lead to substantial capital inflow into the altcoin.
“A spot XRP ETF could be next, unlocking real demand and sending prices soaring. $100 billion+ could soon flood into XRP,” he wrote.
Pantoja recognized that the approval marked a significant turning point for the industry, expanding XRP’s investor base.
The approval cleared the runway for the XRP ETF, granting Ripple’s token a regulated and accessible avenue for major financial players to engage.
“Futures ETF = first domino. Spot ETF = the tipping point. XRP’s long-term setup just got way stronger,” Pantoja remarked.
Another analyst was more measured amid heightened optimism, noting that the futures ETF was not the game-changer many might expect.
“It’s not the silver bullet that will trigger mass adoption or massive price action. The real catalyst will come when a Spot XRP ETF gets approved. Real tokens. Real demand. Real market impact,” John Squire posted.
SEC Delays XRP ETF Decision
To add to the list of developments in the XRP ecosystem this week in crypto, the US SEC delayed its decision on a prospective XRP ETF until June 17.
Before this news broke, crypto market participants awaited the final decision of XRP, Dogecoin (DOGE), and Ethereum staking ETFs. However, these were all put off.
“These dates are all intermediate and we will likely see final decisions on a lot of the crypto ETPs in Q4. For the XRP spot ETF, [I am] eyeing mid-October, around the 18th, as a final decision deadline. It’s possible the SEC won’t take all that time to make its decision, but a lot will hinge on how actively they engage on the applications,” Seyffart explained.
For now, over 70 active ETF proposals await the securities regulator’s verdict. XRP ETF’s June deadline is not final, but the commission could still enact further delays until mid-October.
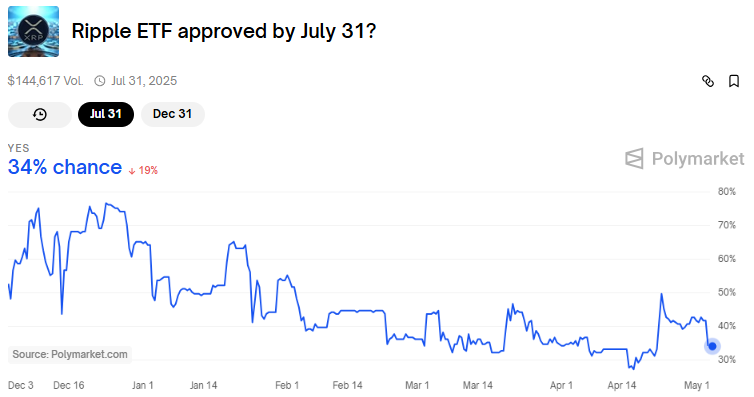
Meanwhile, data from Polymarket shows that bettors see a 34% chance that the financial instrument will be approved by July 31.