Storm Trade, the leader in decentralized derivatives on TON, is once again setting industry trends. With millions of users, an integrated academy, generous airdrops, and the fastest trading experience in a Telegram Mini App, Storm Trade has become synonymous with innovation in decentralized finance.
The protocol combines a professional-grade mobile interface with the full functionality of a web version, providing a seamless experience even for seasoned traders. Here, users can trade not only cryptocurrencies but also forex, commodities, and stocks — all without leaving Telegram.
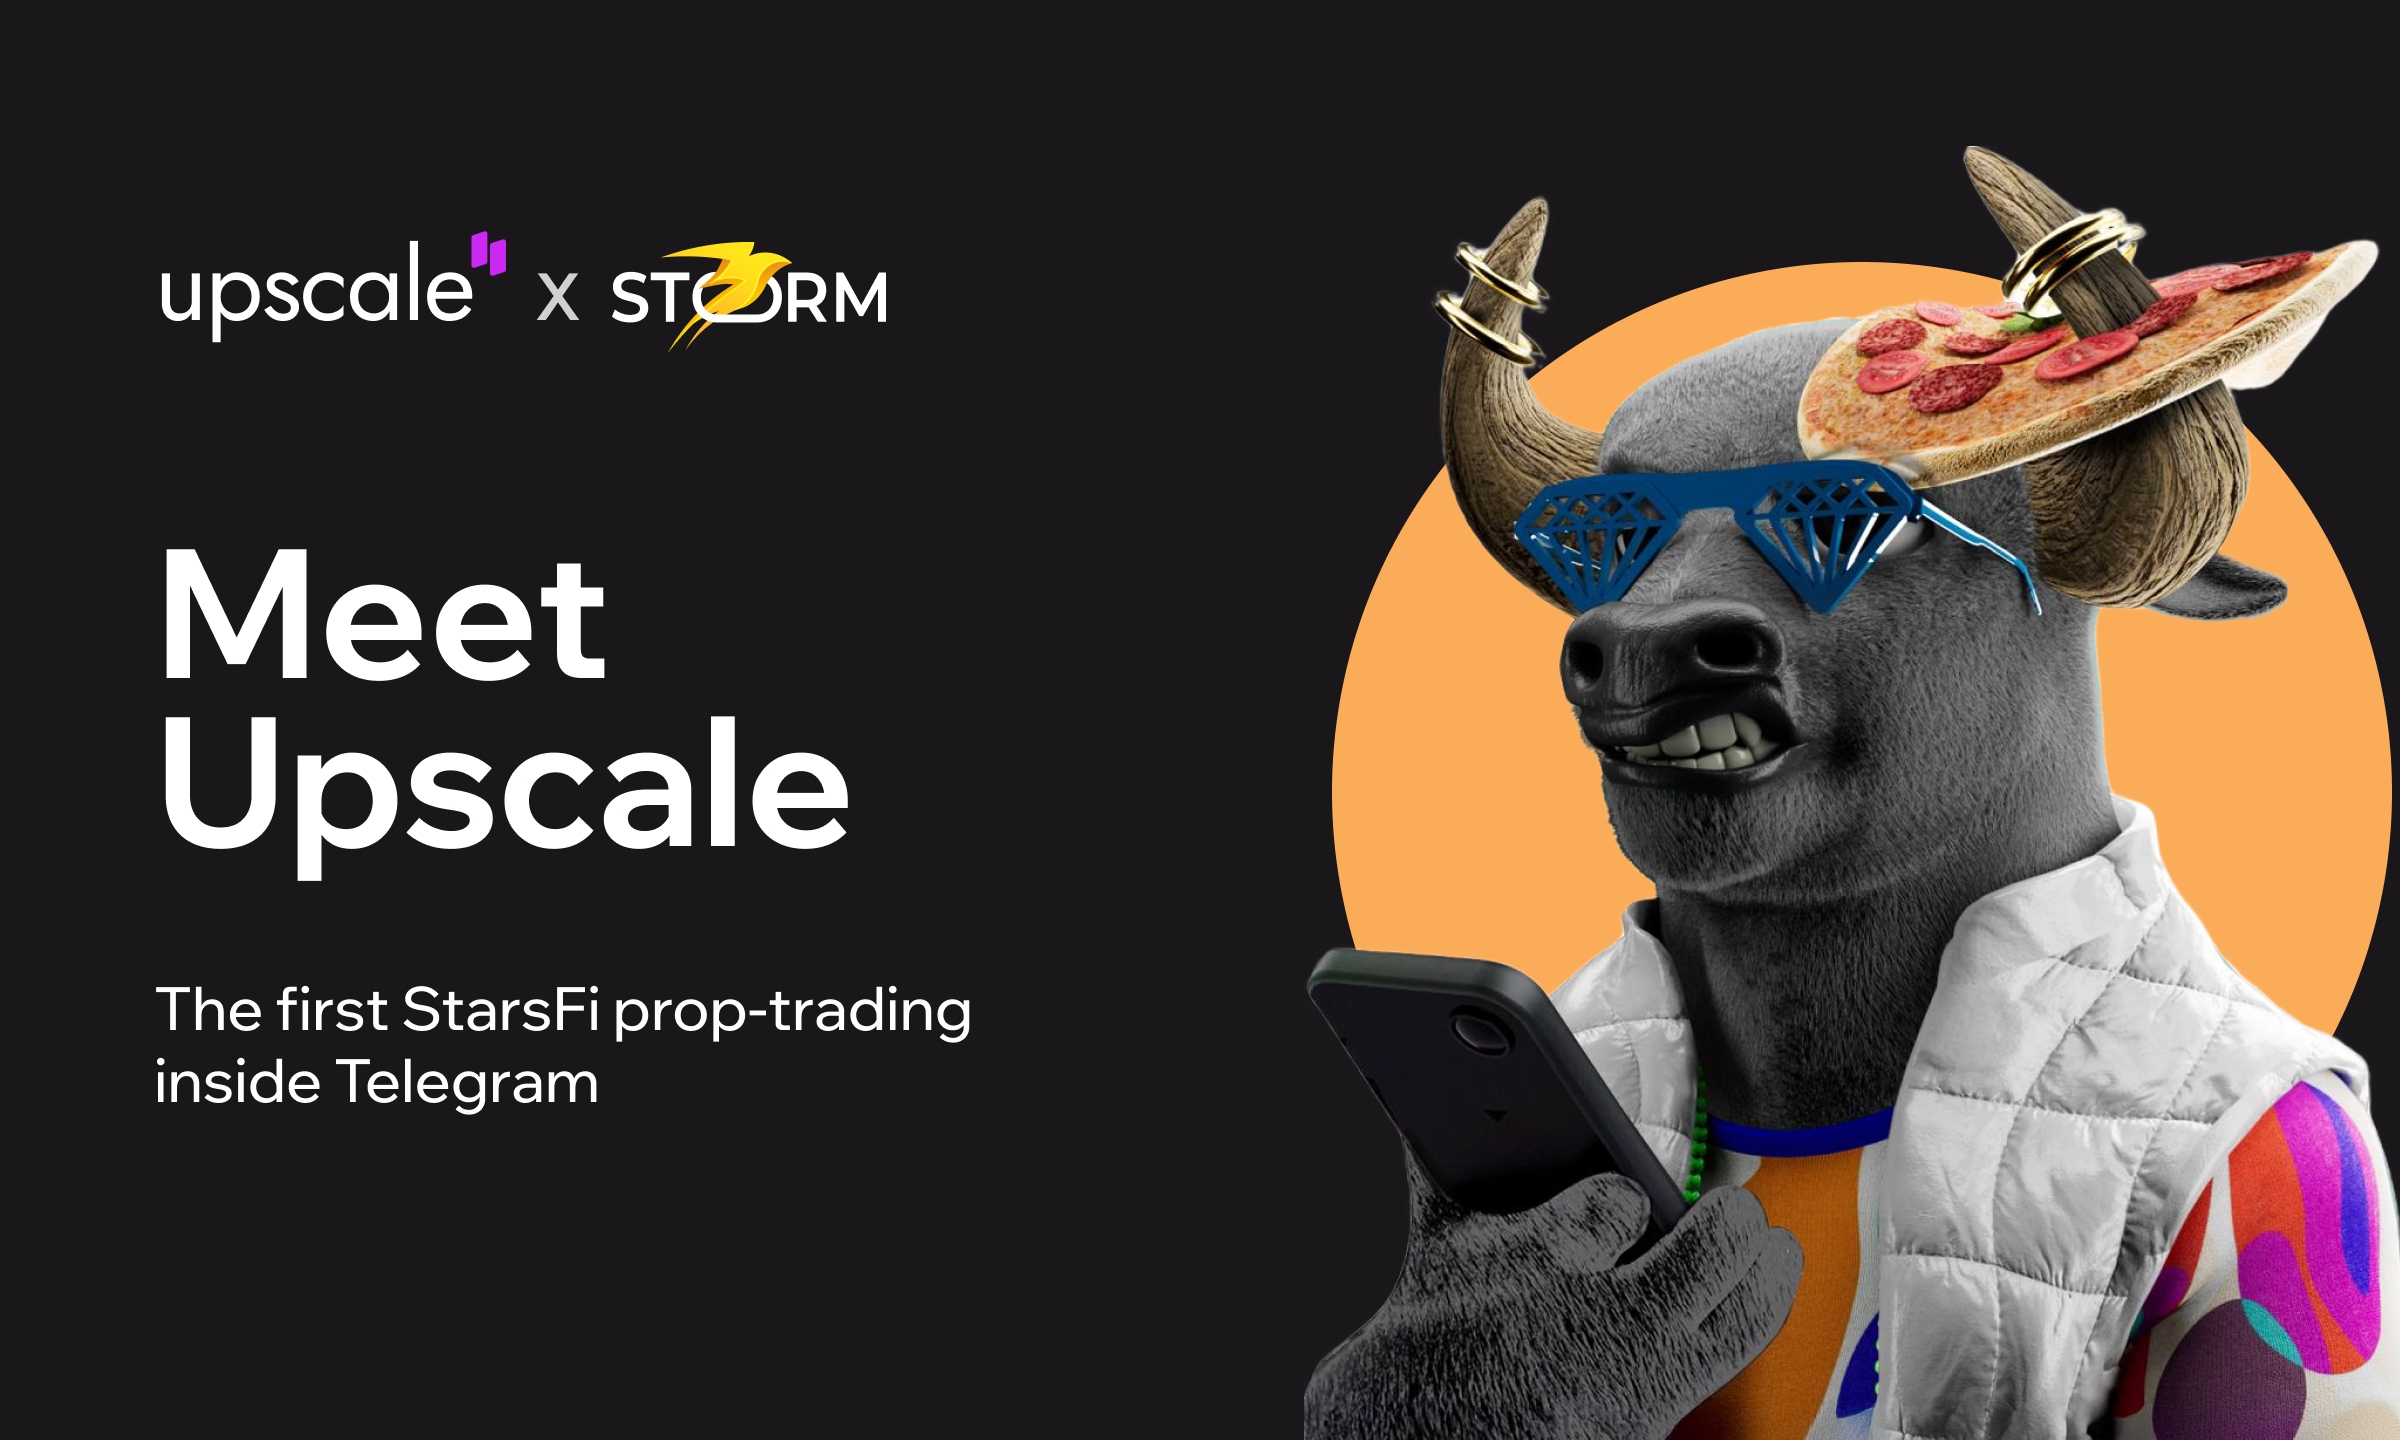
Today, Storm Trade announces the next step in the evolution of its ecosystem — Upscale, the first prop trading product in a Telegram mini-app, built on StarsFi.
Prop Trading — the Next Big Narrative for 2025?
Following a wave of mass liquidations in the futures market fueled by the hype around meme coins like $TRUMP and others, many traders have started seeking more sustainable trading models. Memes come and go — but losses stay.
In this context, prop trading could become one of the key narratives of 2025.
Prop trading encourages traders to focus not on reckless profit-chasing, but on discipline, risk control, and steady growth. Here, there are no wild liquidations — only clear terms, real money, and a path toward professionalism.
According to analysts, the total trading volume on crypto prop platforms exceeded $10 billion in 2024, with the number of traders in this segment growing by more than 40%.
Instead of chasing fleeting “x’s”, prop trading challenges traders to manage risks and stick to strategies, bringing them closer to becoming truly successful professionals. Upscale is built exactly for that — giving traders a chance to showcase their skills and earn by sharing profits.
Up to $100,000 Under Management — Transparent Terms Directly in Telegram
Upscale offers the opportunity to manage up to $100,000 without risking your own funds. Access to the program is available through a Telegram Stars subscription — fast, convenient, and transparent.
In the profit-sharing model, traders keep 80% of their profits, with the possibility to increase this share with consistent performance. This is one of the highest payout rates among prop platforms, where the average usually sits around 75%.
Trading conditions:
- 0.008% fees on opening and closing positions — lower than major CEXs (which average around 0.05–0.1%).
- Zero slippage on top crypto assets, including BTC, ETH, and other highly liquid pairs.
- Support for short-term strategies, including scalping — execution speed meets professional traders’ standards.
Trader support is available 24/7 — the Upscale team is ready to quickly resolve any issues, from technical problems to challenge progression. According to Binance Research, 60% of traders consider the quality of support a key factor when choosing a platform.
How Upscale Works: From Challenge to Funded Account
Upscale offers a clear and transparent path to gaining access to a trading account with up to $100,000 in capital:
- Access — choosing challenge parameters. At this stage, traders select the profit targets and risk limits that suit them best.
- Challenge Phase — the period where traders demonstrate their skills under controlled conditions. It’s crucial to show the ability to manage risks and achieve profit targets.
- Funded Phase — access to a real account with up to $100,000 in company capital. From this point, traders work with company funds and can withdraw up to 80% of the profits.
The Telegram mini-app ensures constant communication — all progress updates, results, and new opportunities are delivered directly inside the messenger. For those who prefer extended features and analytics, a web version will be available soon.
A ranking and achievements system will make the process not only profitable but also more engaging and fun. New levels, rewards, and challenges will keep traders motivated and moving forward.
Upscale and Telegram Mini Apps — A New Standard for Trading
Upscale was created to remove the barriers between traders and trading opportunities. It’s not just about the conditions or the capital — it’s about making the trading environment itself accessible.
Instead of building a separate application with a traditional onboarding flow, Upscale works as a Telegram Mini App — within an ecosystem already used by over 1 billion people. Telegram is no longer just a messenger — it’s a platform for next-generation products.
Telegram Mini Apps offer:
- Instant start — no downloads or registrations, directly within the familiar chat interface;
- Simplified onboarding — one click and the user is already inside the trading terminal;
- Viral effect — the platform can be easily shared with friends, organically expanding the trader community.
For Upscale, this is not just about convenience — it’s a strategic choice, making prop trading accessible to millions of Telegram users.
Upscale — A New Chapter in Prop Trading
Prop trading has been a growth tool for professional traders in traditional finance. Today, Upscale brings this model into Telegram, providing access to capital and professional conditions where the crypto community already lives and evolves.
Everything is changing — trading formats, platforms, and growth models. But one thing remains unchanged — the opportunity to grow with the market. Upscale makes this path easier: no extra barriers, no clunky interfaces, and no compromises between convenience and quality.
Seamless access via Telegram, up to $100,000 under management, transparent terms, and 24/7 support — all of this forms a new standard of prop trading that becomes part of the Storm ecosystem.
Upscale App | News Channel | GitBook: How to Start with Upscale | X (Twitter)
The post Introducing Upscale: The First StarsFi Prop Trading Platform on Telegram appeared first on BeInCrypto.