South Korea’s top five crypto exchanges will suspend WEMIX trading on June 2, causing the token to plunge over 60% to $0.2757 before recovering to around $0.36. This is the second time WEMIX has faced a group delisting. The DAXA exchange alliance said the decision was made due to WEMIX’s failure to meet listing standards. The move raises concerns over the token’s long-term credibility in the South Korean market.
KULR Tech Group is making significant strides in the web3 space. On May 1, it was included in the newly-launched Grayscale Bitcoin Adopters ETF. The new ETF offers investors direct exposure to companies adopting Bitcoin as a treasury company.
Last year on December 4, 2024, the space, aerospace, and defense focused company commited up to 90% of its surplus cash reserves to be held in bitcoin. To date, KULR has acquired 668 BTC.
This decision marked a significant shift in KULR’s financial strategy – positioning Bitcoin as a primary asset in its treasury program.
Now, in its another significant move in web3, it has announced a new blockchain-based supply chain initiative.
KULR Inclusion in GrayScale Bitcoin Adopters ETF
KULR Launches Own Blockchain
In an official press release and company tweet, KULR revealed that it will move product tracking and custody verification from centralized software to a distributed ledger. This will help the company in recording each inventory item as a tamper-proof, timestamped entry on a private blockchain.
The company notes that “decentralizing the inventory tracking system on a blockchain offers enhanced transparency, security, and real-time visibility across the entire supply chain”.
The US-listed company has also revealed that one of the first product lines to be logged will be KULR’s NASA WI-37A–certified lithium-ion batteries.
Now, these batteries with space and aerospace applications will be permanently stored on-chain so that future users can verify performance and compliance.
Today, we are announcing the launch of a blockchain-secured supply chain initiative to safeguard our product-related data.
Decentralizing our inventory tracking system on blockchain offers enhanced transparency, security, and real-time visibility across the entire supply chain.… pic.twitter.com/HkhnCoqmhX
KULR has built its own private rollup on Coinbase’s Base Layer-2 (L2) blockchain – an Ethereum-powered network – to host this supply chain ledger.
This choice leverages a public blockchain infrastructure (Coinbase Base) for security and scalability. It will still keep the network permissioned under KULR’s control.
Under the new system, the company will represent each battery or part as a non-fungible token (NFT) on the blockchain.
Each token’s metadata – including test results, manufacturing details and certification data – will be recorded immutably.
When a customer purchases a battery, its NFT can be transferred to the buyer’s on-chain wallet or sent to a company “burn” wallet to signal the transfer of ownership.
For bulk orders, KULR will set up dedicated customer wallets to batch-transfer many NFTs at once.
Internally, the company has built a custom user interface linked to encrypted KULR-owned wallets. This dashboard would let staff monitor inventory and token transfers in real time.
Market and Investor Impact
The market reaction to the company’s blockchain announcement has been cautiously positive.
On Friday, one day after the blockchain and Grayscale ETF inclusion, KULR closed at $1.33 USD on May 2. This marks a 4.72% increase from the previous day’s close of $1.27.
KULR Stock on May 2
Company has also hinted at more initiatives towards blockchain and Bitcoin adoption.
On the inclusion in Grayscale Bitcoin Adopters ETF, Kurl CEO has said, “Honored to be included in Grayscale’s Bitcoin Adopters ETF. Appreciate the recognition as we continue building KULR Tech into a category-defining company at the intersection of space, defense, AI, and Bitcoin.”
Thus, with more near-term crypto plans in line, KULR is likely to draw attention from both energy-sector investors and digital-asset enthusiasts.
Dogecoin price has recently experienced a notable decline after failing to clear key resistance levels. Despite this, several analysts are forecasting a potential rally, with some projections suggesting that Dogecoin’s price could reach $2 soon.
Dogecoin Price Key Support Levels
Dogecoin price has shown significant price fluctuations over the years. After failing to break past the $0.180 mark, the cryptocurrency dipped below several support levels, including $0.1750, $0.1720, and $0.1620. At one point, the DOGE price traded close to $0.1550, demonstrating the current bearish sentiment in the market.
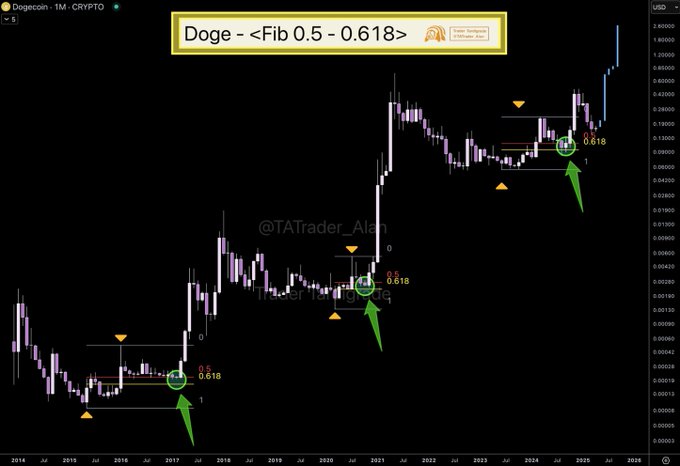
However, analysts are closely watching Dogecoin’s behavior around the critical Fibonacci retracement levels. According to crypto analyst Tarder Tardigrade, the 0.5 and 0.618 levels are significant because it is usually on these levels that bulls and bears create their turning points. In the past, the Dogecoin price has always regained these levels, marking them as support levels. At the moment, Dogecoin is trading higher than these levels, which may signal a reversal.
Technical analysts believe that if the price of Dogecoin stays above these levels, it is capable of moving higher in months to come. This would be similar to past trends where at some levels, Dogecoin rises sharply after consolidating at those levels.
Analysts Project $2 Target for Dogecoin Price
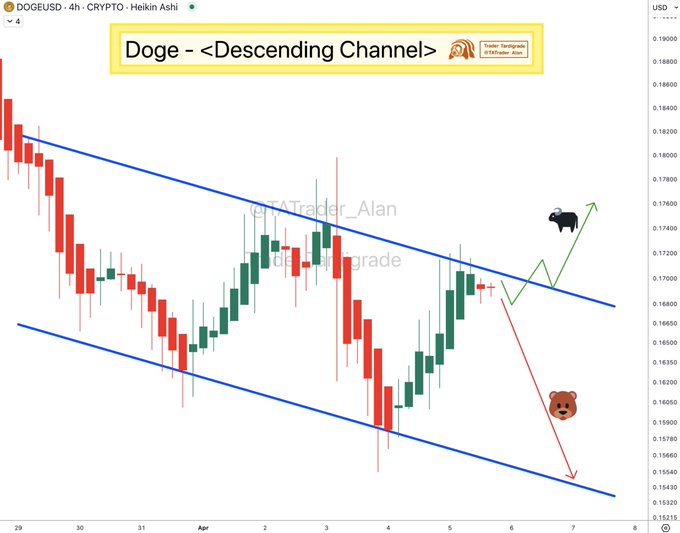
Currently several analysts believe that the Dogecoin price will soon go to $2. Tarder Tardigrade, an analyst, has pointed out that the cryptocurrency is on the verge of a breakout. Based on his technical analysis, the current DOGE price formation has characteristics similar to the previous descending channel followed by a parabolic rise.
Tardigrade pointed out that the DOGE price could form an ascending triangle in the range of $0.1732 to $0.1740 where an upthrust could occur to set the bulls on the charge. If this occurs the next levels of resistance exist in the region of $0.1800 to $0.1850 and if the price is to breach this region then a bigger rally can follow. According to his observation, if it follows the same trend like past bull cycles, Dogecoin price could rise to $2.
In addition, another analyst, Dynamite Trade, opined that Dogecoin has maintained a bullish outlook in the long run. By his estimation, the cryptocurrency is in a cycle and could possibly go up to $5.00 in the next phase of the market. This forecast is based on the established rising support trend observed during previous cycles, which continues to indicate a positive long-term outlook for Dogecoin.
Potential Catalyst: Dogecoin ETF Approval
A significant potential catalyst for Dogecoin’s price could come from developments in the broader cryptocurrency market. Speculation is growing around the possibility of a Dogecoin exchange-traded fund (ETF) being approved by the end of 2025. Current projections, according to Polymarket, suggest a 69% chance that the Dogecoin ETF could be approved by December 31, 2025.
Source; Polymarket
If the Dogecoin ETF is approved, it would allow institutional investors to gain exposure to the cryptocurrency in a regulated manner. This could lead to a surge in demand for Dogecoin, further driving up the DOGE price. The approval of such a product would also bring additional legitimacy to Dogecoin as an asset, potentially attracting more retail and institutional investors.
While the Dogecoin ETF remains speculative at this stage, analysts believe that its approval could act as a significant catalyst for price growth, with some projecting that Dogecoin could reach new all-time highs. Should the ETF come to fruition, it could provide the momentum needed for Dogecoin to break past previous resistance levels and continue its upward trajectory.
With several impressive milestones, the TRON network continues to assert its dominance in the stablecoin payment sector. Recently, the amount of USDT (Tether) circulating on TRON reached a new all-time high.
Meanwhile, the number of long-term holders on TRON has exceeded 2.66 million addresses. This reflects retail investors’ strong confidence and long-term commitment to this layer-1 blockchain.
Can USDT Supply on TRON Surpass Ethereum?
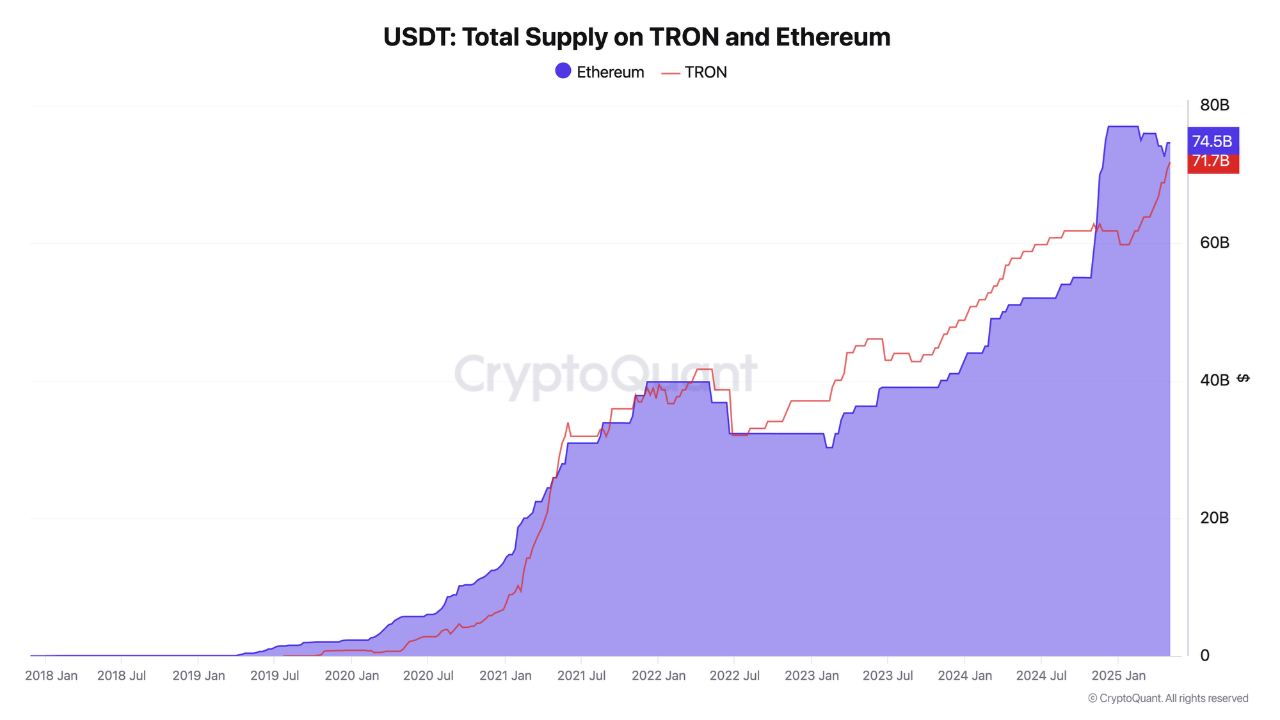
Data from CryptoQuant shows that the USDT supply of TRON has grown steadily over recent years. Currently, the market cap of USDT on TRON has hit a record high, with over $71 billion USDT in circulation.
Meanwhile, Ethereum hosts $74.5 billion USDT in circulation. TRON is narrowing the gap with ETH in terms of traders’ USDT usage.
USDT Total Supply on TRON and Ethereum. Source: CryptoQuant
“This milestone cements TRON’s position as one of the major blockchains in the DeFi space, and it may even surpass the adoption of some major chain competitors in the future,” Analyst Darkfost commented.
For context, the total stablecoin market capitalization is $242 billion, and Tether (USDT) alone accounts for $149 billion. That means TRON facilitates smooth transactions for 29% of the stablecoin market cap and 47% of USDT’s market cap.
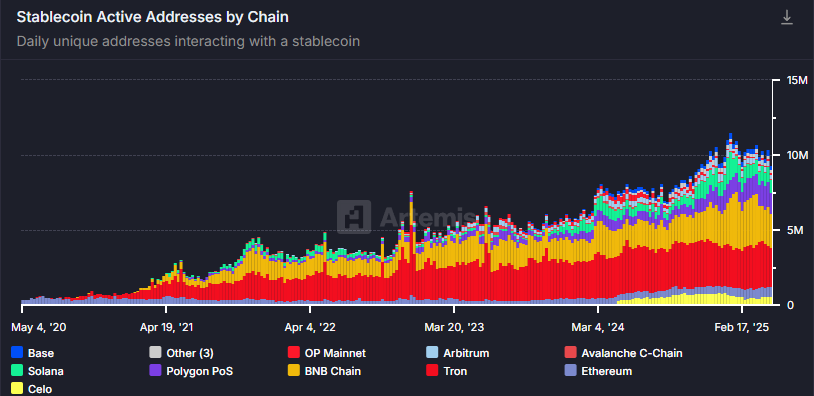
Additionally, data from Artemis shows that TRON accounts for 28% of all active stablecoin wallet addresses, more than any other blockchain tracked. This makes TRON the top chain in terms of fee revenue.
Stablecoin Active Address by Chain. Source: Artemis
A recent report from BeInCrypto reveals that experts predict stablecoins will attract strong VC interest in the future. The number of issuers could grow tenfold. New issuers may choose TRON, which would benefit a blockchain capable of handling $150 billion in weekly stablecoin transaction volume.
Tron (TRX) Backed by Loyal Long-Term Holders
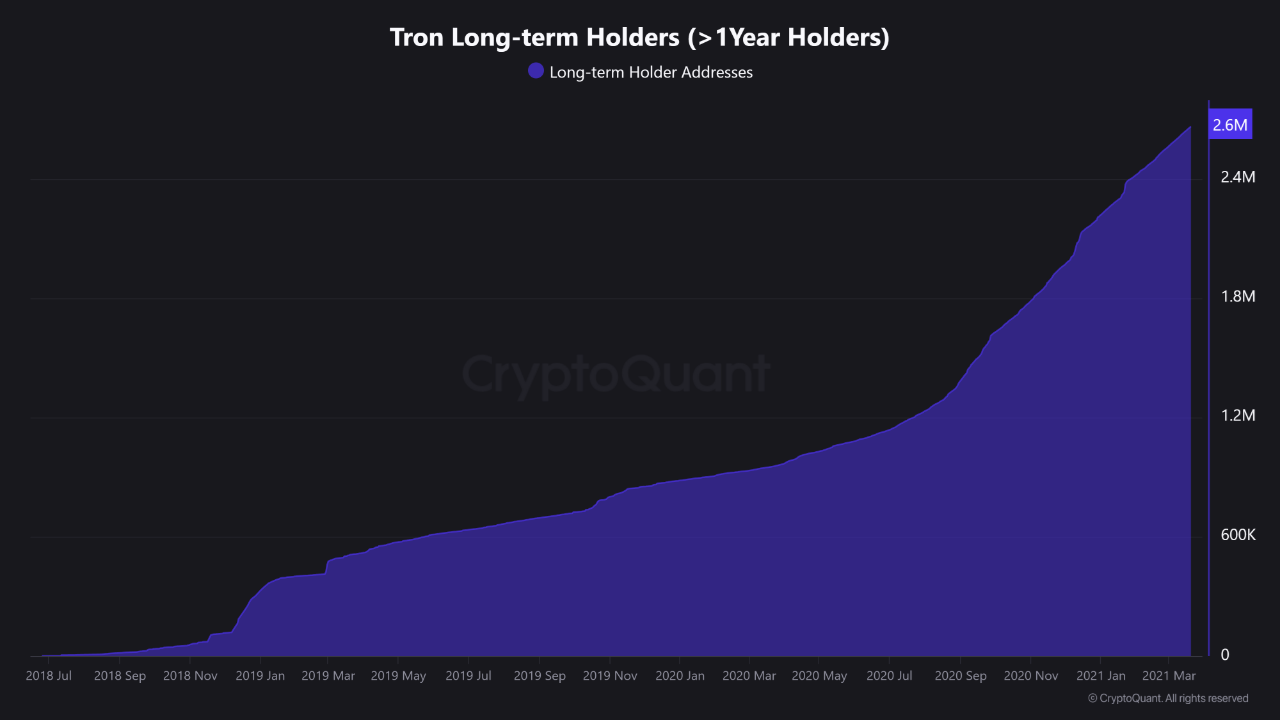
CryptoQuant also reports that 2.66 million TRX addresses have held their tokens for over one year without spending them. These wallets maintain balances of at least 10 TRX. While 10 TRX is worth only a few dollars, many retail investors choose to hold TRON long-term, even with small amounts of capital.
Analyst Crazzyblockk believes this metric indicates strong user loyalty and sustained engagement, which can support TRX’s price in the long run.
Tron Long-term Holders (> 1 Year Holders). Source: CryptoQuant.
“Increased long-term holding is often linked to higher confidence in the underlying network and potential for liquidity resilience,” Crazzyblockk said.
However, some investors argue that TRON’s vitality relies too heavily on USDT transactions. Data from Dune shows over 3 million TRON wallets are active daily, but most only transact USDT. Therefore, any strategic changes in the TRON–Tether relationship could significantly impact the network and the price of TRX.
This dependency highlights TRON’s weak utility outside the USDT space. For example, TRON lags far behind Solana in meme coin deployment and is significantly behind other chains in decentralized exchange (DEX) trading volume. Moreover, TRON appears nearly absent from the real-world asset (RWA) market share.
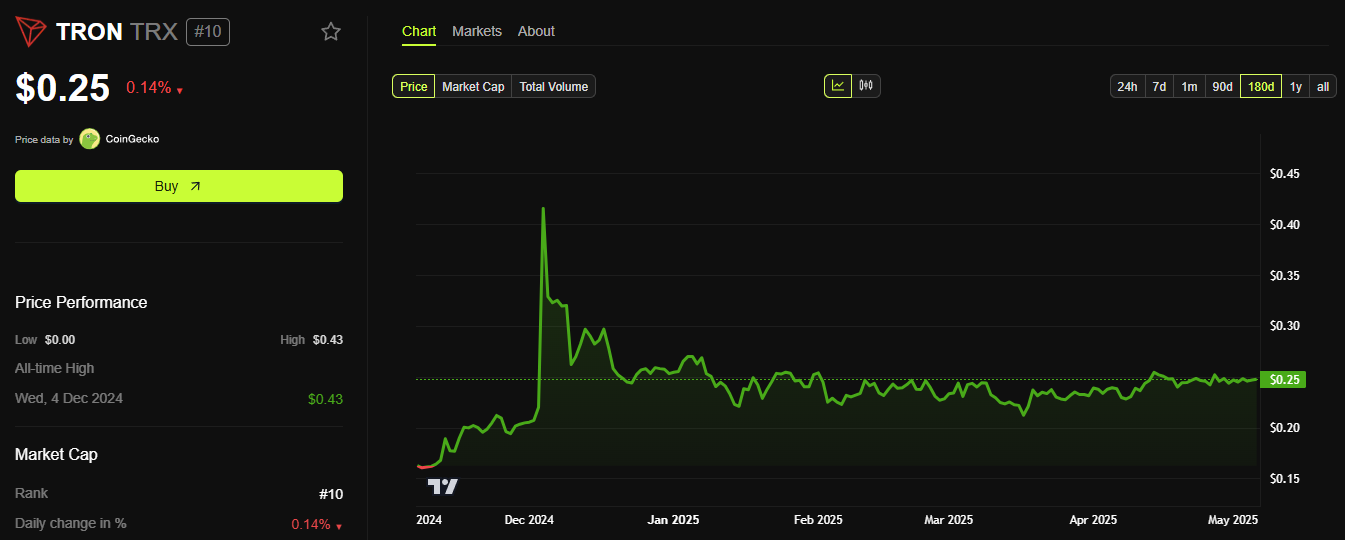
Tron (TRX) Price Performance Chart. Source: BeInCrypto.
At the time of writing, TRX is trading around $0.25, showing little movement after falling from a high of $0.45 late last year.