Dankrad Feist, a researcher from Ethereum, has unveiled a four-year plan to increase the blockchain’s gas limit by 100x. This ambitious move could potentially raise Ethereum’s transactions per second (TPS) to 2,000, significantly improving the blockchain’s scalability and performance. The plan aims to enhance Ethereum’s efficiency, paving the way for a more robust and faster network to handle growing demand in the crypto space.
Bitcoin price forecast enters a critical phase as BTC trades near record highs. While macro trends and ETFs support the rally, on-chain activity warns of a looming correction, with long-term holders offloading coins near peak levels.
Bitcoin price tops $94K setting new peak in 3 consecutive days
Bitcoin extended its recent rally to reach a new all-time high of $94,220 on April 23, climbing nearly 4% over the last 24 hours. This marks the third consecutive day the leading cryptocurrency has posted a fresh peak, beginning April 20.
Bitcoin price action, April 23 | Coingecko
The bullish momentum follows renewed macroeconomic uncertainty, as former President Donald Trump intensifies political pressure on Federal Reserve Chair Jerome Powell, reigniting investor concerns over monetary policy direction.
Traders and institutional players appear to be pricing in heightened volatility in traditional markets, as Trump publicly criticized the Fed’s current leadership and reaffirmed his stance on aggressive tariffs.
These statements have catalyzed a rotation of capital from risk-weighted equity sectors into Bitcoin and related crypto products. This trend is in line with BTC’s historical behavior as a hedge asset during periods of political and monetary instability.
Bitcoin ETFs pulled highest inflows since inception
Bitcoin ETFs posted their strongest single-day net inflow in 2025 on Tuesday, with over $921 million added to fund holdings, according to Farside data. The record-breaking inflow underscores rising institutional demand, particularly as macroeconomic concerns and trade policy risks escalate.
Bitcoin ETF flows, April 22, 2025 | Source: Farside
The spike in ETF allocations occurred as traditional stock indices wavered midweek amid renewed trade rhetoric from Trump’s camp and speculation surrounding the potential ousting of Fed Chair Jerome Powell.
Analysts interpret this as a reallocation of capital, with Bitcoin ETFs benefitting from risk-off sentiment in equities.
The $100,000 psychological barrier now appears within reach, yet on-chain signals suggest underlying risks that could derail momentum.
Age Consumed surged to 12 million BTC signalling intense profit take from long-term holders
While price and institutional inflows point to a strengthening bull cycle, on-chain data tells a more nuanced story.
According to Santiment, Bitcoin’s Age Consumed—a metric tracking the movement of previously dormant coins—spiked dramatically from 2.03 million BTC on April 19 to over 12 million BTC by April 23.
This sharp increase in Age Consumed signals that Bitcoin long-term holders are moving large quantities of previously idle coins, often associated with profit-taking or strategic exits.
Bitcoin Age Consumed vs. BTC price | Source: Santiment
The sudden surge in Age Consumed typically reflects distribution from older wallets, a trend that has historically preceded local tops or significant pullbacks.
The movement suggests that some long-term investors may be capitalizing on Bitcoin’s latest highs, potentially dampening bullish momentum in the near term.
While not definitive on its own, the Age Consumed spike introduces a cautionary signal as Bitcoin approaches the psychological $100,000 mark. If selling pressure from long-term holders intensifies, it could introduce volatility or stall further gains—even in the face of bullish macro and institutional trends.
Bitcoin price forecast today: Bull trap risk looms near $94K as weekly chart hits upper Bollinger band
Bitcoin price forecast signals today show bulls attempting to breach the $95,000 as BTC taps the upper Bollinger Band on the weekly chart. While the rally from sub-$80,000 lows marks a strong technical rebound, traders may need to exercise caution.
BTC price has now entered the resistance zone near $94,000–$107,000, where past weekly candles have previously faced rejection.
The Bollinger Bands (BB) upper line at $107,383 acts as a key resistance ceiling. Unless this level is breached with volume, BTC risks rejection at the top of its volatility envelope.
Momentum indicators show mixed signals. The Relative Strength Index (RSI) stands at 57.37, just above its moving average (54.20), hinting at mild bullish bias—but still well below overbought levels.
However, the RSI Moving Average Histogram (RSI-MA) shows a divergence, with the slower red MA at 60.61 still declining while the green bar is only at 47.61. This suggests momentum remains fragile.
Given these conditions, Bitcoin price forecast may be susceptible to a bull trap if price fails to decisively close above $94,000 with strong follow-through. Without confirmation, profit-taking could trigger a reversal toward the mid-Bollinger level around $92,200 or lower support near $77,000.
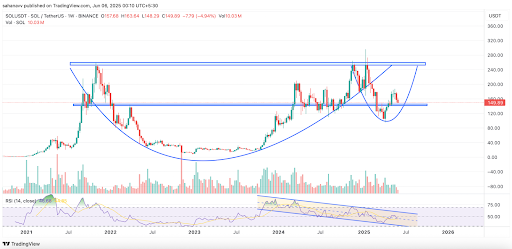
Solana is pulling back into key support levels, as the selling volume is causing the price to head towards the crucial support close to $140. The SOL price action shows a correction following a rejected top and may now be approaching the base of the prior demand. The drop below $151 support, which is a pivotal one, has led to a drop below $150, which could lead to a deeper retracement toward the $141 to $145 zone.
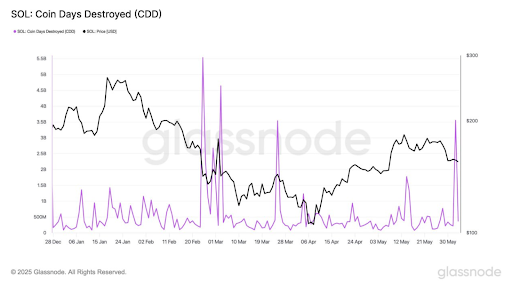
The market sentiment around Solana is shifting as the big dormant coins are on the move. As per the data from Glassnode, the platform witnessed its 3rd biggest Coin Days Destroyed or CDD, which is a metric that tracks the movement of coins based on how long they have remained dormant. A massive spike of nearly 3.55B CDD, which suggests either profit taking or repositioning.
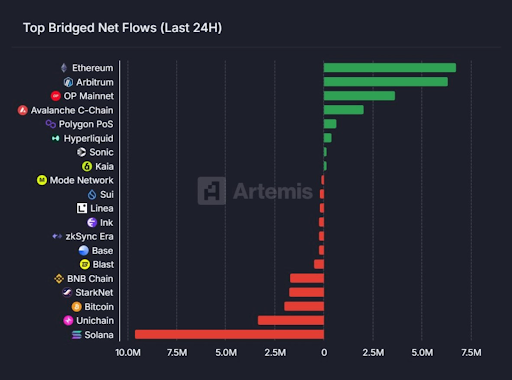
Secondly, another on-chain data point suggests a massive efflux is the inflows and outflows of the bridged cryptos. These are the cryptos that are transferred from one blockchain to another, and hence the data suggests that the investors are moving out of Solana. As per the data from Artemis, Solana is the top chain that faced huge outflows.
The above chart shows a huge outflow from the Solana blockchain, while Ethereum experiences a massive influx of nearly $7.5 million compared to over $10 million in outflows. This suggests a probable liquidity flow between these top two blockchains, while the race for supremacy between them has gained huge attention in recent times.
What’s Next for the Solana (SOL) Price—Will It Drop Below $140 or Rebound to $160?
Ever since the SOL price marked the highs close to $300, it has been trading within a steep descending trend. The rebound from the yearly lows indicated a rise above the bearish influence, but the current price action suggests a deeper correction could be possible. The price has been marking huge losses since the start of the month, which could drag the levels close to the pivotal support levels, probably below $140.
The weekly chart of the SOL price suggests the token is undergoing a recovery, but it is stuck within a cup & handle pattern. The token is heading towards the crucial support at $141, and as the weekly RSI is plunging to the lower support of the descending parallel channel, the price may also drop to the support of the handle. However, the levels may rebound and rise along the support of the pattern and reach $160 in the coming days.
The post Solana Outflows Spike, Potentially Dragging the Price Below $140, While The $250 Target Remains Active appeared first on Coinpedia Fintech News
Solana is pulling back into key support levels, as the selling volume is causing the price to head towards the crucial support close to $140. The SOL price action shows a correction following a rejected top and may now be approaching the base of the prior demand. The drop below $151 support, which is a …
XRP is currently showing signs of weakness after its recent rally, and technical signals show that the token could be preparing for a deeper pullback. While the price remains above important support levels, chart patterns and broader market conditions are flashing early warning signs.
Bearish Divergence on the Weekly Chart
On the weekly timeframe, a bearish divergence is forming. While XRP’s price has made higher highs, the Relative Strength Index (RSI) is printing lower highs. This kind of divergence is often a hint that momentum is slowing down. Although this signal hasn’t been confirmed yet, if it does in the coming weeks or months, XRP may face a stronger correction.
According to analyst Josh of Crypto World, support lies around the $3.00 mark, while the next major resistance is between $4.60 and $4.70. These zones are based on Fibonacci levels, which are commonly used to predict where prices could reverse.
Daily Chart Shows Breakdown Signs
On the daily chart, XRP is struggling to hold the $3.30–$3.40 range, which recently acted as strong support. If the price closes below $3.30 and fails to recover, this could confirm a bearish shift in short-term trend. In that case, XRP may head toward $3.00 or even $2.95.
The 38.2% Fibonacci retracement level around $2.95 is a critical support area during market corrections. If this level holds, XRP could bounce. But if the price drops below $2.75 and then $2.65, a retest of April’s lows becomes possible.
Broader Market Impact
XRP is not alone. Ethereum is facing resistance and showing short-term bearish divergence, while Bitcoin struggles to break higher. Bitcoin dominance has also ticked upward, often a bearish signal for altcoins. This overall market pressure is affecting XRP’s outlook in the near term.
For now, XRP needs to hold above $2.75 to keep hopes of a continued rally alive. If it manages to reclaim $3.36, the correction might be over.
The post XRP Price Prediction For July 24 appeared first on Coinpedia Fintech News
XRP is currently showing signs of weakness after its recent rally, and technical signals show that the token could be preparing for a deeper pullback. While the price remains above important support levels, chart patterns and broader market conditions are flashing early warning signs. Bearish Divergence on the Weekly Chart On the weekly timeframe, a …