Hedera (HBAR) is on the move, climbing more than 8% on Friday and extending its seven-day gains to an impressive 21.7%. This rally comes alongside rising momentum signals, including a surging BBTrend and an RSI that has pushed into overbought territory.
Price is also nearing a key resistance zone, backed by bullish EMA alignment that suggests the uptrend may still have room to run.
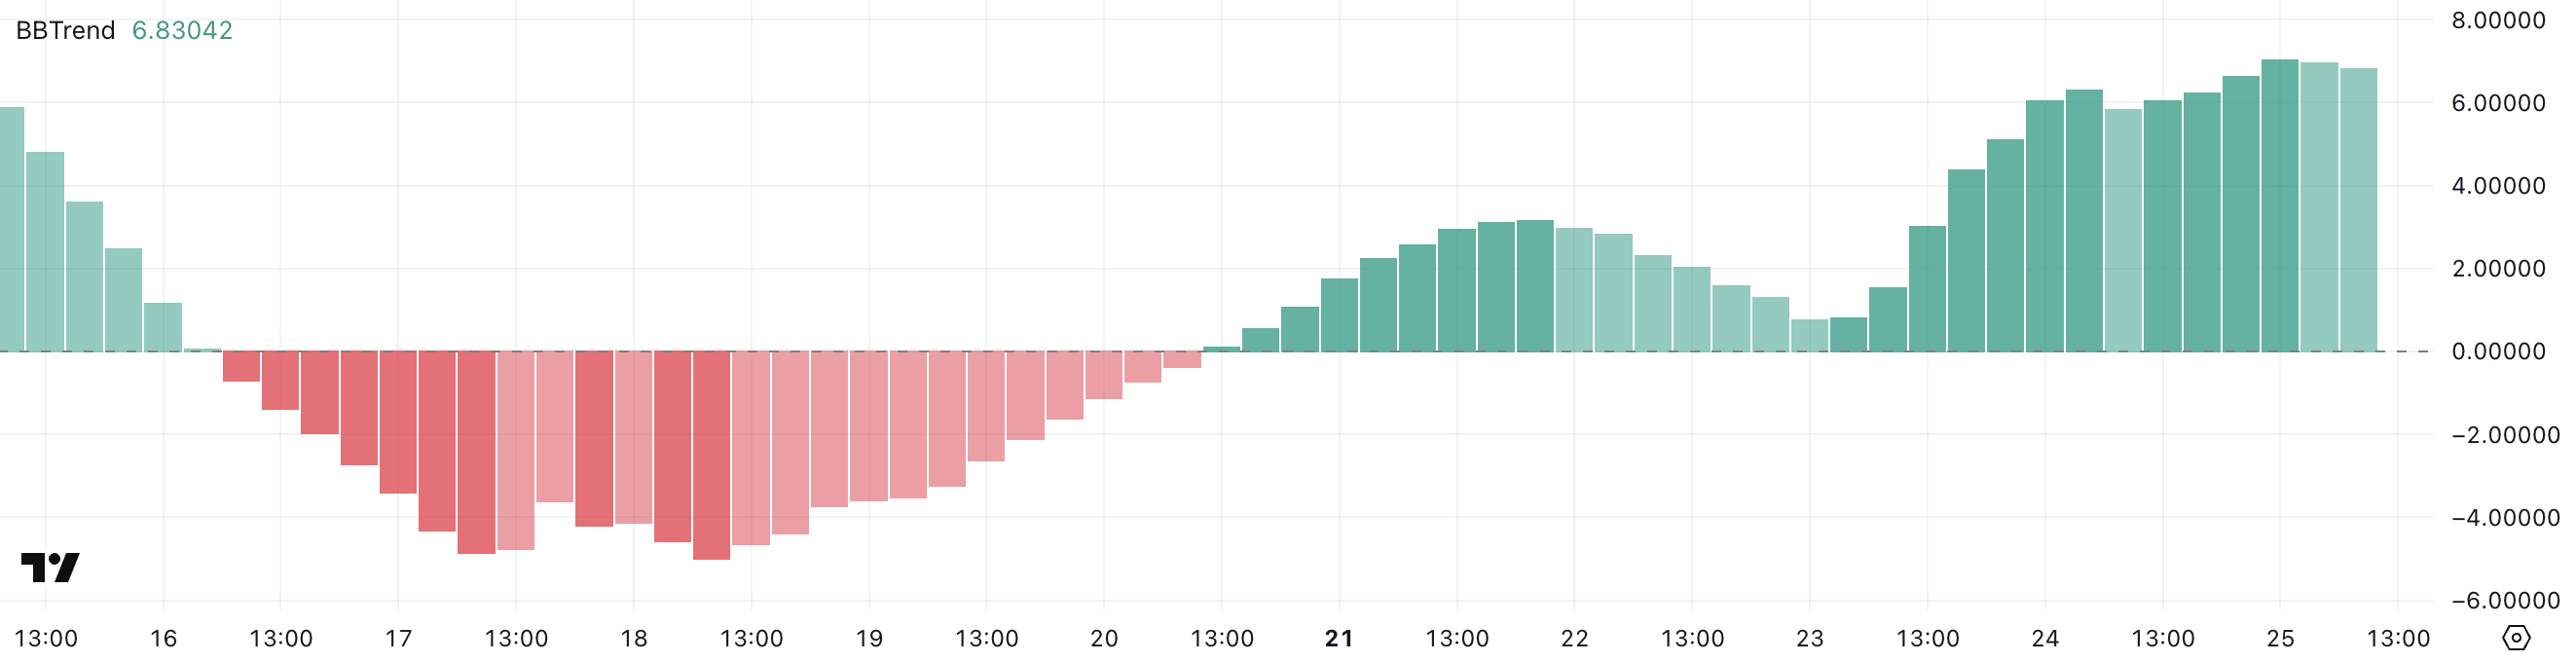
Hedera’s BBTrend Is Soaring – What Does it Mean?
Hedera’s BBTrend indicator has surged to 6.83, up sharply from just 1.5 two days ago. This jump signals a significant increase in volatility and momentum in the price action.
BBTrend, short for Bollinger Band Trend, is a metric derived from Bollinger Bands that measures the strength and direction of a trend. Values below one typically reflect a weak or flat market, while values above 3 indicate the emergence of a strong trend.
A sudden rise in BBTrend often suggests that the asset is transitioning out of a low-volatility phase and entering a more directional move.
With BBTrend now at 6.83, Hedera may be in the early stages of a strong bullish or bearish breakout. Such elevated levels suggest that volatility is expanding quickly, and price is starting to move decisively away from its recent range.
While BBTrend doesn’t indicate direction on its own, when combined with other bullish signals, like rising price or volume, it can confirm the start of a sustained uptrend.
Traders will watch closely to see if this momentum continues or fades, as a reversal from such elevated levels could also lead to sharp pullbacks.
Hedera RSI Enters Overbought Zone—What Comes Next?
With RSI now well into overbought territory, Hedera may be nearing a local top—at least temporarily. While a high RSI confirms strong bullish momentum, it can also signal that buyers are becoming exhausted.
On the other hand, sustained overbought conditions can also occur during strong uptrends, so that traders will watch closely for either continued breakout strength or signs of reversal.
Hedera Nears Breakout—But Support Levels Are Key
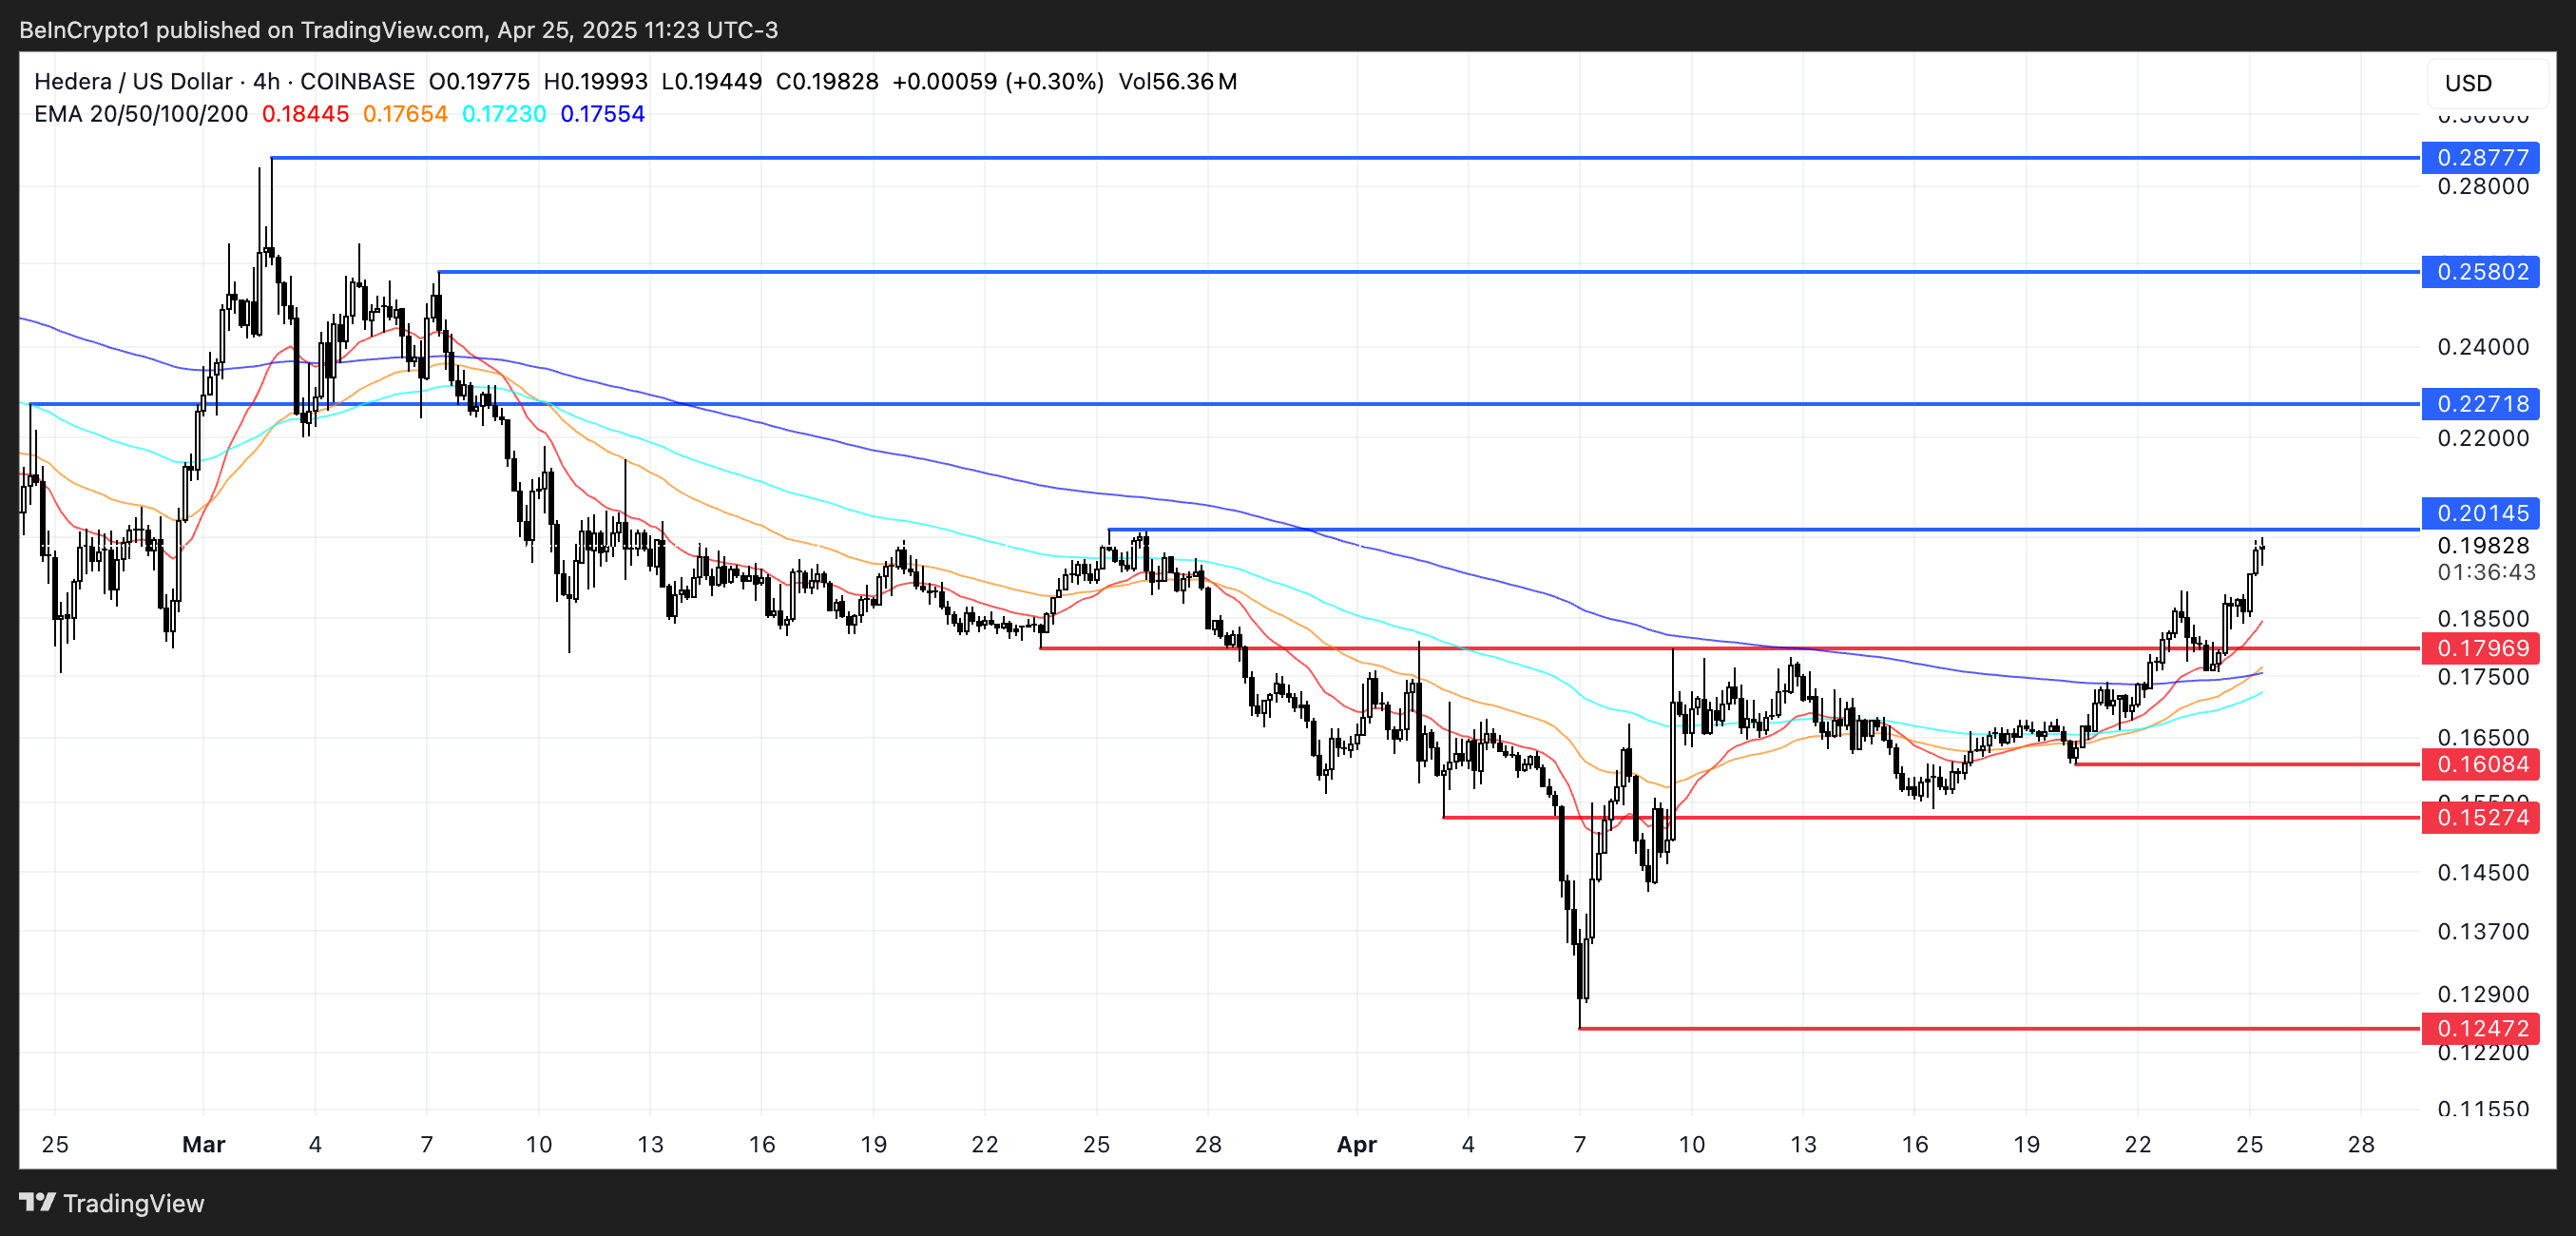
Hedera’s EMA lines show a bullish alignment, with short-term moving averages positioned above the long-term ones—a classic signal of upward momentum.
HBAR price is also trading near a key resistance level at $0.20, which has acted as a ceiling in recent sessions. If buyers can push the price through this zone, the next resistance levels to watch are $0.227 and $0.258.
A strong uptrend continuation could even send HBAR to $0.287, marking its first break above $0.28 since February 1.
However, traders should also monitor the downside risk. If the support at $0.179 is tested and fails, it could trigger a deeper pullback.
In that case, HBAR may slide to $0.16 and possibly $0.152, both of which have served as prior support zones.
If bearish momentum accelerates, a drop toward $0.124 isn’t out of the question, making the current levels a critical battleground for short-term direction.
Virtual Protocol, a decentralized platform for creating and monetizing AI agents, has seen a sharp uptick in user activity over the past few days. This has fueled a surge in demand for its native token, VIRTUAL.
According to on-chain data, the number of unique wallets holding Virtual Protocol’s AI agent tokens has increased significantly across the Base and Solana networks. This has driven a rally in the VIRTUAL’s price, which has climbed 161% over the past week.
VIRTUAL Token Rockets to 2-Month High
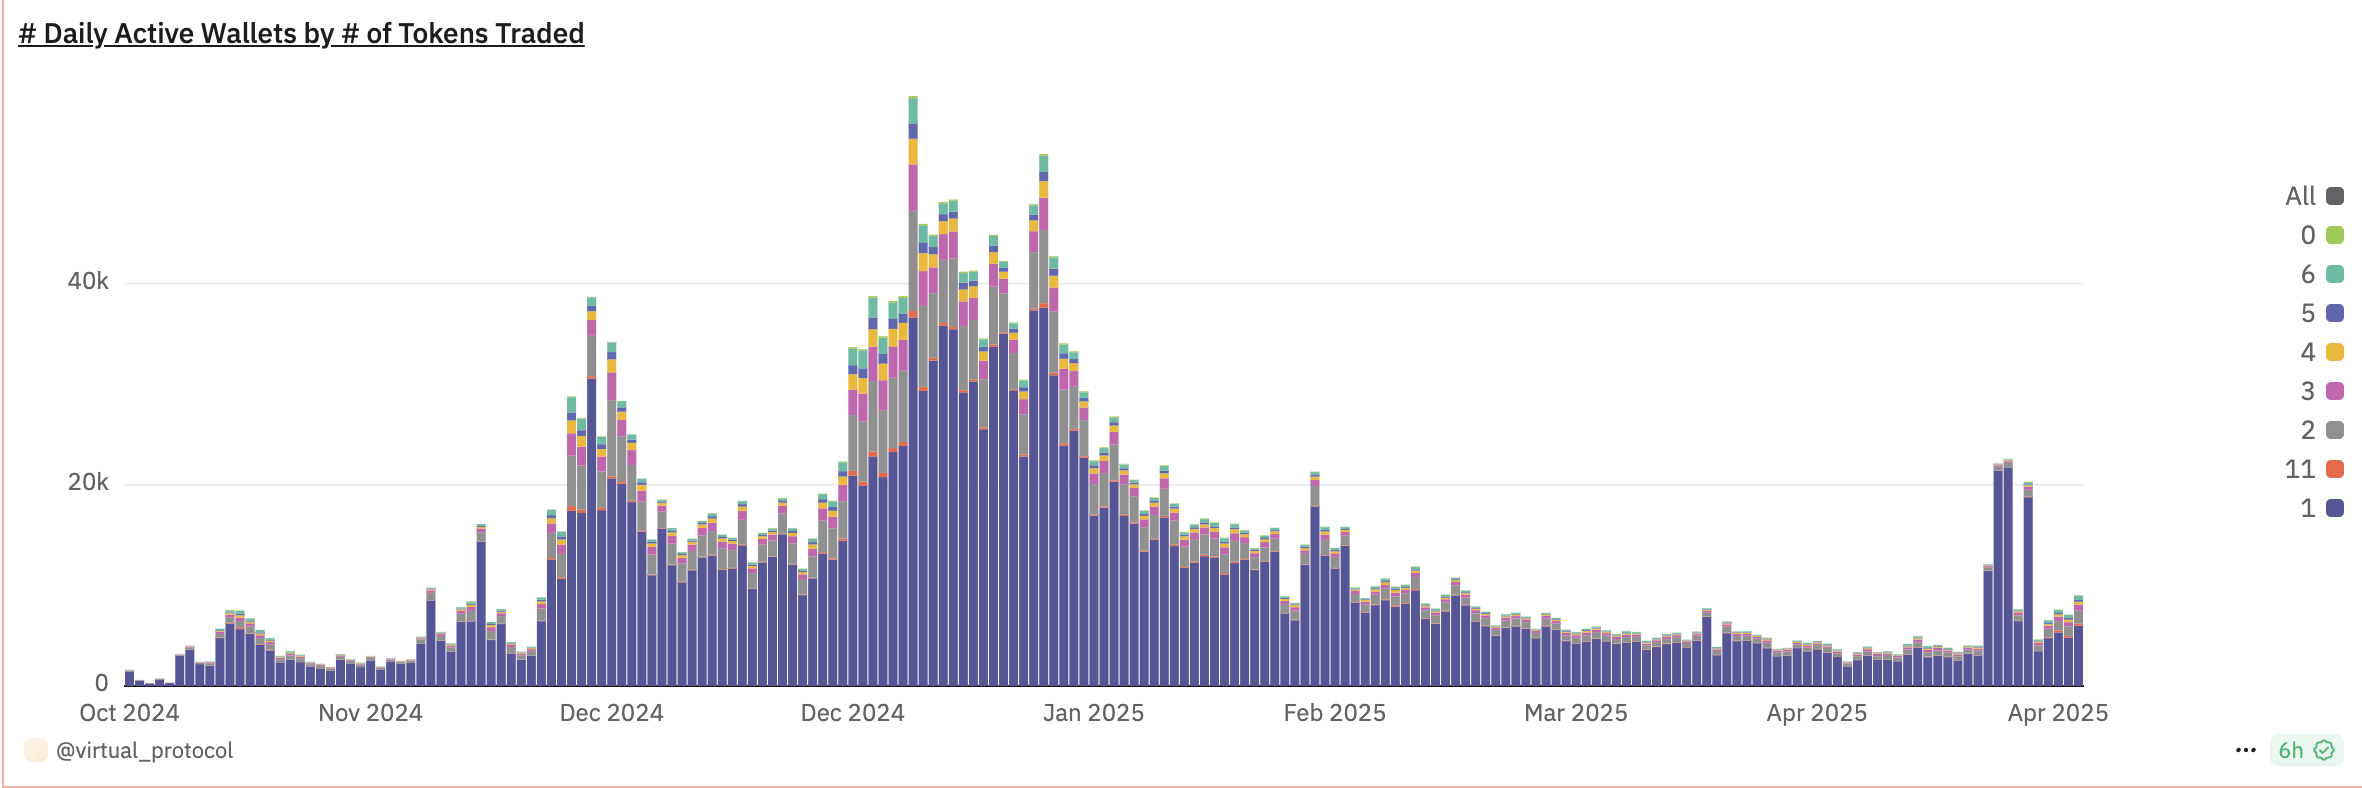
According to Dune Analytics, the number of unique active wallets holding Virtual Agents’ tokens across the Base and Solana blockchains has jumped by 95% in the past five days.
Virtual Protocol Daily Active Wallets. Source: Dune Analytics
This spike in wallet activity highlights growing user engagement with the platform’s AI agent ecosystem, as more participants join to create, deploy, and interact with decentralized AI services.
Buying pressure on VIRTUAL has intensified as users seek to acquire Virtual Agents and participate more actively in the protocol. Over the past week, the token’s price has climbed by 161%, reflecting the heightened demand.
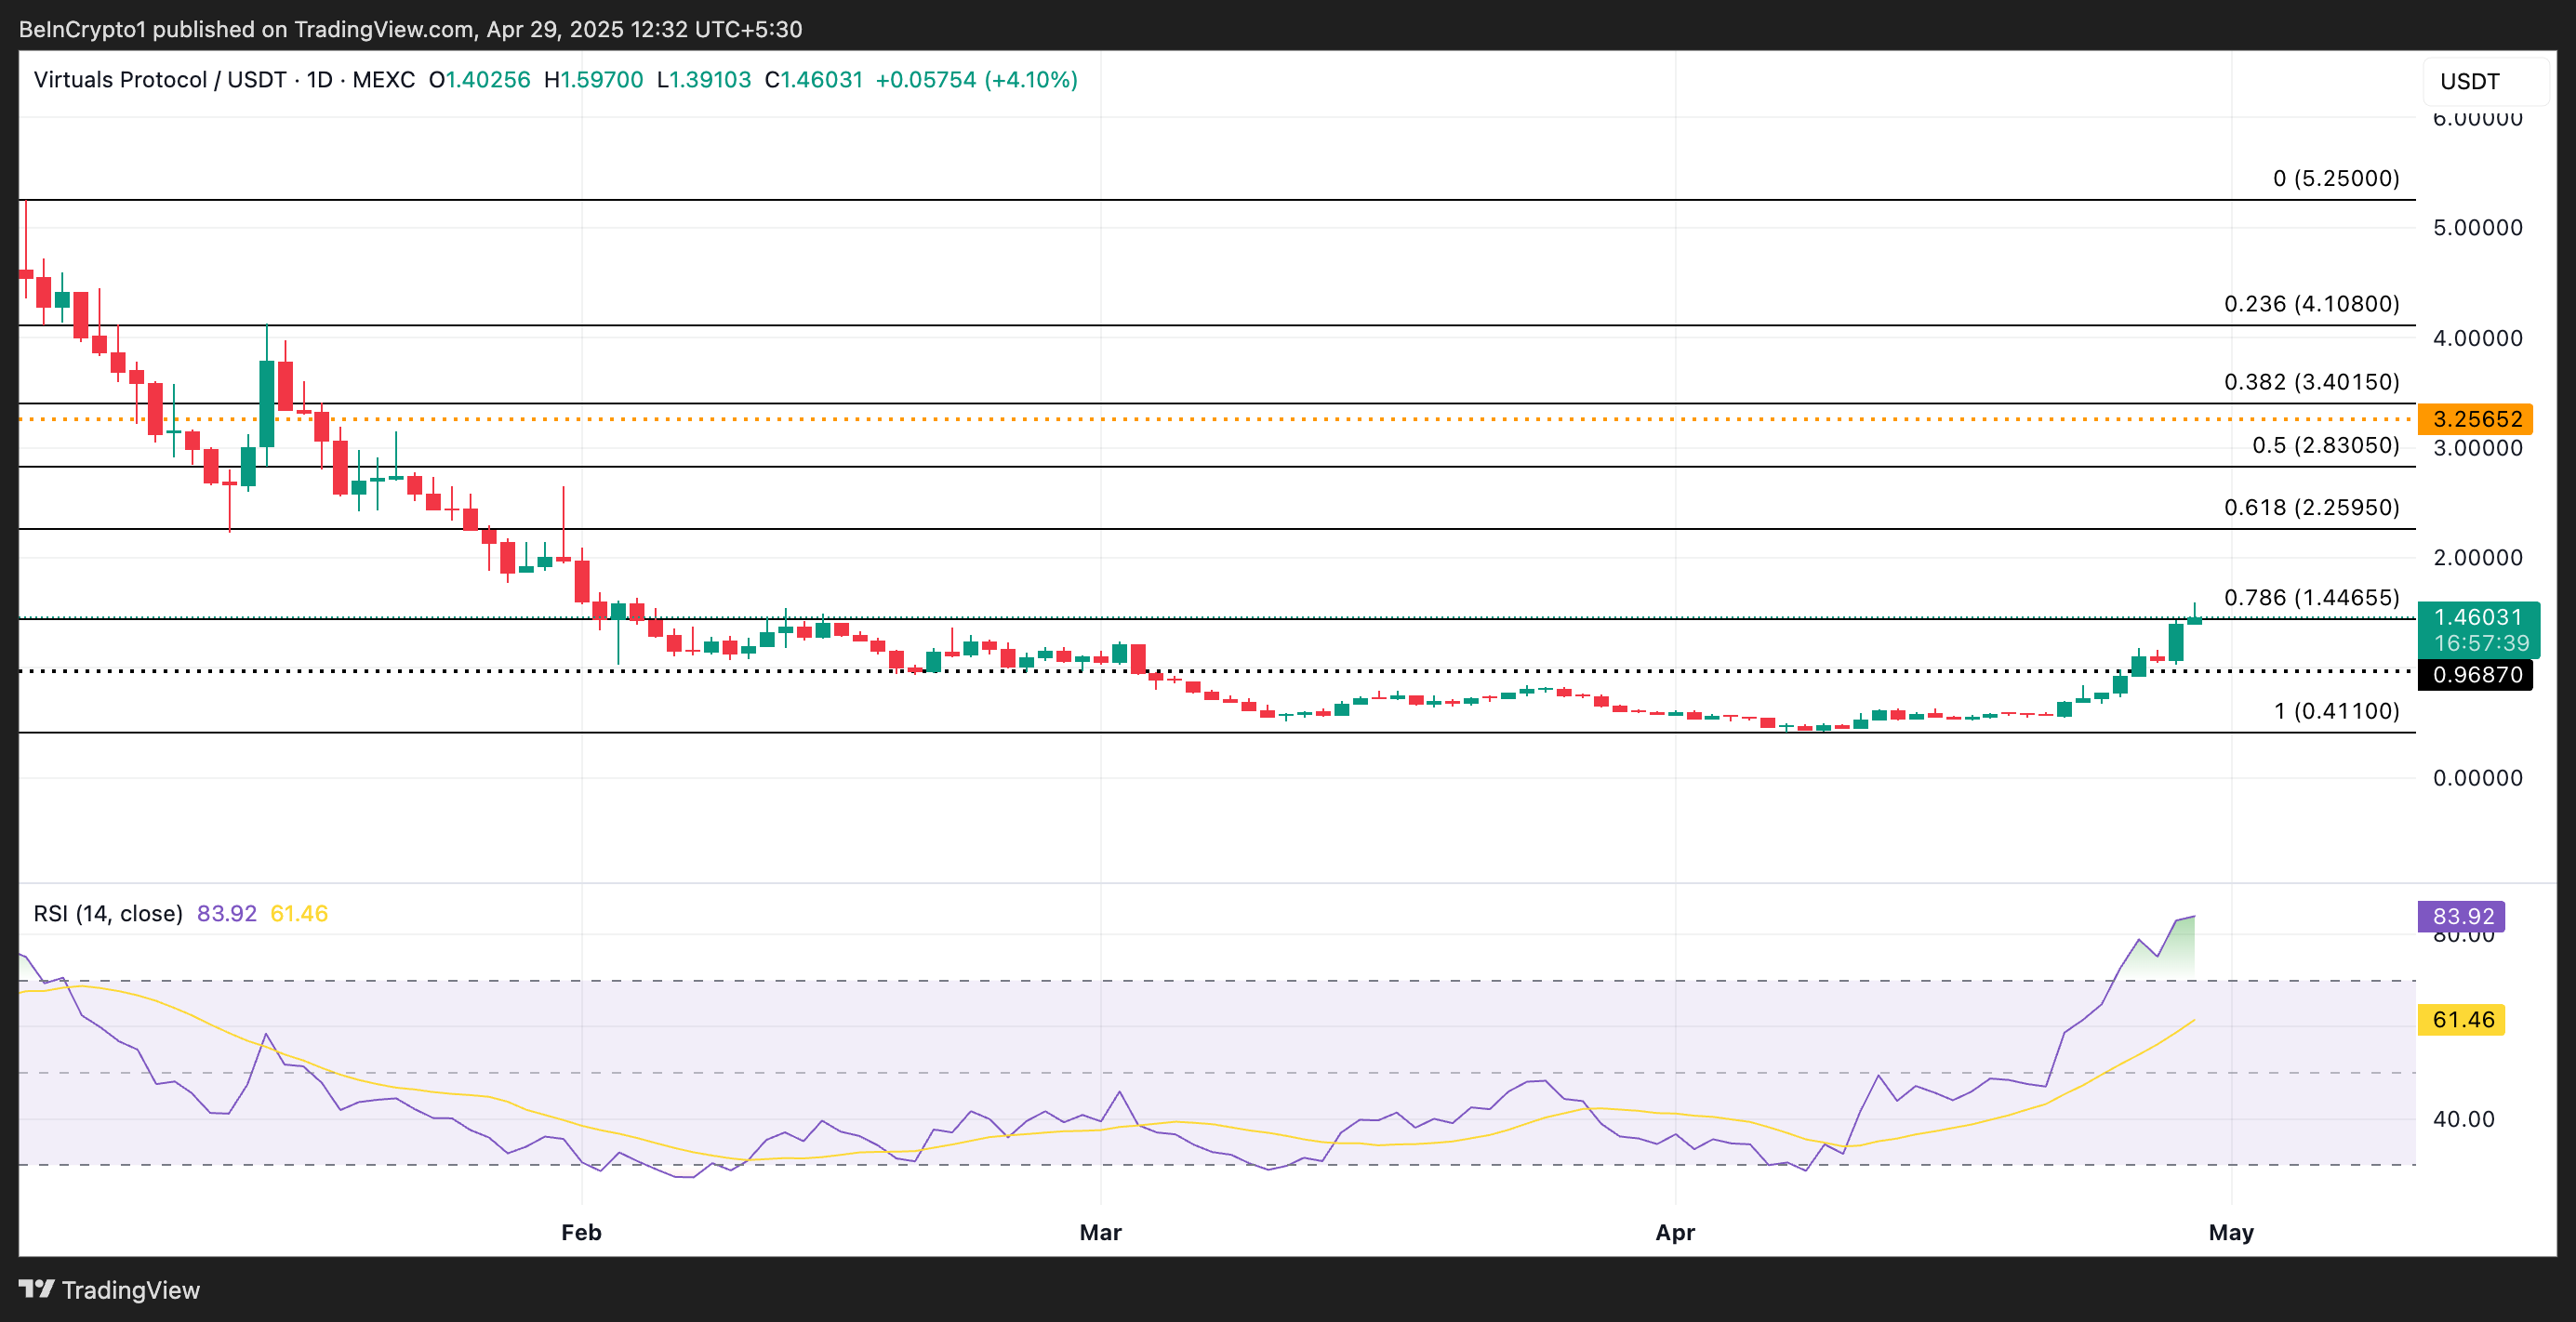
Today alone, VIRTUAL is up 18%, making it the top gainer across the cryptocurrency market. As of this writing, it trades at a two-month high of $1.46, with technical indicators pointing to further price rallies.
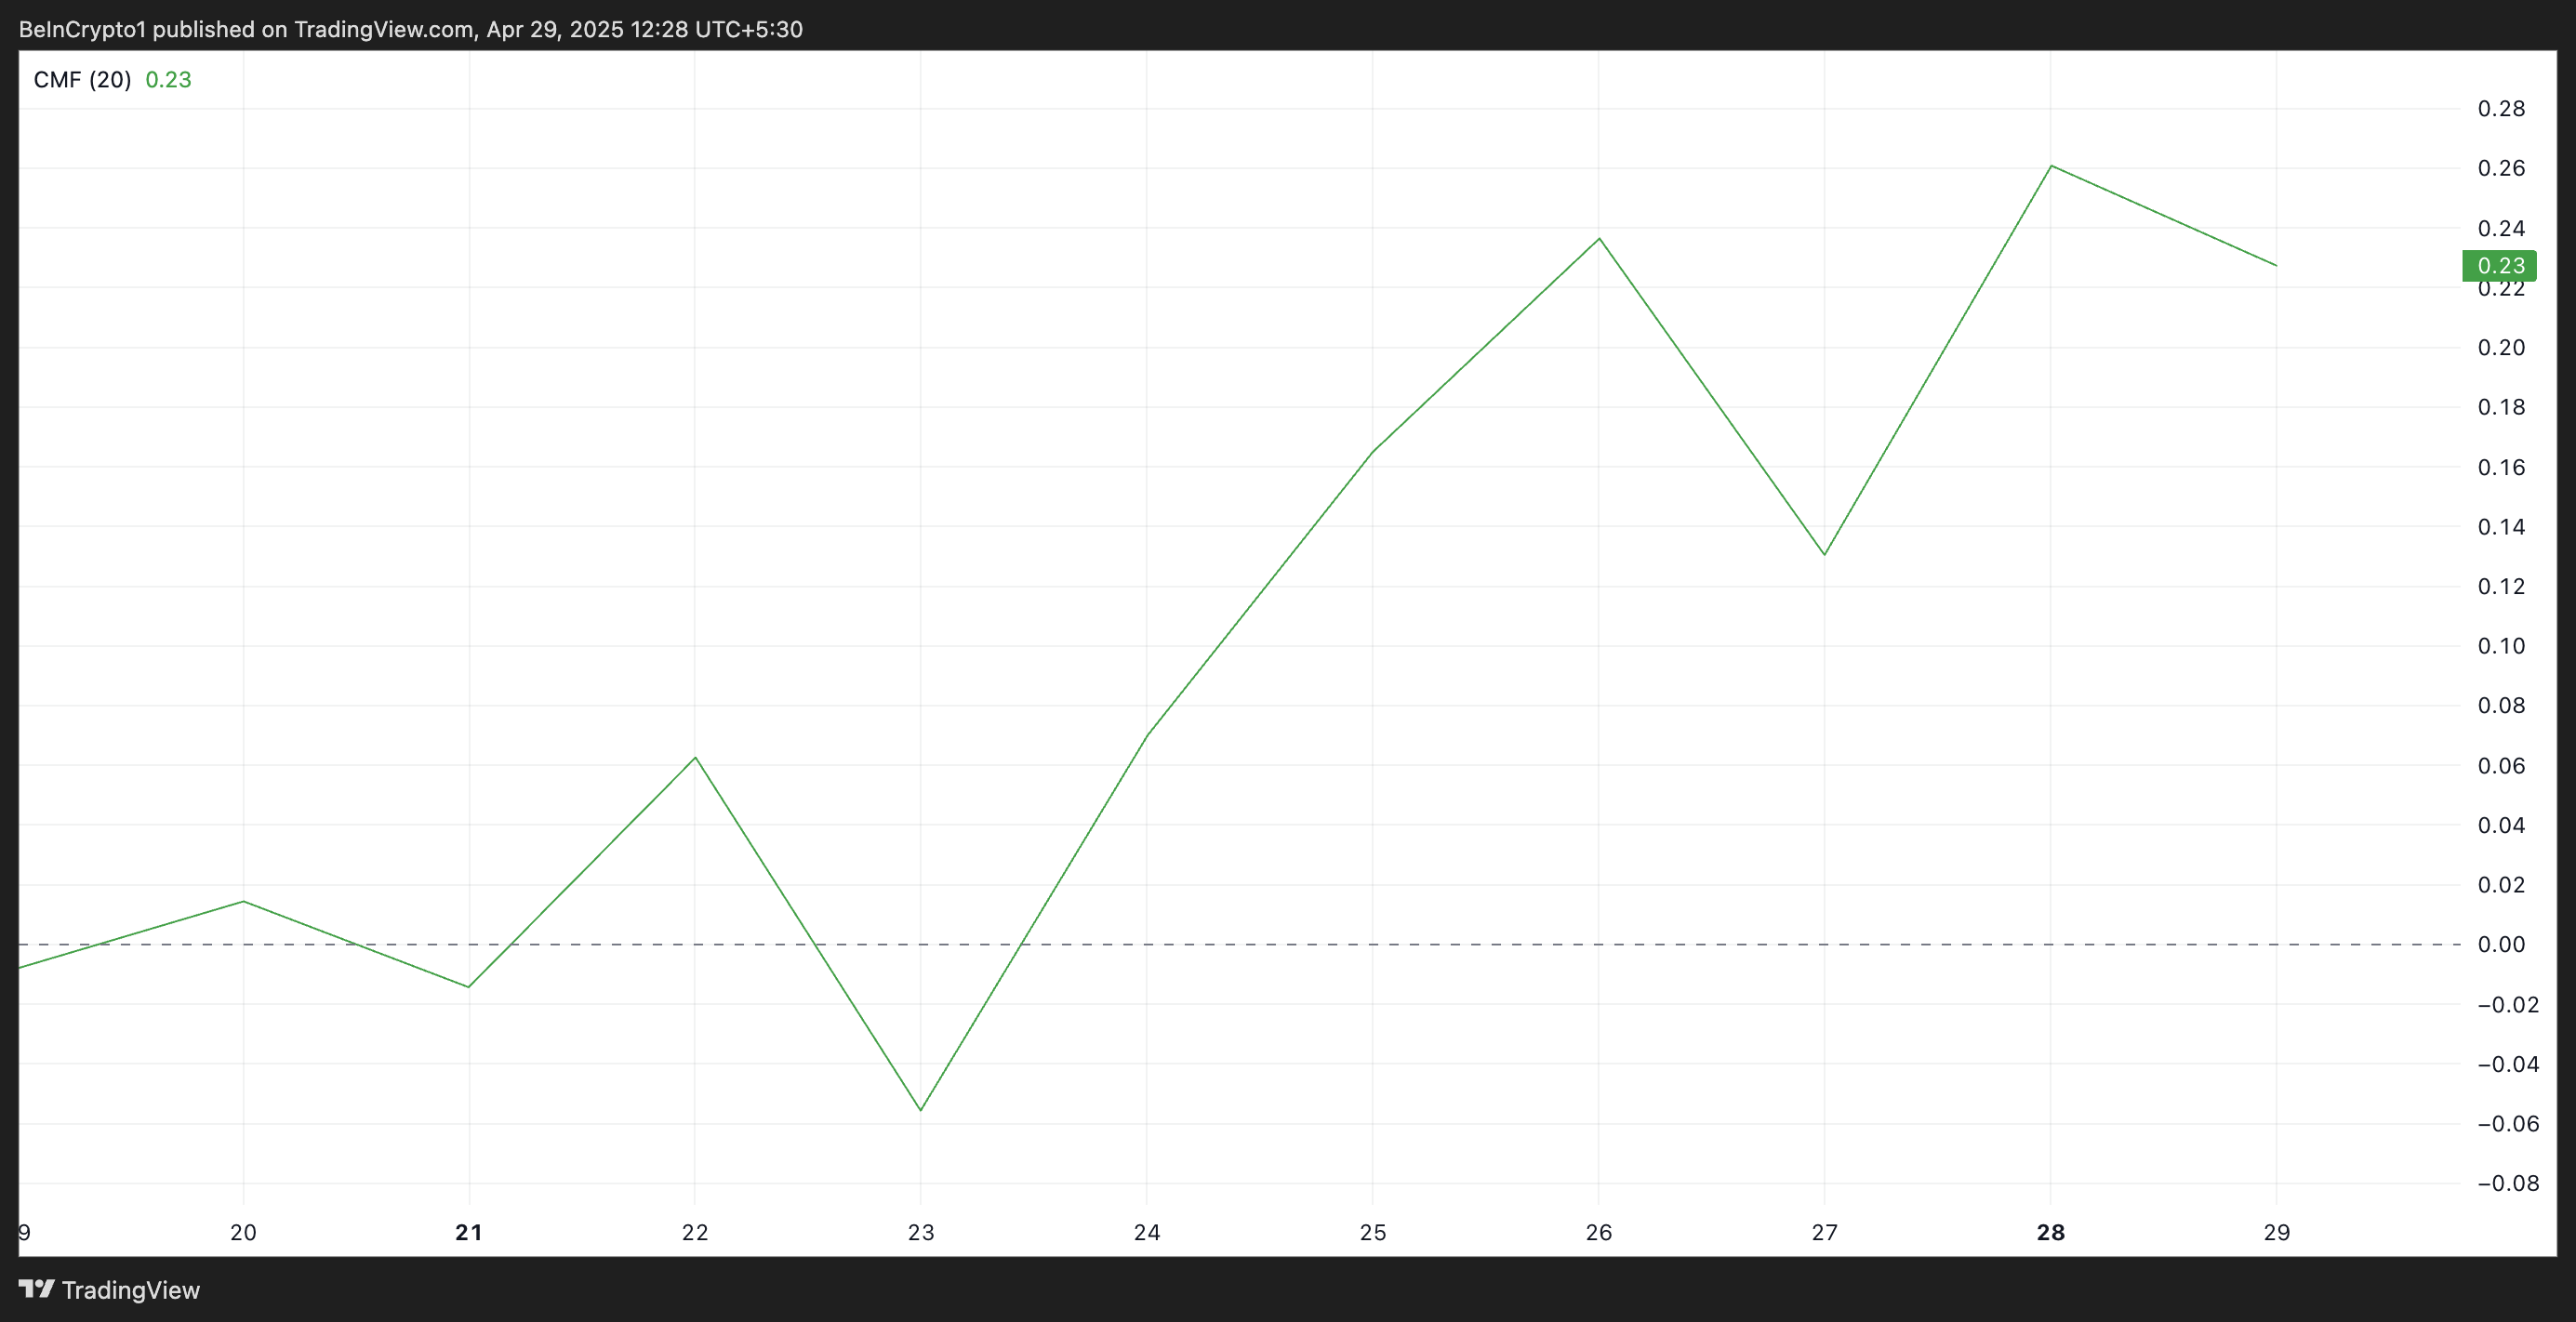
Readings from VIRTUAL’s Chaikin Money Flow (CMF) indicator, which tracks capital accumulation into an asset, confirm the high demand for the altcoin. At press time, this momentum indicator is above the zero line and in an upward trend at 0.23.
When an asset’s CMF is above zero, buying pressure exceeds selling activity among market participants. This trend, coupled with VIRTUAL’s rising price, is a significantly bullish signal, hinting at an extended rally where the token could record new multi-month highs.
Triple-Digit Rally Signals Possible Run to $2.25
VIRTUAL’s triple-digit spike over the past week has pushed its price above the key resistance of $1.44. If demand strengthens and the bulls retain market control, the altcoin could extend its current gains and climb toward $2.25, a high it last reached on January 31.
However, caution may be warranted in the short term. Technical indicators such as the Relative Strength Index (RSI) show that VIRTUAL currently trades in overbought territory. As of this writing, the momentum indicator is 83.92, indicating that the altcoin is significantly overbought and is due for correction.
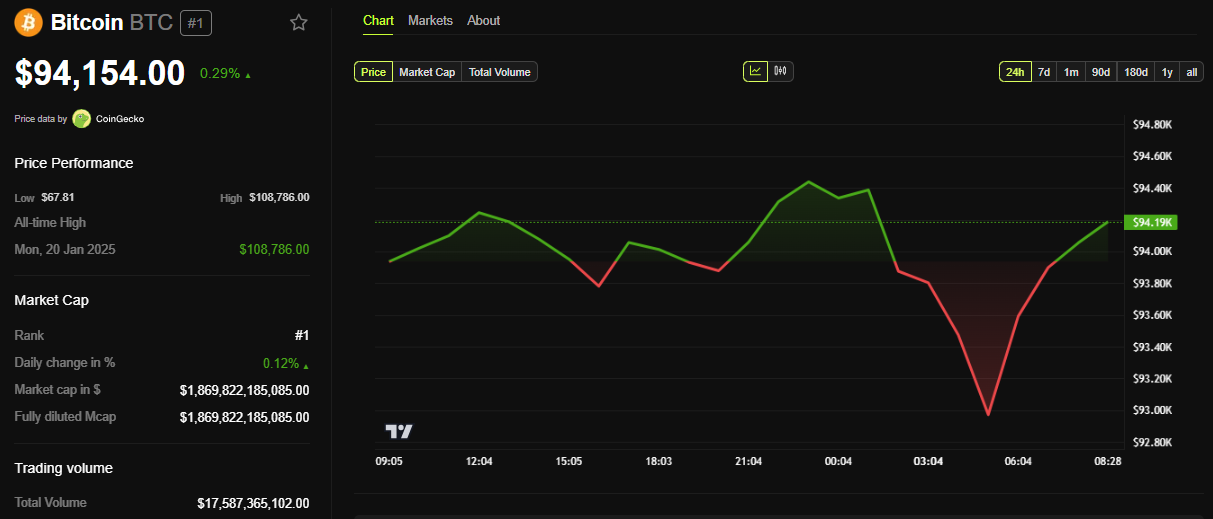
Bitcoin (BTC) is hovering below the $94,000 level while still showing sensitivity to US economic indicators. Accordingly, this week’s US economic data could spark volatility in the crypto market.
From consumer confidence to labor market strength, economic indicators could influence sentiment and sway crypto prices.
US Economic Data To Watch This Week
The following US economic indicators could affect the portfolios of crypto market traders and investors.
“Let me try to help you make sense of everything that’s going on: Tariff madness, plunging consumer confidence, rising recession odds, market fragility and all the ways that the economy will shape your life,” economist Justin Wolfers remarked.
Consumer Confidence
The Consumer Confidence report will start the list of US economic indicators with crypto implications this week. On Tuesday, April’s Conference Board’s Consumer Confidence Index will show whether households are optimistic about financial conditions.
March’s 92.9 index signaled a relatively pessimistic outlook among US consumers concerning the economy and their financial situation.
According to data on MarketWatch, the median forecast is 87.4. Strong confidence often correlates with risk-on sentiment, driving investment into Bitcoin and altcoins.
Accordingly, reading below expectations might trigger profit-taking, denting confidence in the economy’s overall strength.
With global trade tensions, an unexpected decline could amplify safe-haven demand for Bitcoin, though volatility remains a risk.
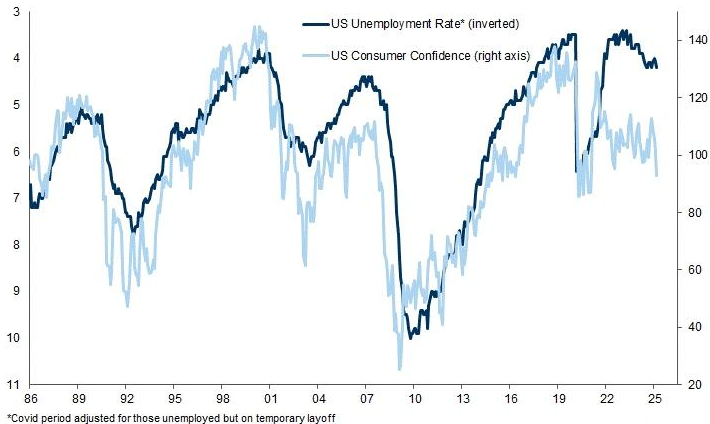
“The soft data suggests that the hard data is set to fall. Consumer Confidence can lead the unemployment rate (inverted). If that ends up being the case this time around, we’re looking at around 6% or higher,” wrote Markets and Mayhem.
JOLTS Job Openings
This week, the Job Openings and Labor Turnover Survey (JOLT), which tracks demand, adds to the list of US economic indicators.
The last JOLTS report was released on April 1, covering February 2025 data. It reported job openings at 7.6 million, hires at 5.4 million, and total separations at 5.3 million. The next JOLTS report, for March 2025, is due on Tuesday, with a median forecast of 7.4 million.
A rebound above 7.6 million for crypto could signal economic resilience, boosting risk assets like Bitcoin. Strong openings suggest hiring confidence, potentially increasing disposable income for crypto investments.
However, a weaker-than-expected figure, potentially below the median forecast of 7.4 million, might stoke recession fears. Such an outcome would drive investors toward Bitcoin as a hedge.
Crypto markets react to labor market signals as they influence Federal Reserve (Fed) policy expectations. With rates at 4.25%–4.5%, a tight labor market could delay cuts, pressuring speculative assets.
ADP Employment
The ADP National Employment Report tracks private-sector job growth and will be out on Wednesday. March 2025’s 155,000 jobs beat expectations, signaling labor market strength despite tariff concerns.
A strong reading above 160,000 for crypto could ignite bullish sentiment, as job growth fuels consumer spending and risk appetite. If employment data suggests economic expansion, Bitcoin could gain more upside potential.
However, a miss below the March reading of 155,000 or below the median forecast of 110,000 might spark fears of a slowdown. This could push investors toward stablecoins or Bitcoin as safe havens.
Unlike the Bureau of Labor Statistics’ Non-farm Payrolls (NFP), ADP’s payroll-based methodology excludes government jobs. This methodology offers a granular view.
With markets eyeing Fed policy, ADP’s outcome will set the tone for Friday’s NFP.
Q1 GDP
The advance estimate for Q1 2025 GDP will be released on Wednesday. This data also measures economic growth.
Q3 2024’s 2.8% annualized rate fell short of expectations, pressured by trade deficits. Meanwhile, Q4 2024’s 2.4% reading came following a downward revision to imports.
Strong GDP growth above 3% in crypto signals economic health, often boosting Bitcoin as investors embrace risk. Nevertheless, crypto markets are sensitive to GDP revisions and influence Fed rate decisions.
With inflation concerns lingering, a strong GDP, higher than Q4’s 2.4%, might reduce rate-cut hopes, pressuring speculative cryptos. Conversely, sluggish growth could spur expectations of monetary easing.
PCE
The Fed’s preferred inflation gauge is the Core PCE (Personal Consumption Expenditures) Price Index. This US economic indicator, covering March, will come out on Wednesday this week after the March 28 data covering February.
After February 2025 saw a 2.5% year-over-year (YoY) PCE index, economists anticipate a modest drop to 2.2% for March, reflecting persistent price pressures.
Nevertheless, a PCE reading below 2.5% for Bitcoin could signal cooling inflation, raising hopes for rate cuts and boosting sentiment toward Bitcoin.
A hotter-than-expected figure above the previous reading of 2.5% might tighten Fed policy expectations. PCE’s exclusion of volatile food and energy prices offers a stable inflation view, making it a key driver of crypto sentiment.
With markets sensitive to monetary policy shifts, traders should monitor services spending, as it reflects consumer resilience. Nevertheless, volatility is likely, as PCE shapes the Fed’s rhetoric.
“March PCE inflation (out on Wed Apr 30) should read 2.1% (rounded). April PCE (out in late May) should read 2.0% (rounded). Tariffs are a boss but this is the Fed’s target measure. It could be time to cut, to be honest, politics aside,” wrote hedge fund manager Ophir Gottlieb.
Initial Jobless Claims
This week, the Initial Jobless Claims, reported every Thursday, adds to the list of US economic indicators. This data measures weekly unemployment filings. Claims are a high-frequency indicator, offering real-time labor market insights, and crypto markets often react swiftly to surprises.
For the week ending April 18, 222,000 claims indicated a steady labor market despite tariff chaos. Accordingly, claims below 222,000 could signal growing employment, fostering risk-on sentiment, and lifting Bitcoin.
However, higher claims above 222,000 could spark concerns of economic softening, driving investors to stablecoins or Bitcoin for safety. With the Fed closely monitoring labor data, an unexpected spike might fuel rate-cut speculation.
Non-farm Payrolls
The Non-farm Payrolls (NFP) report will be released on Friday. March 2025’s 228,000-job gain exceeded expectations, with unemployment at 4.2%.
A strong NFP could drive bullish momentum, as job growth signals consumer spending power. A weak report below the median forecast of 130,000 might trigger recession fears, pushing capital to Bitcoin as a hedge or stablecoins for stability.
NFP’s broad scope, covering 80% of GDP-contributing workers, makes it a market mover. Key interest will also be on wage growth, as 0.3% monthly increases suggest inflation pressures, potentially capping crypto gains.
With markets pricing in Fed policy, surprises could spark sharp volatility.
A new report from Solidus Labs has revealed that 98.6% of tokens issued on Pump.fun, a popular token creation platform on Solana, are considered scams or involved in fraudulent trading.
Additionally, similar issues have been identified on Raydium, a major decentralized exchange (DEX) on Solana.
Report Reveals Massive Scam Rate on Pump.fun
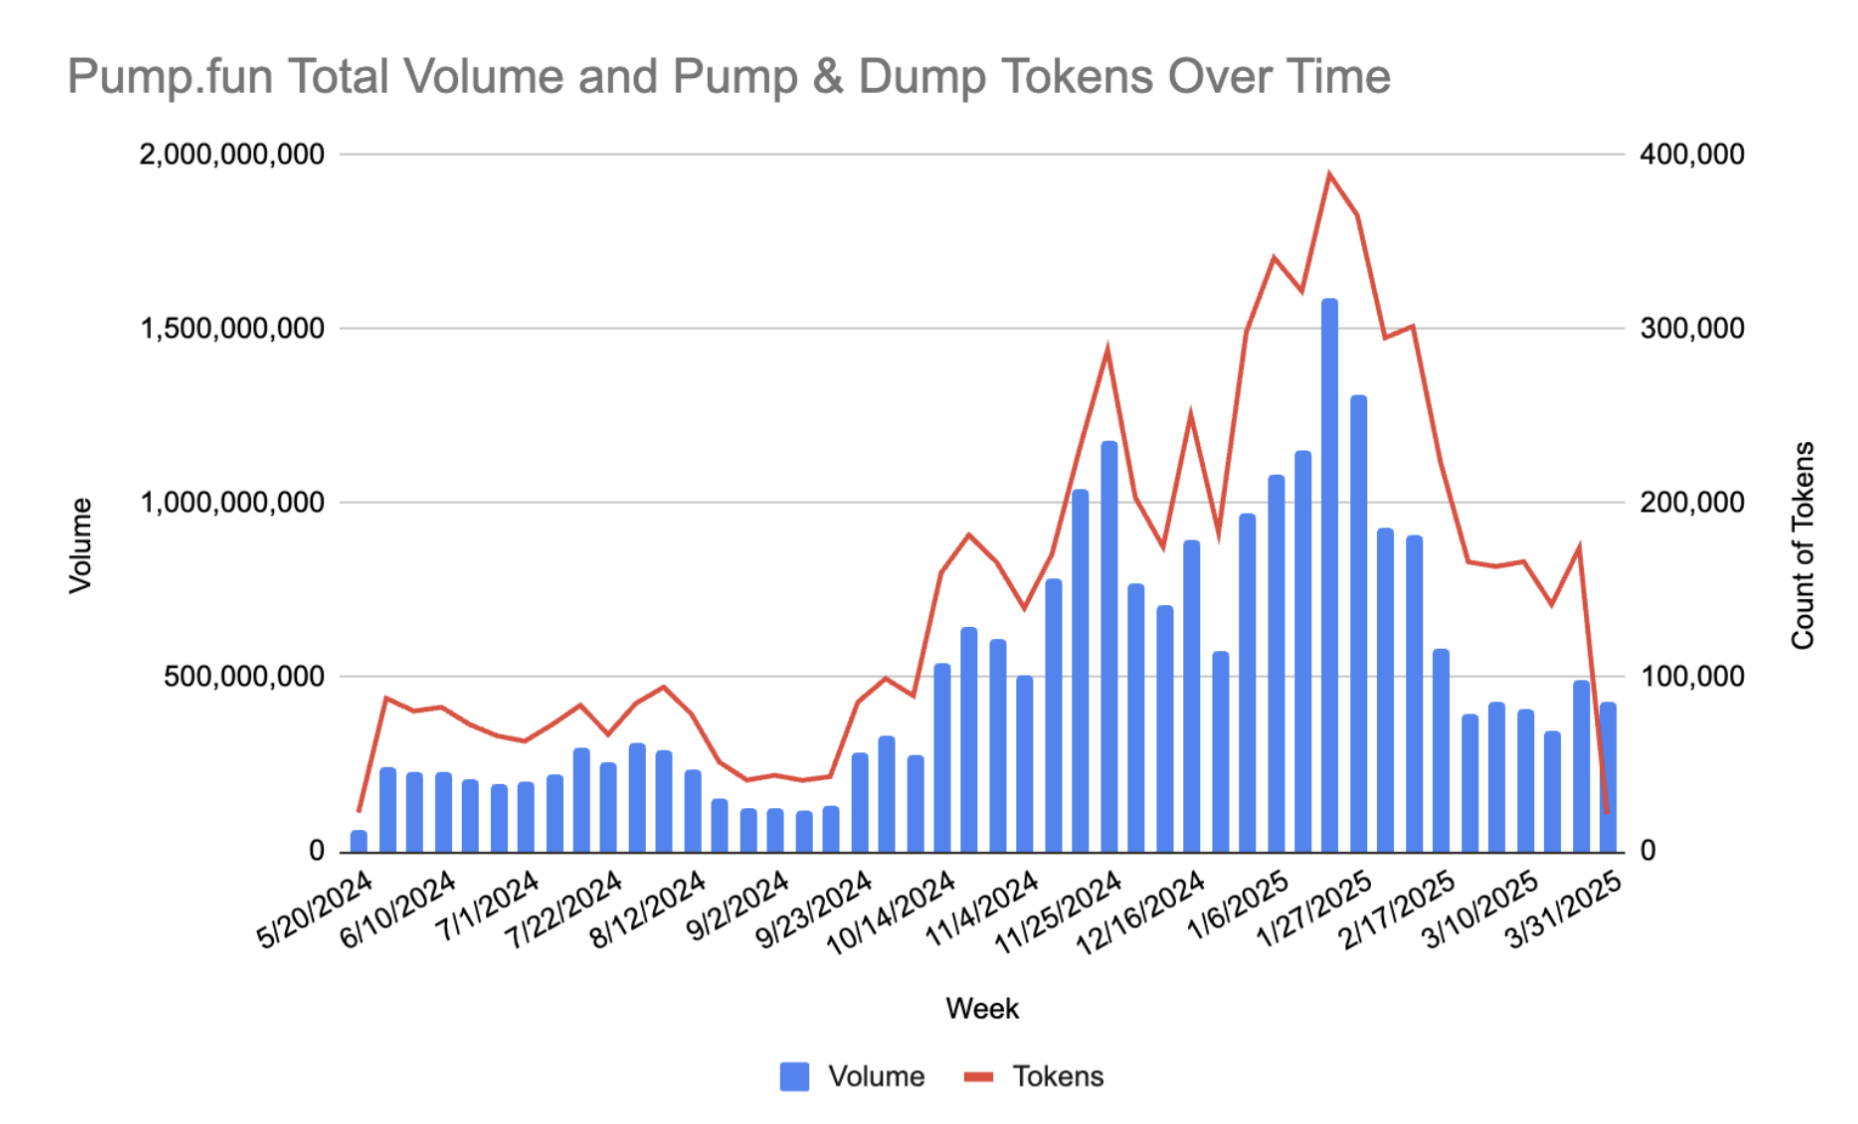
Solidus Labs, a company specializing in blockchain risk monitoring, released a detailed report on the state of certain platforms on the Solana blockchain. According to the report, Pump.fun has issued over 7 million tokens since its launch in January 2024.
However, only 97,000 of these tokens have maintained a liquidity of at least $1,000, which is less than 1.4% of the total tokens.
Pump & Dump tokens on Pump.fun. Source: Solidus Labs
More alarmingly, 98.6% of tokens issued on the platform have been identified as scams or show signs of fraudulent trading. One of the largest scams uncovered by Solidus Labs involved MToken, resulting in losses of up to $1.9 million.
“good (in different ways): railgun, farcaster, polymarket, signal. bad (in different ways): pump.fun, Terra/Luna, FTX. The differences in what the app does stem from differences in beliefs in developers’ heads about what they are here to accomplish,” shared Buterin
93% of Liquidity Pools on Raydium Show Signs of “Soft Rug Pull”
About 25% of these scams involved amounts less than $732. However, the median rug pull involved about $2,832, while the largest detected rug pull totaled $1.9 million.
Though the amounts look relatively small compared to multi-million-dollar scams, the sheer number of affected pools shows the prevalence of this issue.
A common thread between the two platforms is that both are built on the Solana blockchain. Solana is known for its high transaction speeds, processing thousands of transactions per second, and low costs, averaging just $0.00025 per transaction. Because of its technical advantages, Solana has become a prime target for criminals and scammers.
Despite these challenges, Solana remains a promising blockchain with many legitimate and interesting projects. Platforms like Raydium are vital in Solana’s DeFi ecosystem, with monthly trading volumes reaching billions of dollars.