With Bitcoin (BTC) approaching $95K after a 10% rally in two days, hopes of a sustained uptrend have caused investors to speculate on an alt season for the crypto market. If true, as one analyst explains, this could result in a perfect storm that propels altcoins higher.
Pundit Explains When Altcoin Will Explode as Bitcoin Approaches $95K
One analyst, Dom’s Market Flow, noted what needs to happen for cryptocurrencies to explode. Bitcoin’s ascent from low-$80K to $95K in just two days has caused investors to speculate decoupling from the US stock market amid Trump’s tariff tensions. With the crypto market showing signs of optimism, the next logical step is for altcoins to explode. But will this outcome occur?
Bitcoin Needs to Cool for Altcoins to Explode
Dom’s Market Flow added that for altcoins to go higher, Bitcoin needs to slip into a rangebound or retrace slowly. This move will allow capital and profits to flow into other cryptocurrencies, kickstarting a bull run.
“As for alts, we need to see a cool off on $BTC dominance. As we speak, it is trying to break the local uptrend since April. This would allow alts to catch up.”
According to analyst a coll-off on Bitcoin dominance will triggers this alt season.
When Will Altseason Begin?
Based on the altcoin market, the recent crash in Bitcoin below $80K caused a death cross between the 50-day and 200-day Simple Moving Averages. While a golden cross hasn’t been spotted yet, the altcoin market cap has recovered above the 50-day SMA, suggesting the start of an uptrend.
Altcoin Market Capitalization
CoinGlass’ alt season index hovers around 18, which shows that Bitcoin dominance is too high. This takes us back to the analyst’s quote about how BTC rally needs to cool off and so does BTC dominance for altcoins to start rallying.
Altseason Index
To conclude, investors must note that there is still time for altcoins to rally. The recent uptick is just the start of the uptrend due Bitcoin’s front-running. Hence, patient investors who accumulated or accumulate now could stand to gain a lot if patient.
In the final week of July, the total open interest in the crypto derivatives market remains historically high, exceeding $200 billion. Any significant price movement now could trigger massive losses for both long and short positions.
However, a few altcoins are showing signs of potential large-scale liquidations this week. Let’s take a closer look at which ones.
1. Ethereum
Ethereum has been surrounded by positive news about institutional accumulation in recent months. At times, its inflows even outperformed those of Bitcoin ETFs. More recently, SharpLink Gaming acquired 77,206 ETH worth $296 million last week, raising its total holdings to 438,000 ETH.
These bullish developments pushed ETH close to the $4,000 mark in the last week of July. Many analysts expect ETH to hit $4,000 soon—or even surpass it. But this level also acts as a strong psychological resistance, where profit-taking could emerge at any moment.
“A key resistance level ahead for Ethereum $ETH is $3,980. Breaking above it could ignite a major bull rally!” crypto analyst Ali Martinez commented.
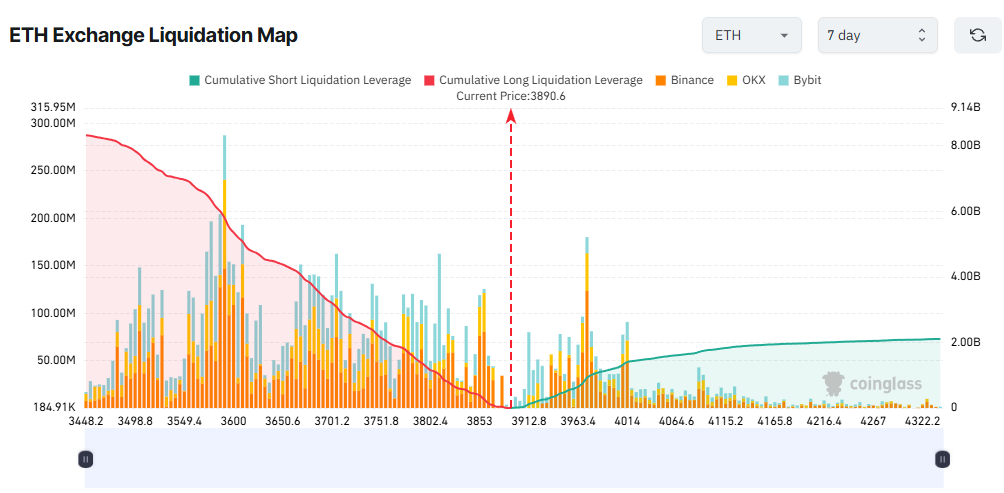
Regardless of direction, the liquidation map shows that potential liquidations could reach billions of dollars if ETH moves significantly.
According to Coinglass data, if ETH breaks above $4,000, total accumulated short liquidations could reach $1.2 billion. On the other hand, if ETH faces strong profit-taking and drops to $3,500, long liquidations could soar to $7.8 billion.
The map also reveals an imbalance between longs and shorts, indicating that many traders are betting more money and leverage on a downward correction.
2. Solana
Although Solana still needs to rise over 50% to revisit its early-year high of nearly $300, its open interest has already exceeded $11 billion. That’s over 25% higher than when SOL peaked in January.
This suggests that traders are more exposed to Solana now than in the past. However, most of this exposure comes from derivatives rather than spot trading.
CoinMarketCap data shows that SOL’s current daily spot trading volume is just over $6 billion. That’s far below the tens of billions seen in January.
This wide gap between derivatives and spot volume reflects that Solana traders are leaning toward short-term bets. As a result, the token is prone to sharp swings and potential liquidations.
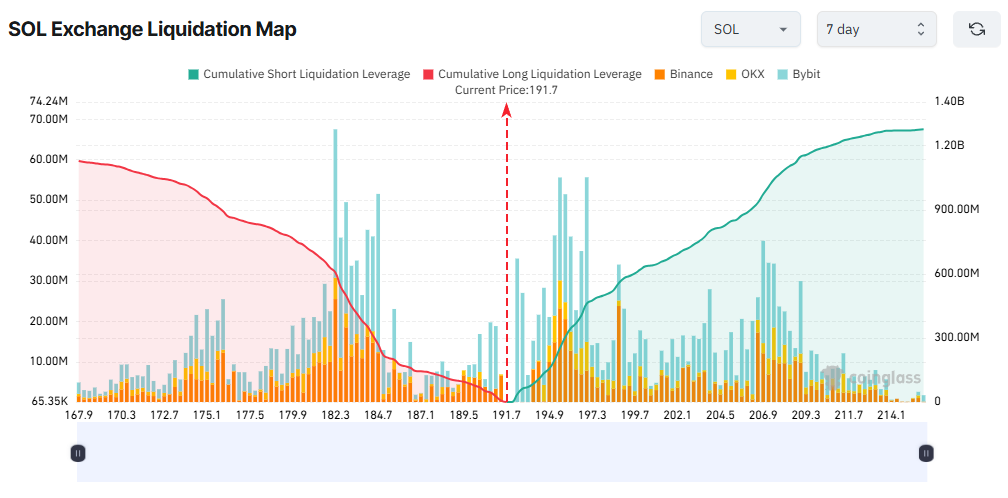
The liquidation map shows a balance between long and short positions. With SOL trading around $191, a move above $200 could trigger more than $600 million in liquidations. Conversely, a drop to $181 could liquidate over $700 million in long positions.
3. BNB
Entering the last week of July, BNB hit a new all-time high of $859. This rally was fueled by growing activity on BNB Chain and increased interest from companies in the BNB treasury.
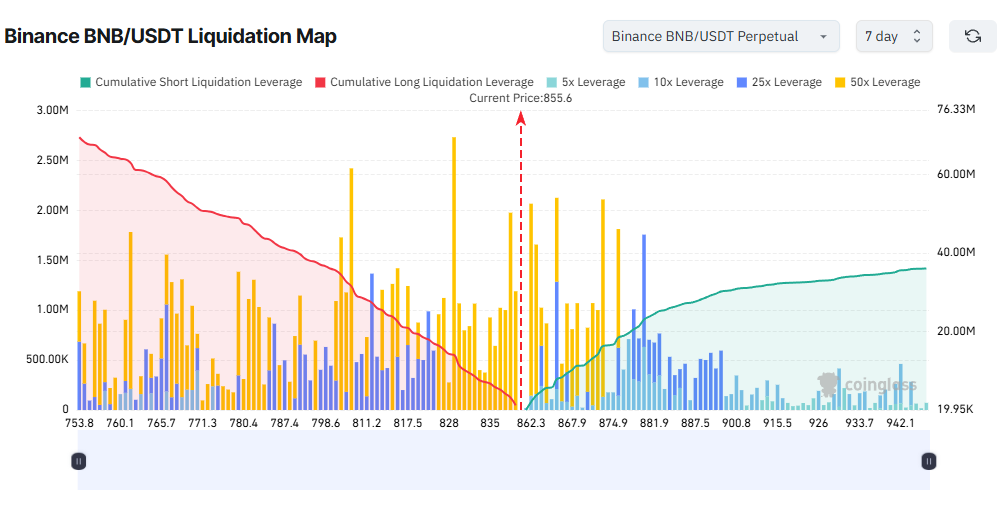
While BNB hasn’t shown signs of a pullback yet, the BNB/USDT liquidation map on Binance reveals heavy leverage—up to 50x.
The map is almost entirely covered in yellow (indicating 50x leverage), especially around the $753 to $875 range.
On Binance alone, total long liquidations outweigh shorts. If BNB surpasses $875, short positions worth $18.5 million could be liquidated. On the other hand, if BNB drops below the psychological $800 mark, more than $36 million in long positions would be wiped out.
Ignoring short-term noise, many analysts believe BNB could soon reach $1,000. However, some offer a more detailed view, suggesting that the price might first fall below $800 before resuming its uptrend.
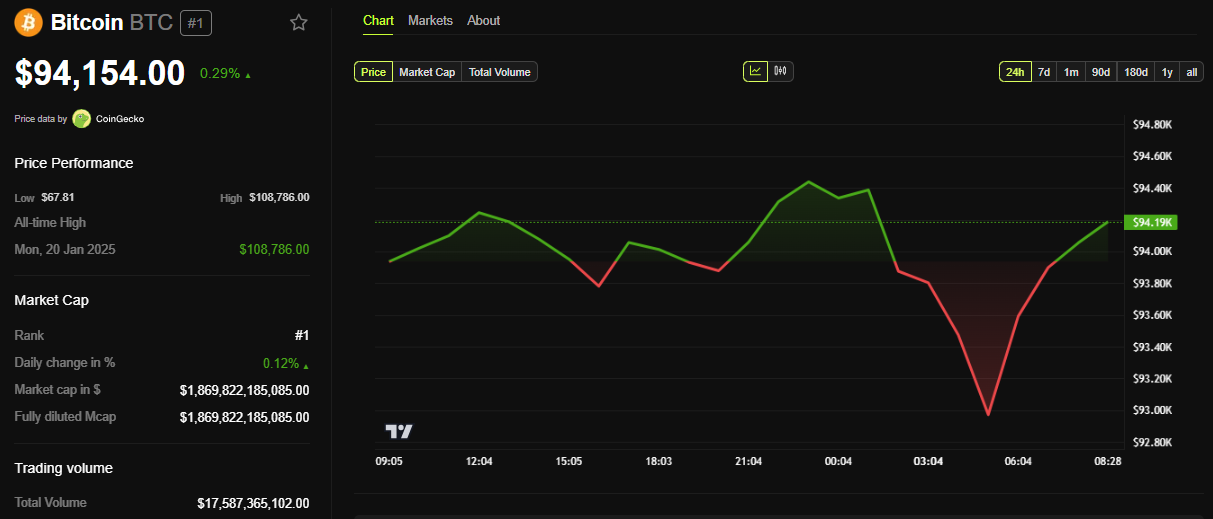
Bitcoin (BTC) is hovering below the $94,000 level while still showing sensitivity to US economic indicators. Accordingly, this week’s US economic data could spark volatility in the crypto market.
From consumer confidence to labor market strength, economic indicators could influence sentiment and sway crypto prices.
US Economic Data To Watch This Week
The following US economic indicators could affect the portfolios of crypto market traders and investors.
“Let me try to help you make sense of everything that’s going on: Tariff madness, plunging consumer confidence, rising recession odds, market fragility and all the ways that the economy will shape your life,” economist Justin Wolfers remarked.
Consumer Confidence
The Consumer Confidence report will start the list of US economic indicators with crypto implications this week. On Tuesday, April’s Conference Board’s Consumer Confidence Index will show whether households are optimistic about financial conditions.
March’s 92.9 index signaled a relatively pessimistic outlook among US consumers concerning the economy and their financial situation.
According to data on MarketWatch, the median forecast is 87.4. Strong confidence often correlates with risk-on sentiment, driving investment into Bitcoin and altcoins.
Accordingly, reading below expectations might trigger profit-taking, denting confidence in the economy’s overall strength.
With global trade tensions, an unexpected decline could amplify safe-haven demand for Bitcoin, though volatility remains a risk.
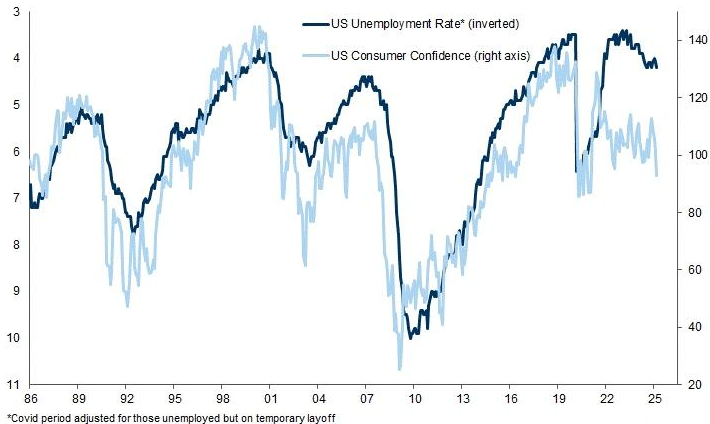
“The soft data suggests that the hard data is set to fall. Consumer Confidence can lead the unemployment rate (inverted). If that ends up being the case this time around, we’re looking at around 6% or higher,” wrote Markets and Mayhem.
JOLTS Job Openings
This week, the Job Openings and Labor Turnover Survey (JOLT), which tracks demand, adds to the list of US economic indicators.
The last JOLTS report was released on April 1, covering February 2025 data. It reported job openings at 7.6 million, hires at 5.4 million, and total separations at 5.3 million. The next JOLTS report, for March 2025, is due on Tuesday, with a median forecast of 7.4 million.
A rebound above 7.6 million for crypto could signal economic resilience, boosting risk assets like Bitcoin. Strong openings suggest hiring confidence, potentially increasing disposable income for crypto investments.
However, a weaker-than-expected figure, potentially below the median forecast of 7.4 million, might stoke recession fears. Such an outcome would drive investors toward Bitcoin as a hedge.
Crypto markets react to labor market signals as they influence Federal Reserve (Fed) policy expectations. With rates at 4.25%–4.5%, a tight labor market could delay cuts, pressuring speculative assets.
ADP Employment
The ADP National Employment Report tracks private-sector job growth and will be out on Wednesday. March 2025’s 155,000 jobs beat expectations, signaling labor market strength despite tariff concerns.
A strong reading above 160,000 for crypto could ignite bullish sentiment, as job growth fuels consumer spending and risk appetite. If employment data suggests economic expansion, Bitcoin could gain more upside potential.
However, a miss below the March reading of 155,000 or below the median forecast of 110,000 might spark fears of a slowdown. This could push investors toward stablecoins or Bitcoin as safe havens.
Unlike the Bureau of Labor Statistics’ Non-farm Payrolls (NFP), ADP’s payroll-based methodology excludes government jobs. This methodology offers a granular view.
With markets eyeing Fed policy, ADP’s outcome will set the tone for Friday’s NFP.
Q1 GDP
The advance estimate for Q1 2025 GDP will be released on Wednesday. This data also measures economic growth.
Q3 2024’s 2.8% annualized rate fell short of expectations, pressured by trade deficits. Meanwhile, Q4 2024’s 2.4% reading came following a downward revision to imports.
Strong GDP growth above 3% in crypto signals economic health, often boosting Bitcoin as investors embrace risk. Nevertheless, crypto markets are sensitive to GDP revisions and influence Fed rate decisions.
With inflation concerns lingering, a strong GDP, higher than Q4’s 2.4%, might reduce rate-cut hopes, pressuring speculative cryptos. Conversely, sluggish growth could spur expectations of monetary easing.
PCE
The Fed’s preferred inflation gauge is the Core PCE (Personal Consumption Expenditures) Price Index. This US economic indicator, covering March, will come out on Wednesday this week after the March 28 data covering February.
After February 2025 saw a 2.5% year-over-year (YoY) PCE index, economists anticipate a modest drop to 2.2% for March, reflecting persistent price pressures.
Nevertheless, a PCE reading below 2.5% for Bitcoin could signal cooling inflation, raising hopes for rate cuts and boosting sentiment toward Bitcoin.
A hotter-than-expected figure above the previous reading of 2.5% might tighten Fed policy expectations. PCE’s exclusion of volatile food and energy prices offers a stable inflation view, making it a key driver of crypto sentiment.
With markets sensitive to monetary policy shifts, traders should monitor services spending, as it reflects consumer resilience. Nevertheless, volatility is likely, as PCE shapes the Fed’s rhetoric.
“March PCE inflation (out on Wed Apr 30) should read 2.1% (rounded). April PCE (out in late May) should read 2.0% (rounded). Tariffs are a boss but this is the Fed’s target measure. It could be time to cut, to be honest, politics aside,” wrote hedge fund manager Ophir Gottlieb.
Initial Jobless Claims
This week, the Initial Jobless Claims, reported every Thursday, adds to the list of US economic indicators. This data measures weekly unemployment filings. Claims are a high-frequency indicator, offering real-time labor market insights, and crypto markets often react swiftly to surprises.
For the week ending April 18, 222,000 claims indicated a steady labor market despite tariff chaos. Accordingly, claims below 222,000 could signal growing employment, fostering risk-on sentiment, and lifting Bitcoin.
However, higher claims above 222,000 could spark concerns of economic softening, driving investors to stablecoins or Bitcoin for safety. With the Fed closely monitoring labor data, an unexpected spike might fuel rate-cut speculation.
Non-farm Payrolls
The Non-farm Payrolls (NFP) report will be released on Friday. March 2025’s 228,000-job gain exceeded expectations, with unemployment at 4.2%.
A strong NFP could drive bullish momentum, as job growth signals consumer spending power. A weak report below the median forecast of 130,000 might trigger recession fears, pushing capital to Bitcoin as a hedge or stablecoins for stability.
NFP’s broad scope, covering 80% of GDP-contributing workers, makes it a market mover. Key interest will also be on wage growth, as 0.3% monthly increases suggest inflation pressures, potentially capping crypto gains.
With markets pricing in Fed policy, surprises could spark sharp volatility.
Bitcoin may face three potential trend scenarios in the future, with the most optimistic one forecasting a surge to $150,000 to $175,000 within the next 12 months.
This prediction is supported by factors such as a strong influx of institutional capital and positive investor sentiment following the Trump administration’s plans to establish a national Bitcoin reserve.
Positive Forecasts from Experts and Market Signals
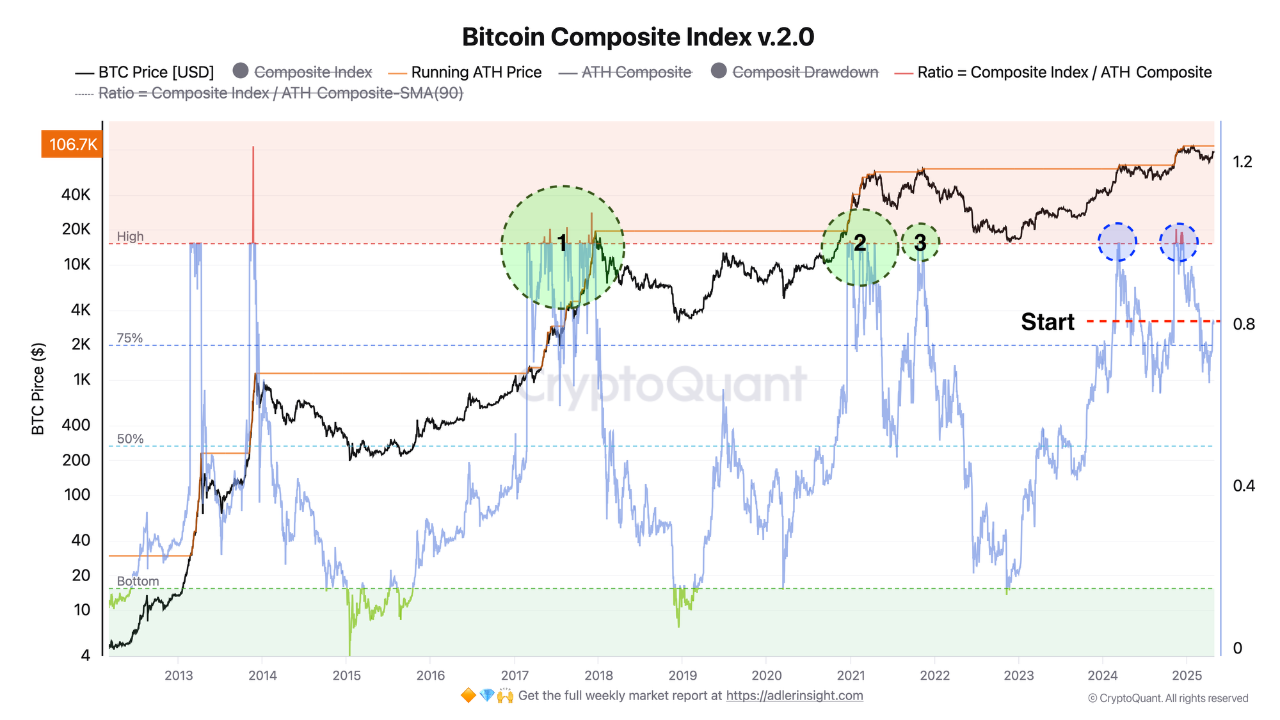
The Bitcoin Composite Index currently stands at ≈ 0.8 (80%). Based on this indicator, AxelAdlerJr outlined three possible scenarios.
In the most optimistic scenario, BTC’s price could reach $150,000 to $175,000, following the cyclical logic of 2017 and 2021. This would occur if the Bitcoin Composite Index surpasses 1.0 and remains above that level.
If the ratio stays within the 0.8–1.0 range, the market would likely consolidate in a broad corridor between $90,000 and $110,000, indicating that participants are maintaining positions without increasing exposure.
Alternatively, if the ratio drops to 0.75 or below, short-term holders may start taking profits, potentially leading to a price correction to $70,000–$85,000. However, AxelAdlerJr notes that this scenario is less likely than the other two.
The return of YoY True MVRV to positive territory means that the average purchase price of all coins acquired over the past year is now below the current market price. The pressure from panic sellers is decreasing – many are now in profit and don’t need to lock in losses. Holder… pic.twitter.com/6AgvVVTn9h
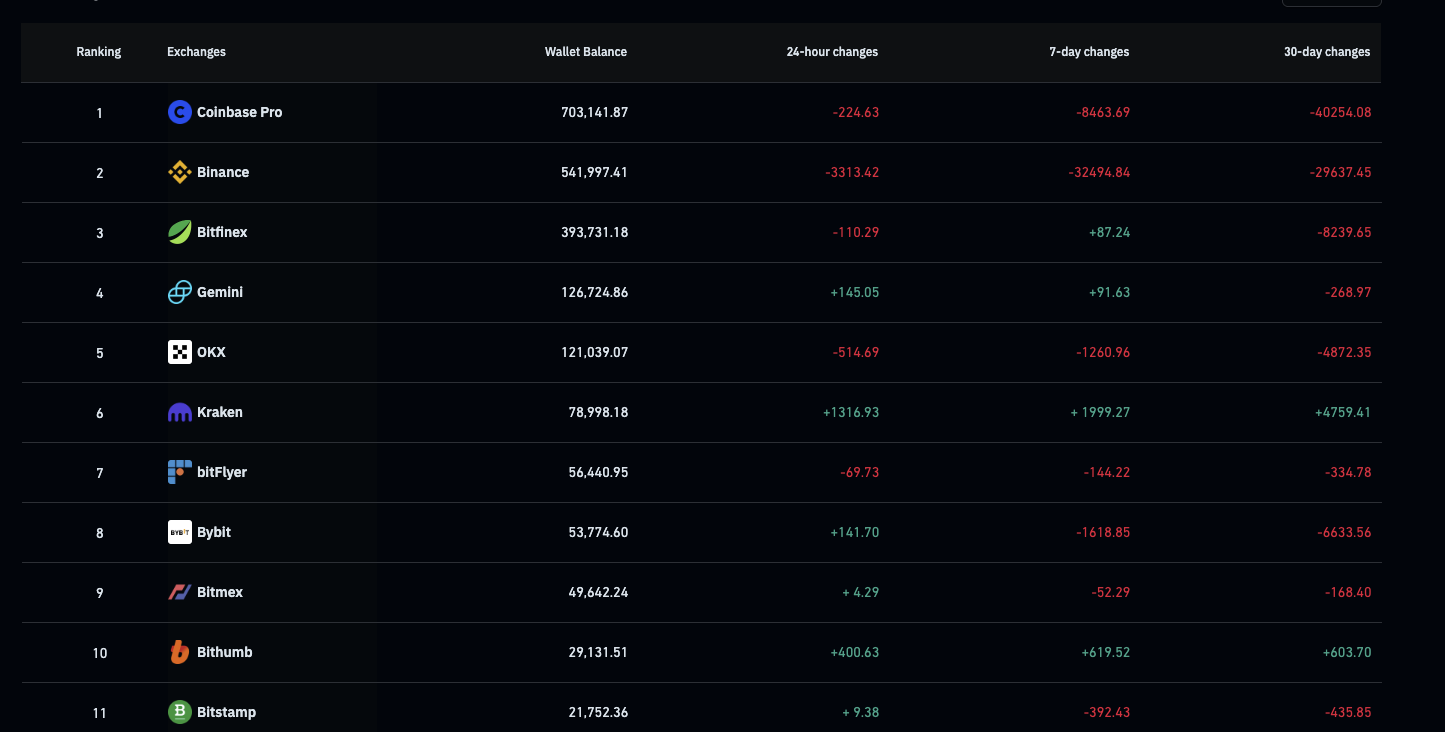
On-chain signals further bolster the bullish outlook. According to Coinglass, over the past 7 days, approximately 42,525.89 Bitcoins were withdrawn from centralized exchanges (CEX), reducing the supply on exchanges to a 7-year low of about 2.48 million BTC.
The trend of Bitcoin withdrawals from exchanges is often seen as a positive sign, as it indicates investor accumulation and reduced selling pressure, paving the way for price growth.
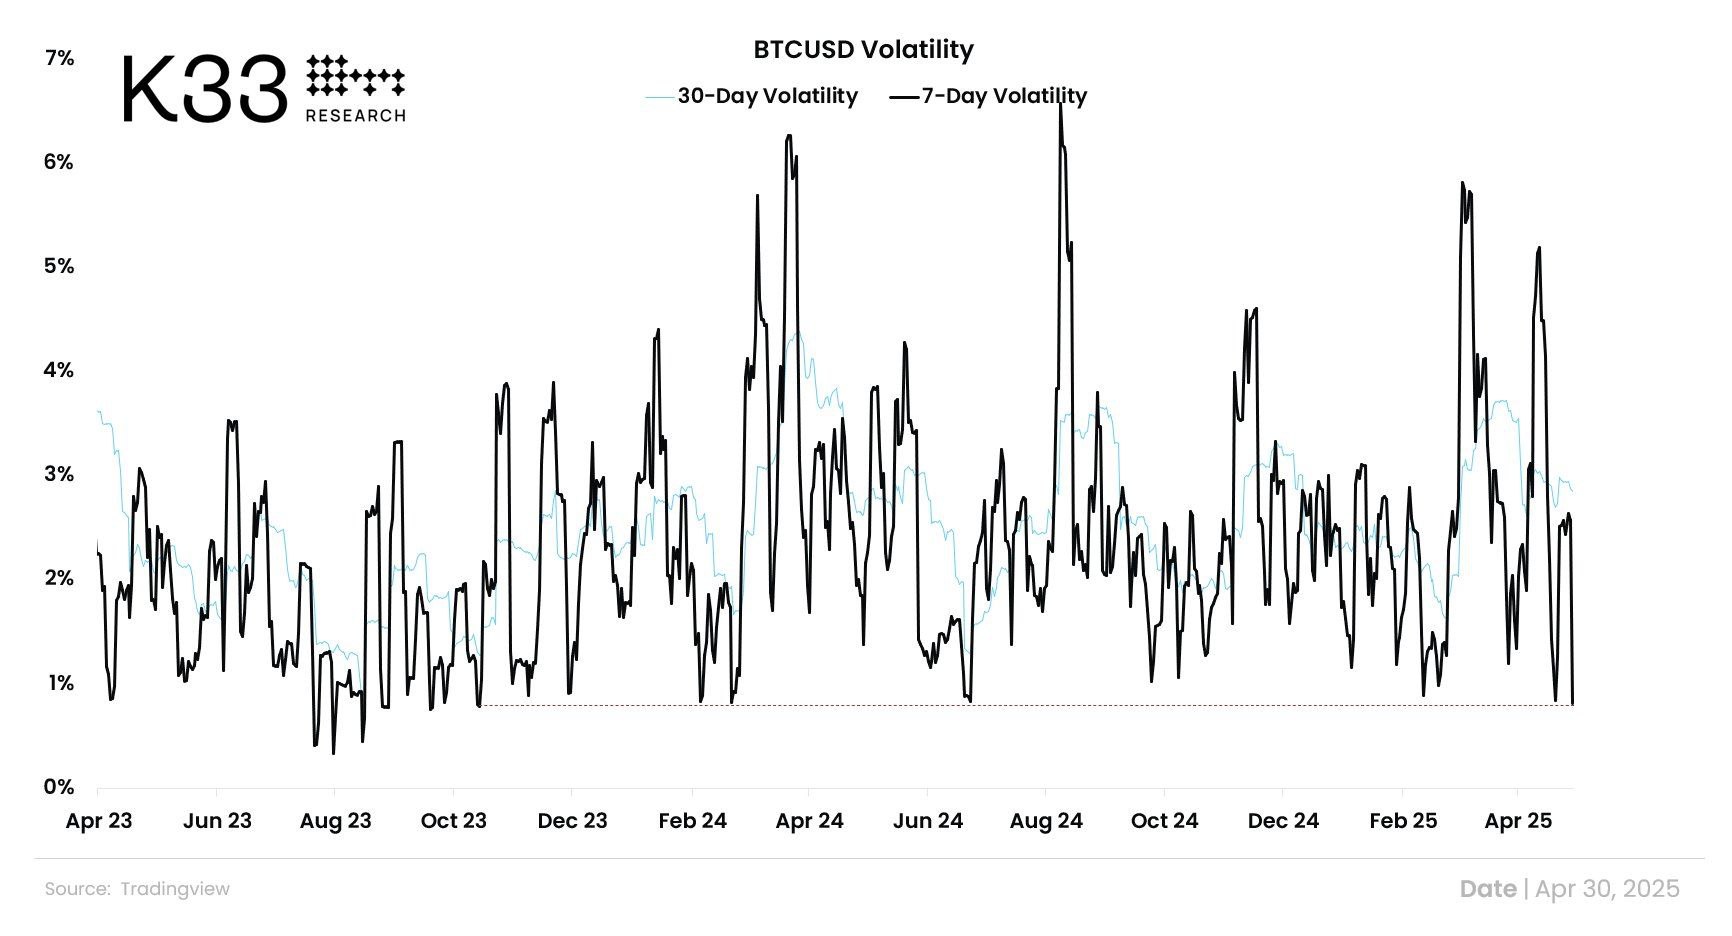
Bitcoin’s 7-day volatility has also hit its lowest level in 563 days. Low volatility typically signals a period of accumulation before a price breakout, as observed during past major rallies, such as in 2020 before Bitcoin peaked at $69,000.
Technical analysis also supports Bitcoin’s bullish scenario. According to a post on X by Ali, Bitcoin’s key support levels are at $93,198 and $83,444, indicating strong consolidation above these thresholds.
If Bitcoin sustains above $93,198, the likelihood of continuing its upward trend to reach the $150,000 target becomes highly feasible.
“The most critical support levels for #Bitcoin $BTC are $93,198 and $83,444. Key zones to watch if momentum shifts,” Ali shared.
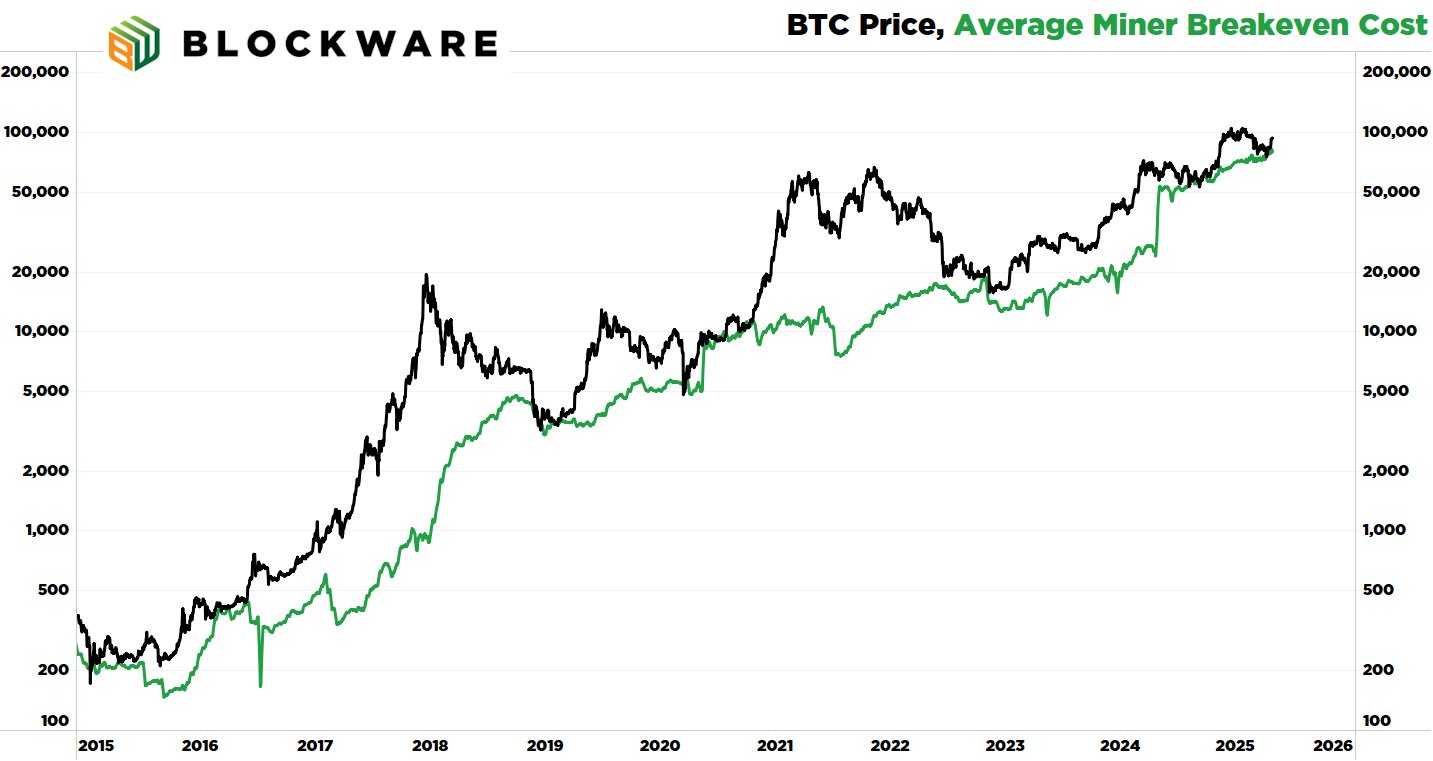
Moreover, Breedlove22, a well-known analyst, shared on X about three indicators signaling optimism for Bitcoin. The first is the Average Miner Cost of Production. According to Breedlove22, this metric is at a bottom, suggesting a significant bull market may be on the horizon.
Average Miner Cost of Production. Source: Breedlove22
The second indicator is the supply held by long-term holders, which measures Bitcoin unmoved on-chain for at least 155 days. Breedlove22 noted that over the past 30 days, long-term holders have acquired an additional ~150,000 BTC.
“Bitcoin is running out of sellers in the $80,000 to $100,000 range,” Breedlove22 stated.
Lastly, and most importantly, is USD liquidity, which effectively represents the “demand” side of the equation. More dollars in the system mean more potential bidders.
“And it’s not just USD liquidity that’s increasing – liquidity of all fiat currencies is on the rise, and Bitcoin is a global asset,” Breedlove22 added.
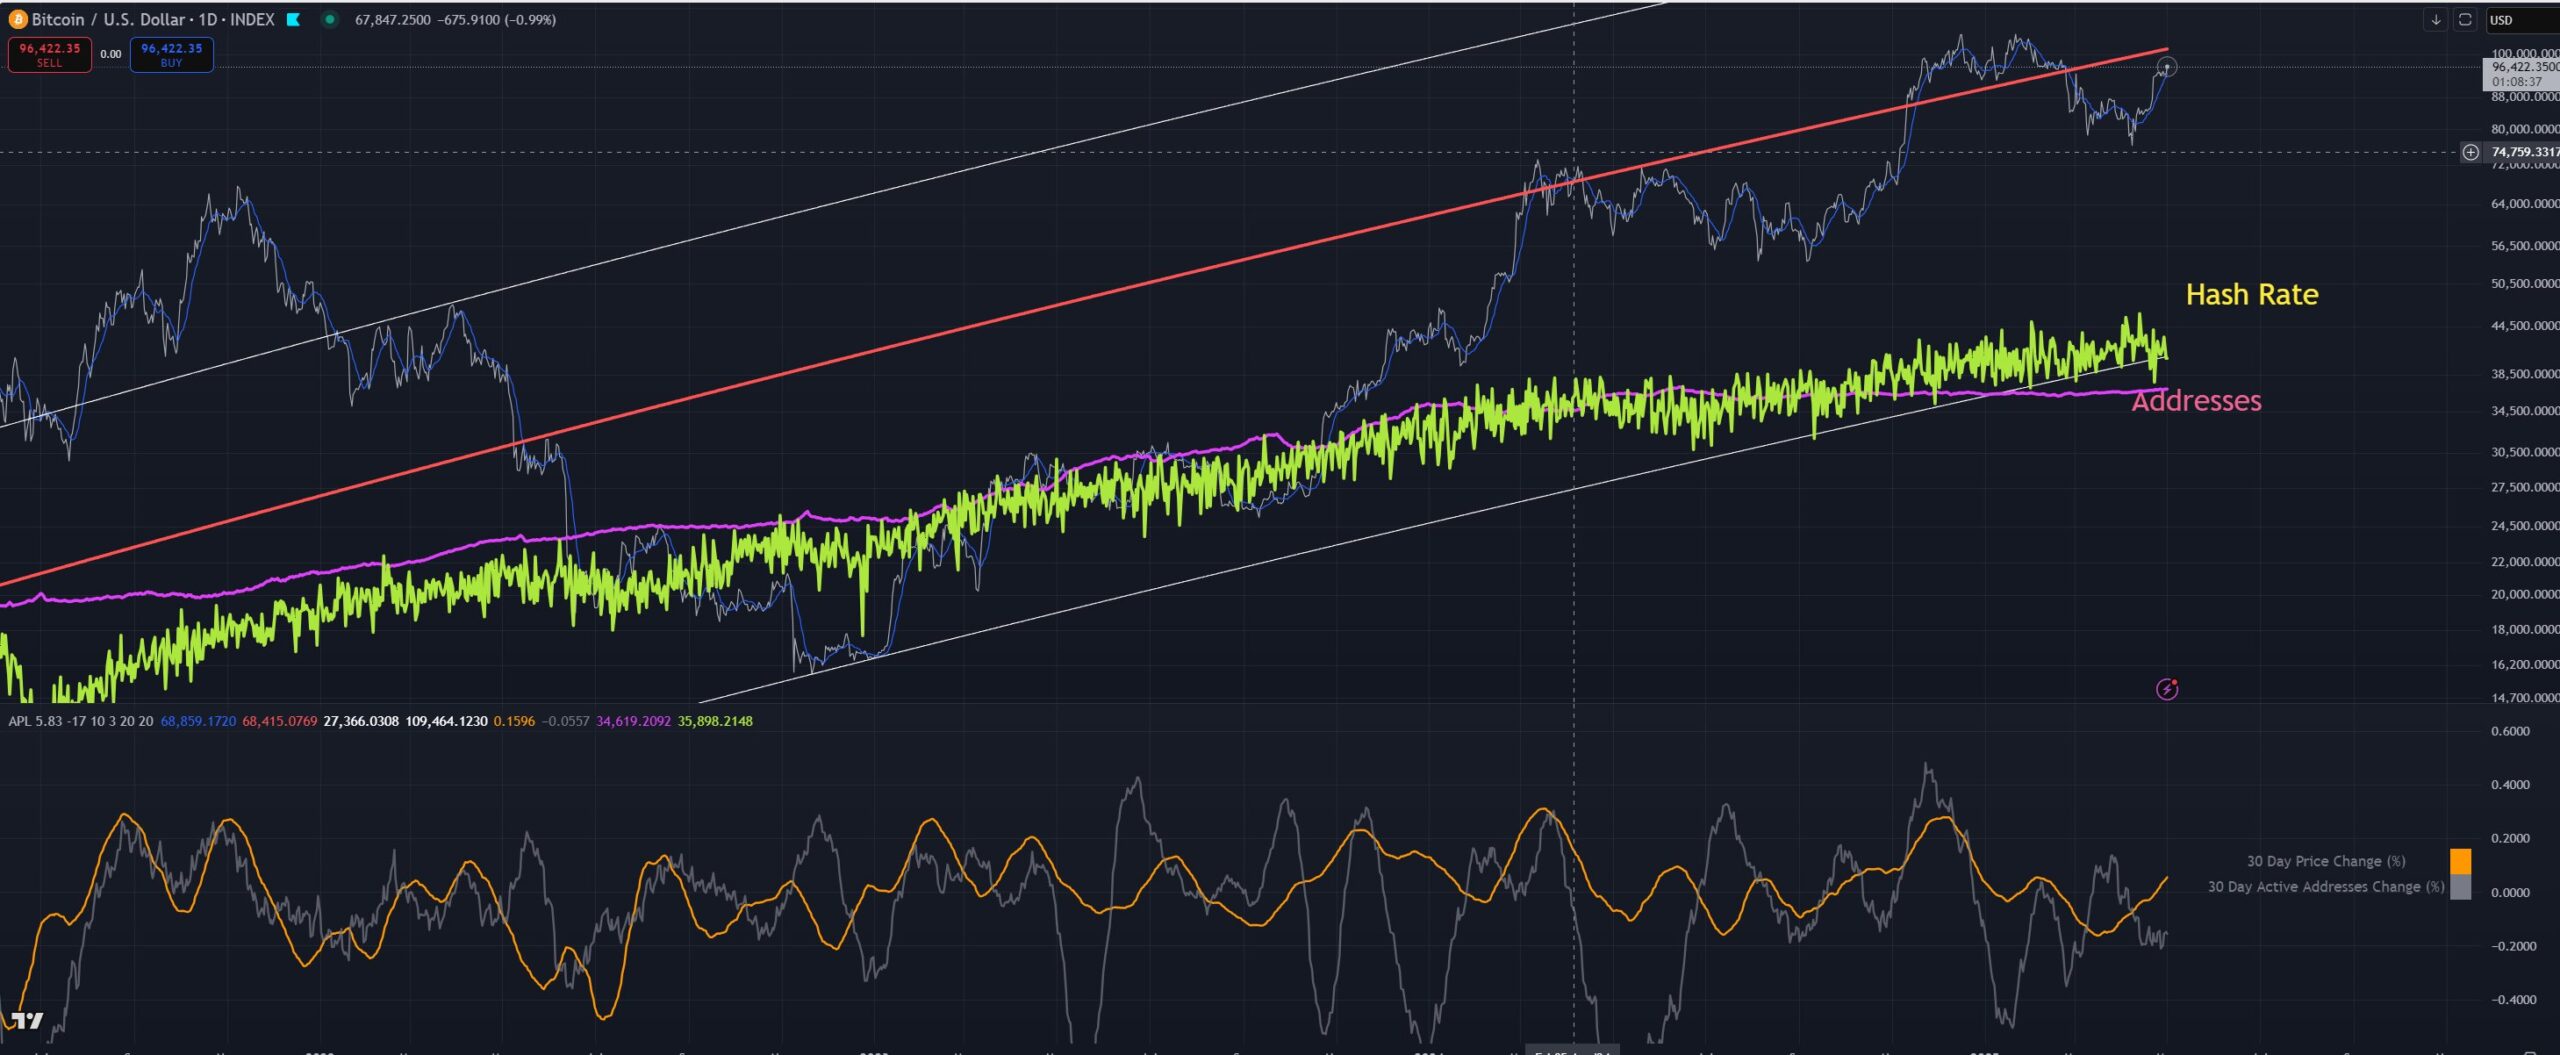
Echoing Breedlove22’s perspective, another X user shared that BTC’s valuation based on hash rate is at a support level, suggesting that a local bottom may have been reached.
In the optimistic scenario, Bitcoin is poised for a significant opportunity to reach $150,000 to $175,000. However, investors should also prepare for risks such as short-term price corrections.
With strong support levels at $93,198 and $83,444, Bitcoin has a solid foundation for continued growth, but caution remains essential.


 Adler Jr (@AxelAdlerJr)