After months of decline, Solana meme coins are regaining bullish momentum. Daily trade volumes are increasing dramatically, and most of the leading tokens are posting notable price gains.
The increasing network activity is also helping Solana to recover after a 12-month low. Most recently, pump-and-dump schemes and tariff chaos rocked the meme coin sector, but speculative assets are regaining momentum as macroeconomic fears start to cool down.
Are Solana Meme Coins On the Rise Again?
Solana meme coins have been a popular sector of the crypto ecosystem, but a few controversies have taken bites out of the market in recent months.
“Meme trading platform Axiom’s daily trading volume exceeded $100 million for the first time on April 14, accounting for about 50% of the market share of Solana Meme trading platform. The number of trading users reached 26,800, a record high,” claimed Colin Wu.
Axiom may represent half of the trading for these assets, but it isn’t the only site with heightened volumes. Pump.fun recently launched Pumpswap, a new decentralized exchange that quickly captured 14% of Solana’s DEX market.
Trading volumes are spiking on PumpSwap, with daily trading volume surging by 50% on Tuesday, April 15.
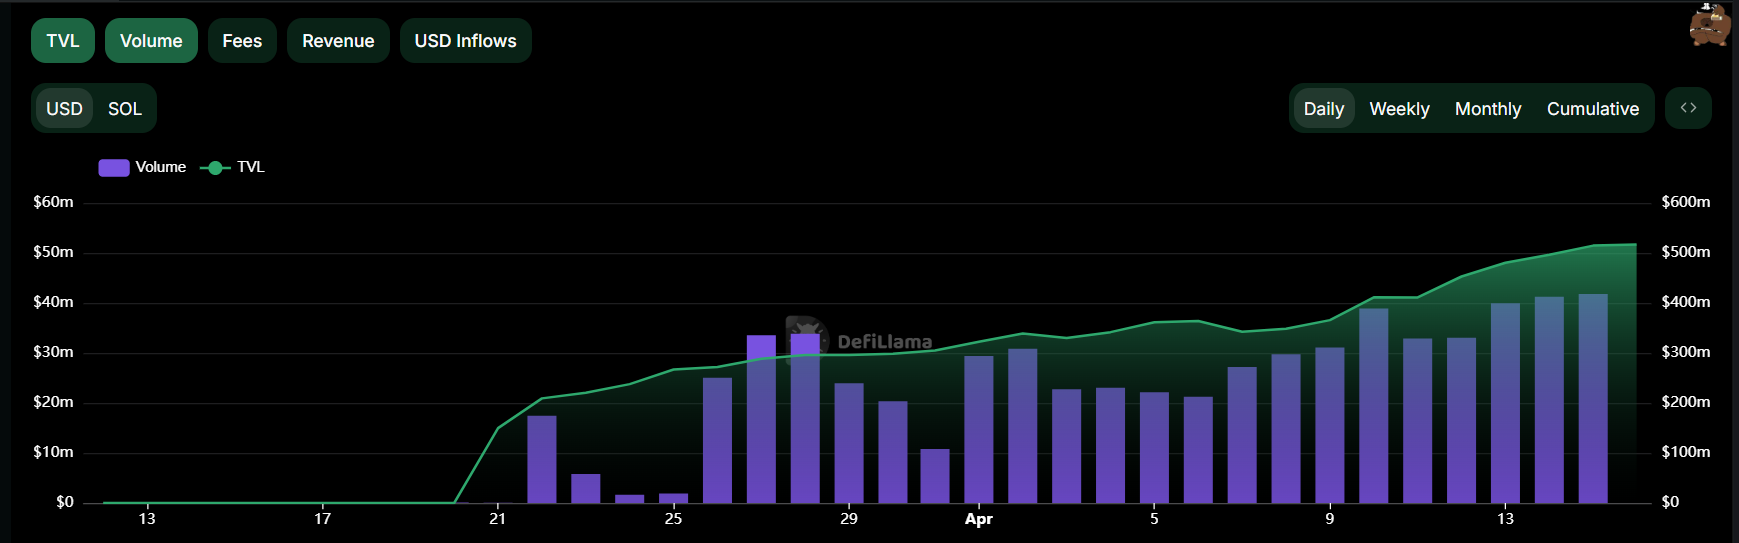
Data from DefiLlama shows that DEX trading on Solana is starting to recover after a massive drop in March. In other words, Solana meme coins’ growth isn’t isolated to either of these platforms either.
These stats have a long way to go before they recover their all-time high from January, but these signs of regrowth are still very promising.
Additionally, individual Solana meme coins are making huge strides in price performance. In the last week, eight of the ten largest assets in this category posted double-digit gains.
For now, it seems like Solana meme coins are eyeing a real comeback, at least for the short term. However, another macroeconomic shock could see these risk assets reacting more severely than the wider market.
The collapse of the MANTRA (OM) token has left investors reeling, with many facing significant losses. As analysts comb through the causes of the collapse, many questions remain.
BeInCrypto consulted industry experts to identify five critical red flags behind MANTRA’s downfall and reveal strategies investors can adopt to steer clear of similar pitfalls in the future.
MANTRA (OM) Crash: What Investors Missed and How to Avoid Future Losses
On April 13, BeInCrypto broke the news of OM’s 90% crash. The collapse raised several concerns, with investors accusing the team of orchestrating a pump-and-dump scheme. Experts believe that there were many early signs of trouble.
In addition, the project adopted an inflationary tokenomic model with an uncapped supply, replacing the previous hard cap. As part of this transition, the total token supply was also increased to 1.7 billion.
However, the move wasn’t without drawbacks. According to Jean Rausis, co-founder of SMARDEX, tokenomics was a point of concern in the OM collapse.
“The project doubled its token supply to 1.77 billion in 2024 and shifted to an inflationary model, which diluted its original holders. Complex vesting favored insiders, while low circulating supply and massive FDV fueled hype and price manipulation,” Jean Rausis told BeInCrypto.
Moreover, the team’s control over the OM supply also raised centralization concerns. Experts believe this was also a factor that could have led to the alleged price manipulation.
“About 90% of OM tokens were held by the team, indicating a high level of centralization that could potentially lead to manipulation. The team also maintained control over governance, which undermined the project’s decentralized nature,” said Phil Fogel, co-founder of Cork.
Phil Fogel acknowledged that a concentrated token supply isn’t always a red flag. However, it’s crucial for investors to know who holds large amounts, their lock-up terms, and whether their involvement aligns with the project’s decentralization goals.
Moreover, Ming Wu, the founder of RabbitX, also argued that analyzing this data is essential to uncover any potential risks that could undermine the project in the long term.
“Tools like bubble maps can help identify potential risks related to token distribution,” Wu advised.
2. OM Price Action
2025 has been marked as the year of significant market volatility. The broader macroeconomic pressures have weighed heavily on the market, with the majority of the coins experiencing steep losses. Yet, OM’s price action was relatively stable until the latest crash.
OM vs. TOTAL Market Performance. Source: TradingView
“The biggest red flag was simply the price action. The whole market was going down, and nobody cared about MANTRA, and yet its token price somehow kept pumping in unnatural patterns – pump, flat, pump, flat again,” Jean Rausis disclosed.
He added that this was a clear sign of a potential issue or problem with the project. Nevertheless, he noted that identifying the differentiating price action would require some technical analysis know-how. Thus, investors lacking the knowledge would have easily missed it.
Despite this, Rausis highlighted that even the untrained eye could find other signs that something was off, ultimately leading to the crash.
Strategies to Protect Yourself
While investors remained optimistic about OM’s resilience amid a market downturn, this ended up costing them millions. Eric He, LBank’s Community Angel Officer, and Risk Control Adviser emphasized the importance of proactive risk management to avoid OM-style collapses.
“First, diversification is key—spreading capital across projects limits single-token exposure. Stop-loss triggers (e.g., 10-20% below buy price) can automate damage control in volatile conditions,” Eric shared with BeInCrypto.
Ming Wu had a similar perspective, emphasizing the importance of avoiding over-allocation to a single token. The executive explained that a diversified investment strategy helps mitigate risk and enhances overall portfolio stability.
“Investors can use perpetual futures as a risk management tool to hedge against potential price declines in their holdings,” Wu remarked.
Meanwhile, Phil Fogel advised focusing on a token’s liquidity. Key factors include the float size, price sensitivity to sell orders, and who can significantly impact the market.
3. Project Fundamentals
Experts also highlighted major discrepancies in MANTRA’s TVL. Eric He pointed out a significant gap between the token’s fully diluted valuation (FDV) and the TVL. OM’s FDV reached $9.5 billion, while its TVL was only $13 million, indicating a potential overvaluation.
“A $9.5 billion valuation against $13 million TVL, screamed instability,” Forest Bai, co-founder of Foresight Ventures, stated.
Notably, several issues were also raised regarding the airdrop. Jean Rausis called the airdrop a “mess.” He cited many issues, including delays, frequent changes to eligibility rules, and the disqualification of half the participants. Meanwhile, suspected bots were not removed.
“The airdrop disproportionately favored insiders while excluding genuine supporters, reflecting a lack of fairness,” Phil Fogel reiterated.
The criticism expanded further as Fogel pointed out the team’s alleged associations with questionable entities and ties to questionable initial coin offerings (ICOs), raising doubts about the project’s credibility. Eric He also suggested that MANTRA was allegedly tied to gambling platforms in the past.
Strategies to Protect Yourself
Forest Bai underscored the importance of verifying the project team’s credentials, reviewing the project roadmap, and monitoring on-chain activity to ensure transparency. He also advised investors to assess community engagement and regulatory compliance to gauge the project’s long-term viability.
Ming Wu also stressed distinguishing between real growth and artificially inflated metrics.
“It’s important to differentiate real growth from activity that’s artificially inflated through incentives or airdrops, unsustainable tactics like ‘selling a dollar for 90 cents’ may generate short-term metrics but don’t reflect actual engagement,” Wu informed BeInCrypto.
Finally, Wu recommended researching the background of the project’s team members to uncover any history of fraudulent activity or involvement in questionable ventures. This would ensure that investors are well-informed before committing to any project.
4. Whale Movements
As BeInCrypto reported earlier, before the crash, a whale wallet reportedly associated with the MANTRA team deposited 3.9 million OM tokens into the OKX exchange. Experts highlighted that this wasn’t an isolated incident.
“Large OM transfers (43.6 million tokens, ~$227 million) to exchanges days prior were a major warning of potential sell-offs,” Forest Bai conveyed to BeInCrypto.
Ming Wu also explained that investors should pay close attention to such large transfers, which often act as warning signals. Moreover, analysts at CryptoQuant also outlined what investors should look out for.
“OM transfers into exchanges amounted to as much as $35 million in just an hour. This represented an alert sign as: Transfers into exchanges are below $8 million in a typical hour (excluding transfers into Binance, which are typically large given the size of the exchange). Transfers into exchanges represented more than a third of the total OM transferred, which indicates a high transfer volume into exchanges,” CryptoQuant informed BeInCrypto.
Strategies to Protect Yourself
CryptoQuant stated that investors need to monitor the flows of any token into exchanges, as it could indicate increasing price volatility in the near future.
Meanwhile, Risk Control Adviser Eric He outlined four strategies to stay up-to-date when it comes to large transfers.
Chain Sleuthing: Tools like Arkham and Nansen allow investors to track large transfers and monitor wallet activity.
Set Alerts: Platforms like Etherscan and Glassnode notify investors of unusual market movements.
Track Exchange Flows: Users need to track large flows into centralized exchanges.
Check Lockups: Dune Analytics helps investors determine if team tokens are being released earlier than expected.
He also recommended focusing on the market structure.
“OM’s crash proved market depth is non-negotiable: Kaiko data showed 1% order book depth collapsed 74% before the fall. Always check liquidity metrics on platforms like Kaiko; if 1% depth is below $500,000, that’s a red flag,” Eric revealed to BeInCrypto.
Additionally, Phil Fogel underlined the importance of monitoring platforms like X (formerly Twitter) for any rumors or discussions about possible dumps. He stressed the need to analyze liquidity to assess whether a token can handle sell pressure without causing a significant price drop.
Interestingly, experts were slightly divided on how CEXs contributed to OM’s crash. Forest Bai claimed that CEX liquidations during low-liquidity hours worsened the crash by triggering cascading sell-offs. Eric He corroborated this sentiment.
“CEX liquidations played a major role in the OM crash, acting as an accelerant. With thin liquidity—1% depth falling from $600,000 to $147,000—forced closures triggered cascading liquidations. Over $74.7 million was wiped in 24 hours,” he mentioned.
“Analyzing the open interest in the OM derivatives market reveals that it was less than 0.1% of OM’s market capitalization. However, what’s particularly interesting is that during the market collapse, open interest in OM derivatives actually increased by 90%,” Wu expressed to BeInCrypto.
According to the executive, this challenges the idea that liquidations or forced closures caused the price drop. Instead, it indicates that traders and investors increased their short positions as the price fell.
Strategies to Protect Yourself
While the involvement of CEXs remains debatable, the experts did address the key point of investor protection.
“Investors can limit leverage to avoid forced liquidations, choose platforms with transparent risk policies, monitor open interest for liquidation risks, and hold tokens in self-custody wallets to reduce CEX exposure,” Forest Bai recommended.
Eric He also advised that investors should mitigate risks by adjusting leverage dynamically based on volatility. If tools like ATR or Bollinger Bands signal turbulence, exposure should be reduced.
The MANTRA (OM) collapse is a powerful reminder of the importance of due diligence and risk management in cryptocurrency investments. Investors can minimize the risk of falling into similar traps by carefully assessing tokenomics, monitoring on-chain data, and diversifying investments.
With expert insights, these strategies will help guide investors toward smarter, more secure decisions in the crypto market.
As the second week of July begins, the bearish sentiment from Q2 appears to be fading quickly. Meme coins are gaining traction, with many emerging in the market.
BeInCrypto has analyzed three such meme coins that are attracting significant attention from investors, indicating a potential shift in market conditions.
Hosico Cat (HOSICO)
HOSICO has been on an impressive upward trajectory since the end of June, currently trading at $0.0631. In the past week, the meme coin has surged by 109%, showing significant growth. This price movement signals strong momentum and growing investor interest in HOSICO.
During this surge, HOSICO managed to set a new all-time high (ATH) at $0.0775. The altcoin’s bullish trend seems likely to continue, with further potential for forming new ATHs. If the momentum persists, HOSICO could see even greater price movements, attracting more attention from investors.
However, if selling pressure increases, HOSICO’s bullish outlook could be invalidated. A drop below the support level of $0.0619 would likely signal a retreat, potentially pushing the meme coin down to $0.0486. Such a pullback would suggest a shift in market sentiment.
Useless (USELESS)
USELESS has been gaining significant momentum, rising by nearly 26% this week. The meme coin is currently trading at $0.280, following a similar trend seen in other meme coins. This surge indicates strong investor interest and suggests a potential for further price movement in the coming weeks.
Having secured $0.250 as a support level, USELESS appears poised for growth. The Chaikin Money Flow (CMF) shows strong inflows, supporting the altcoin’s upward trend. If this continues, USELESS could breach its all-time high (ATH) of $0.309 and potentially set a new ATH at $0.400.
However, if investors choose to cash out and secure profits, USELESS could face a significant pullback. A drop below the $0.250 support level could push the altcoin down to $0.182, invalidating the current bullish thesis. This would signal a shift in market sentiment and lead to a potential downturn.
Osaka Protocol (OSAK)
OSAK has gained 50% this week, showing significant recovery after a challenging June. Currently trading at $0.0000000997, the meme coin is drawing investor attention due to its recent momentum. This increase indicates potential for further growth if the current trend continues, with OSAK aiming for higher levels.
The next target for OSAK is to breach the resistance level of $0.0000001090 and push toward $0.0000001240. The Parabolic SAR below the candlesticks is acting as support, signaling an active uptrend. This positive indicator suggests that the meme coin has the potential to continue climbing if market conditions remain favorable.
However, if the broader market experiences a downturn, OSAK could face selling pressure. A drop below the support of $0.0000000965 would signal a potential reversal, pushing the altcoin down to $0.0000000866. This scenario would invalidate the current bullish outlook, pointing to a possible correction in OSAK’s price movement.