Bonk (BONK), the popular Solana-based meme coin, is on the verge of a massive price crash. This bearish outlook emerges during a period when major cryptocurrencies are experiencing massive sell-offs and price crashes.
BONK Technical Analysis and Upcoming Level
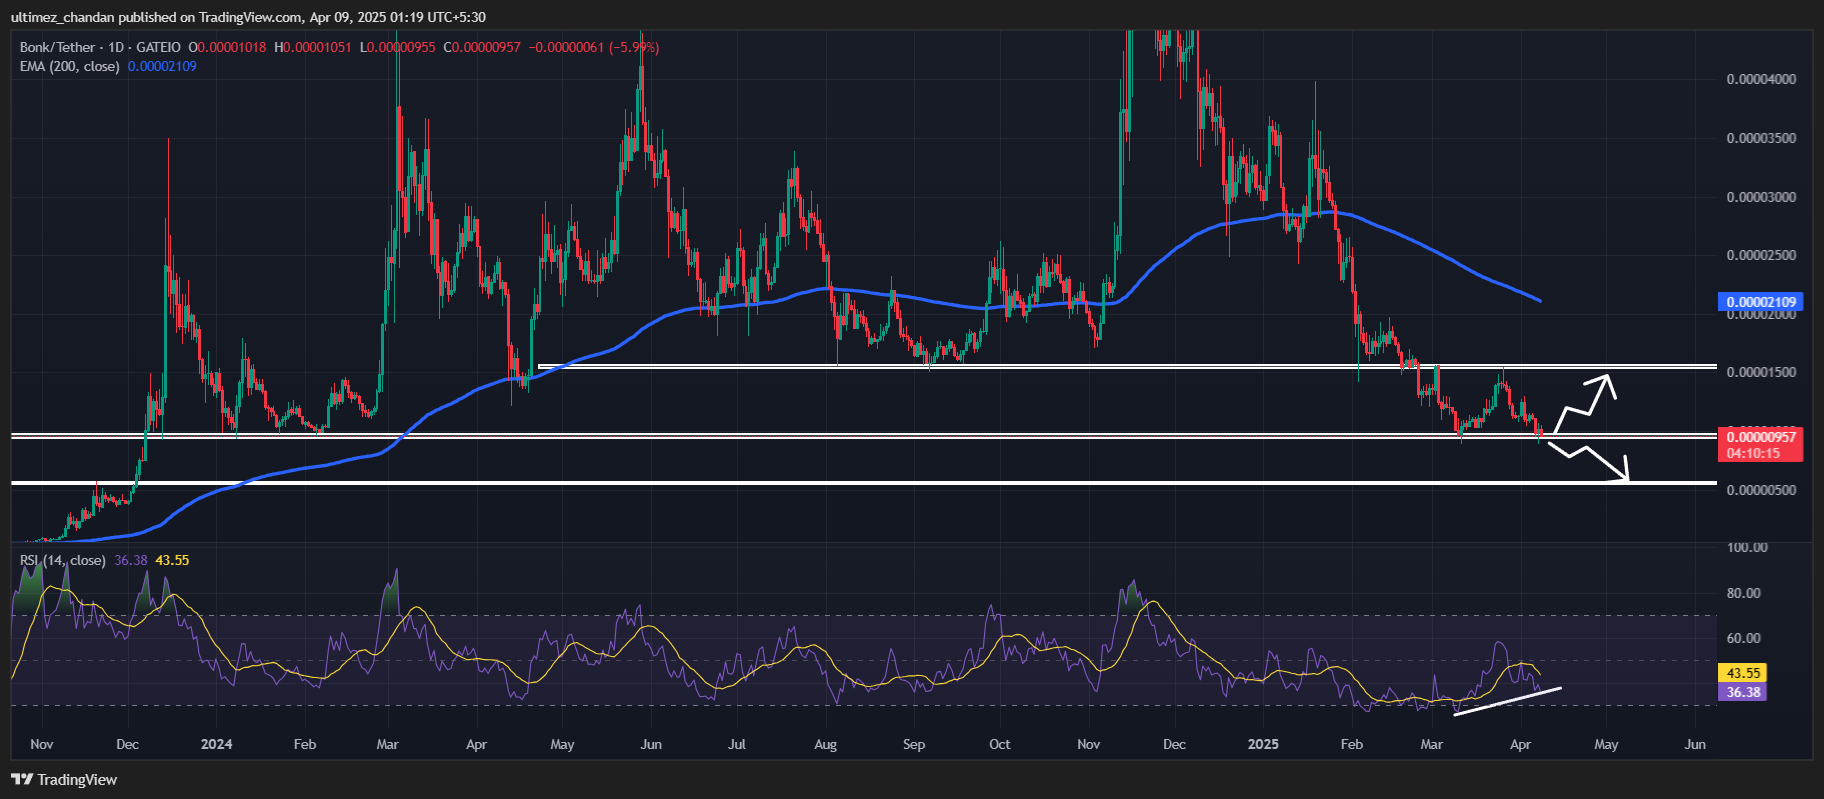
According to expert technical analysis, BONK appears bullish but is currently at a make-or-break level of $0.0000095. The daily chart shows multiple bullish signals, such as bullish divergence and the formation of a bullish double-bottom price action pattern.
Source: Trading View
However, the ongoing market sentiment and downward momentum in major assets like Bitcoin (BTC) and Ethereum (ETH) seem to be influencing other cryptocurrencies, especially those with a small market cap like BONK.
Based on recent price action and historical momentum, this key level has consistently acted as strong support. Since December 2023, BONK has experienced multiple upward moves after bouncing from this level. Meanwhile, experts and traders are also expecting a similar move in the meme coin.
However, given the current unfavorable market sentiment, BONK’s bullish outlook appears to be challenging.
The daily chart reveals that if BONK fails to hold this level and closes a daily candle below $0.0000088, it could drop by 38% to reach the next support at $0.0000055 in the future. However, if the meme coin holds this level, there is also a possibility that history will repeat and BONK will once again see an upside rally.
BONK Price and Volume Drop
At press time, BONK is trading near $0.000009677 and has recorded a price decline of over 5.50% in the past 24 hours. Meanwhile, during the same period, its trading volume dropped by 55%, indicating lower participation from traders and investors, potentially due to the current market sentiment.
Traders Lean Bearish on BONK
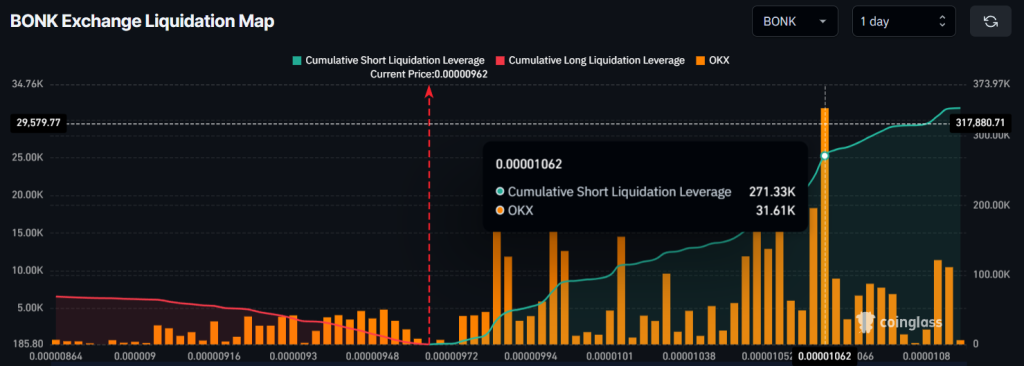
Given the strong bearish market and downward momentum in BONK, traders seem to be dominating the asset by heavily betting on the bearish side, as reported by the on-chain analytics firm Coinglass.
Data reveals that traders are over-leveraged at $0.0000095 on the lower side (support), where only $11.30K worth of long positions have been built. In contrast, $0.00001062 is another over-leveraged level on the upper side (resistance), where traders have built $271.30K worth of short positions.
Source: Coinglass
Examining this on-chain metric, it appears that short sellers are currently dominating, with minimal interest in going long on BONK. This could easily push the meme coin lower and lead to a breach of its support level.
Over the past few months, Ethereum has experienced a significant decline in user activity on its blockchain. This slowdown has reduced the network’s burn rate—a mechanism that helps decrease ETH supply over time.
With fewer tokens being burned, ETH’s circulating supply has risen, putting inflationary pressure on the asset. As a result, the coin has struggled to maintain a stable price above the $2,000 level in recent months.
Low Burn Rate Equals More Coins in Circulation
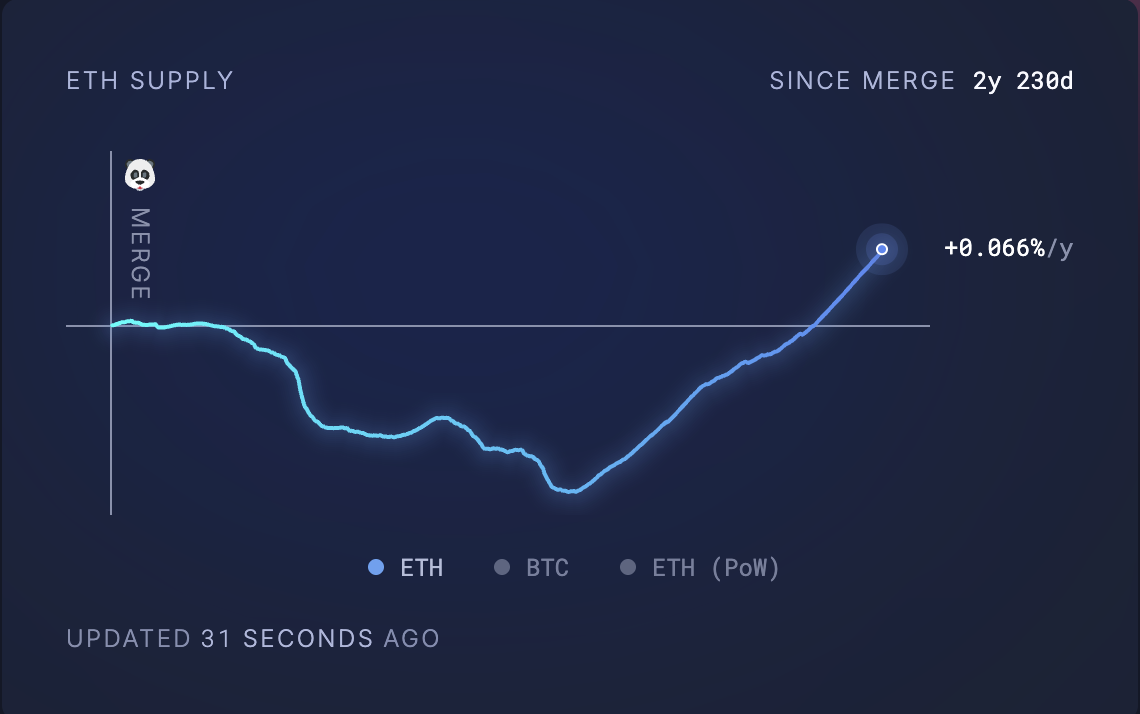
According to Ultrasoundmoney, 72,927 ETH, valued at $134 million at current market prices, have been added to ETH’s circulating supply in the past month alone.
At press time, this sits at 120,730,199 ETH, significantly above pre-merge levels.
This increase in ETH’s supply is driven by a decline in user activity on the Ethereum network, reducing its burn rate. Ethereum’s burn mechanism, introduced through EIP-1559, destroys a portion of transaction fees to reduce the circulating supply of ETH.
However, this mechanism is directly tied to network usage. So, when fewer transactions occur like this, less ETH is burned, resulting in ETH’s supply spiking.
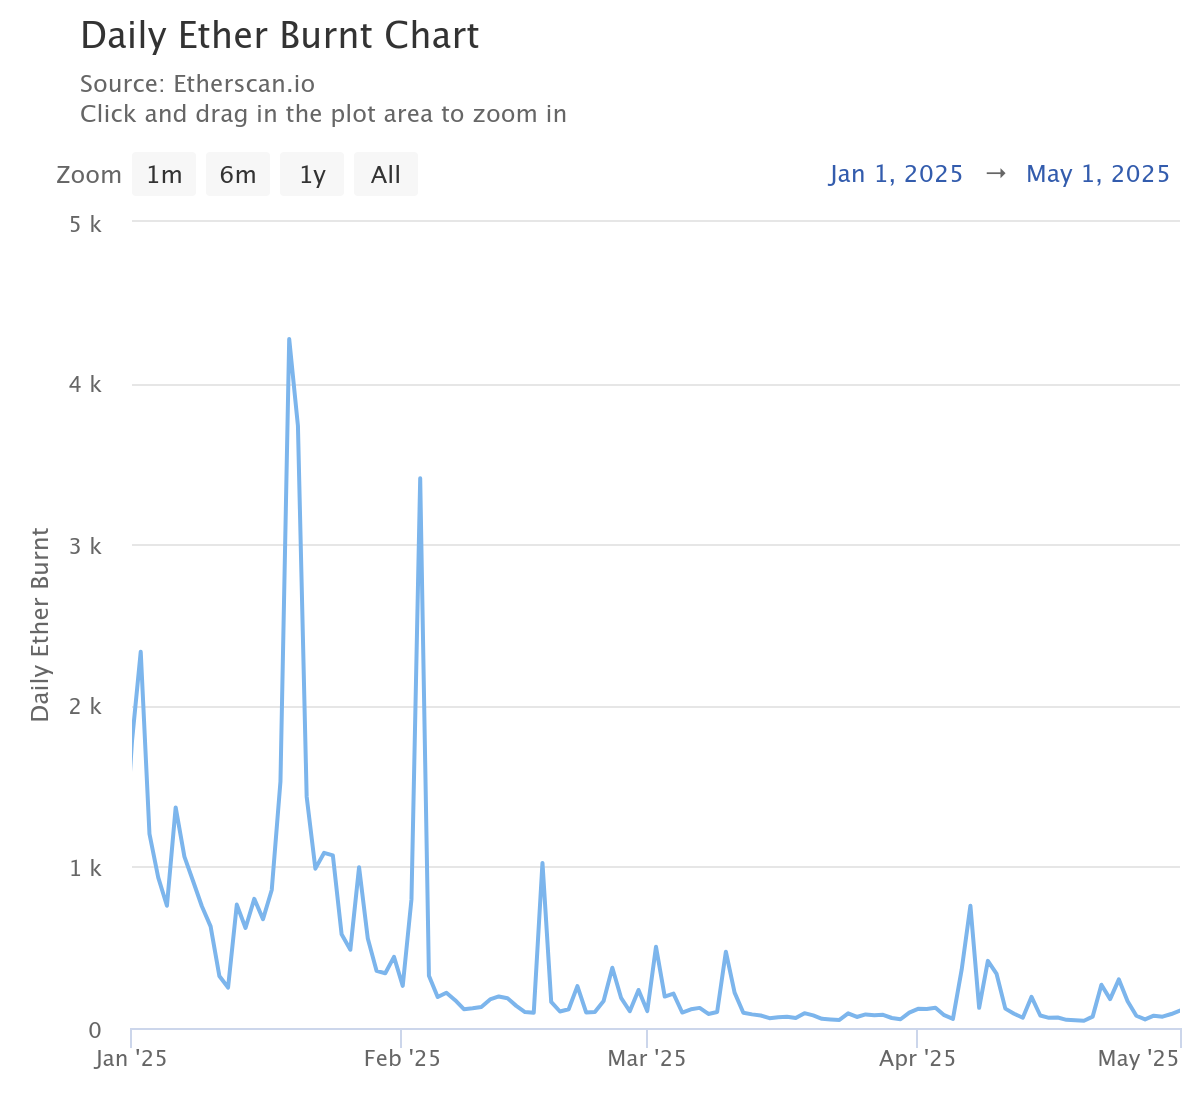
According to Etherscan, the daily amount of ETH burnt has dropped by 95% year-to-date. In fact, the network recently recorded its lowest amount of coins burnt in a single day on April 20.
Many users and developers are migrating from Ethereum to Layer-2 (L2) solutions like Optimism and Arbitrum. These networks offer significantly lower transaction fees and faster execution, reducing user activity on Ethereum’s mainnet.
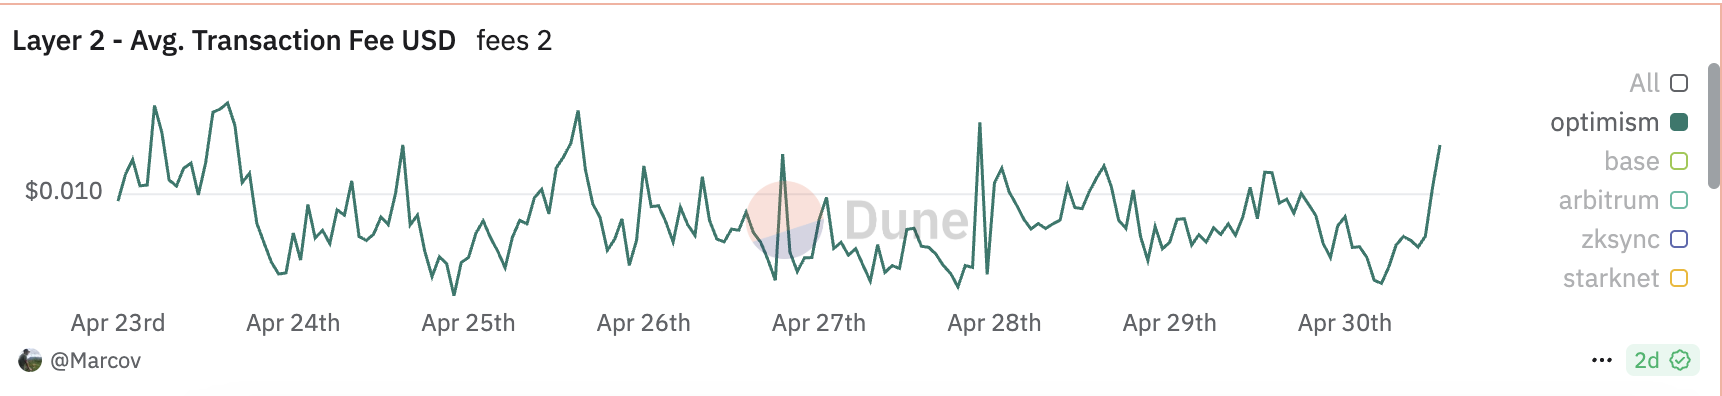
For example, as of April 30, the average transaction fee on Optimism’s mainnet was just $0.024. By contrast, completing a transaction directly on Ethereum cost users an average of $0.18 on the same day, which is over seven times more expensive.
Optimism Average Transaction Fee. Source: Dune Analytics
Moreover, thanks to the recent meme coin mania, “Ethereum killers,” such as Solana, have gained significant traction over the past few months, drawing users away from the L1.
Together, these trends have led to a decline in Ethereum’s transaction count, hence the network’s low burn rate.
How Do Ethereum’s Fundamentals Stack Up?
The drop in Ethereum’s user demand and the subsequent rise in ETH’s supply have raised important questions about the strength of its fundamentals.
When asked how Ethereum currently compares to other Layer-1 (L1) networks amid broader market weakness, Vincent Liu, Chief Investment Officer at Kronos Research, offered his perspective.
“Ethereum’s fundamentals remain strong relative to other Layer 1s, particularly when you consider its total value locked (TVL) of $368.921 billion, which positions it at the top of the leaderboard,” Liu said.
Although Liu acknowledged that Ethereum ranks fifth in 24-hour fees, behind Tron, Solana, HyperLiquid, Bitcoin, and BNB Chain. He emphasized that the network still “demonstrates significant demand and usage.”
Temujin Louie, CEO of Wanchain, shares a similar perspective. While speaking with BeInCrypto, Louie noted:
“Compared to other Layer 1s, fundamentals remain Ethereum’s strength. Unlike many Layer 1s with aggressive inflation as part of their design, Ethereum’s post-merge architecture makes it potentially deflationary. However, the benefits of EIP-1559 depend on on-chain activity. Nevertheless, this is a structural advantage over most competing Layer 1s.”
While increased activity across Layer-2 (L2) solutions and “Ethereum killers” like Solana may have contributed to a decline in user demand on Ethereum itself, Louie believes that the L1 network “remains a leader in decentralization and has a near-unmatched track record that continues to secure its place in the market.”
What About ETH Price?
Even with strong fundamentals, declining activity on Ethereum poses challenges for ETH in the short- to mid-term. Commenting on this, Liu explained that lower network activity generally signals weaker demand for ETH.
At the same time, increased coin issuance on the network undermines Ethereum’s deflationary model, which was designed to support price appreciation.
“This combination could result in bearish price movements,” Liu warned, “especially as investors look to alternative Layer 1s offering better scalability and lower fees.”
Kadan Stadelmann, CTO of Komodo Platform, also highlighted the role of macroeconomic factors:
“If Ethereum experiences an extended decrease in usage, the price could fall considerably depending on how much use drops, especially if the Fed continues its policy of quantitative tightening compared to quantitative easing. Short-term, this could mean price drops down to the $2,000 range. If the trend continues, however, then Ethereum could find itself in a prolonged consolidation period or outright downtrend.”
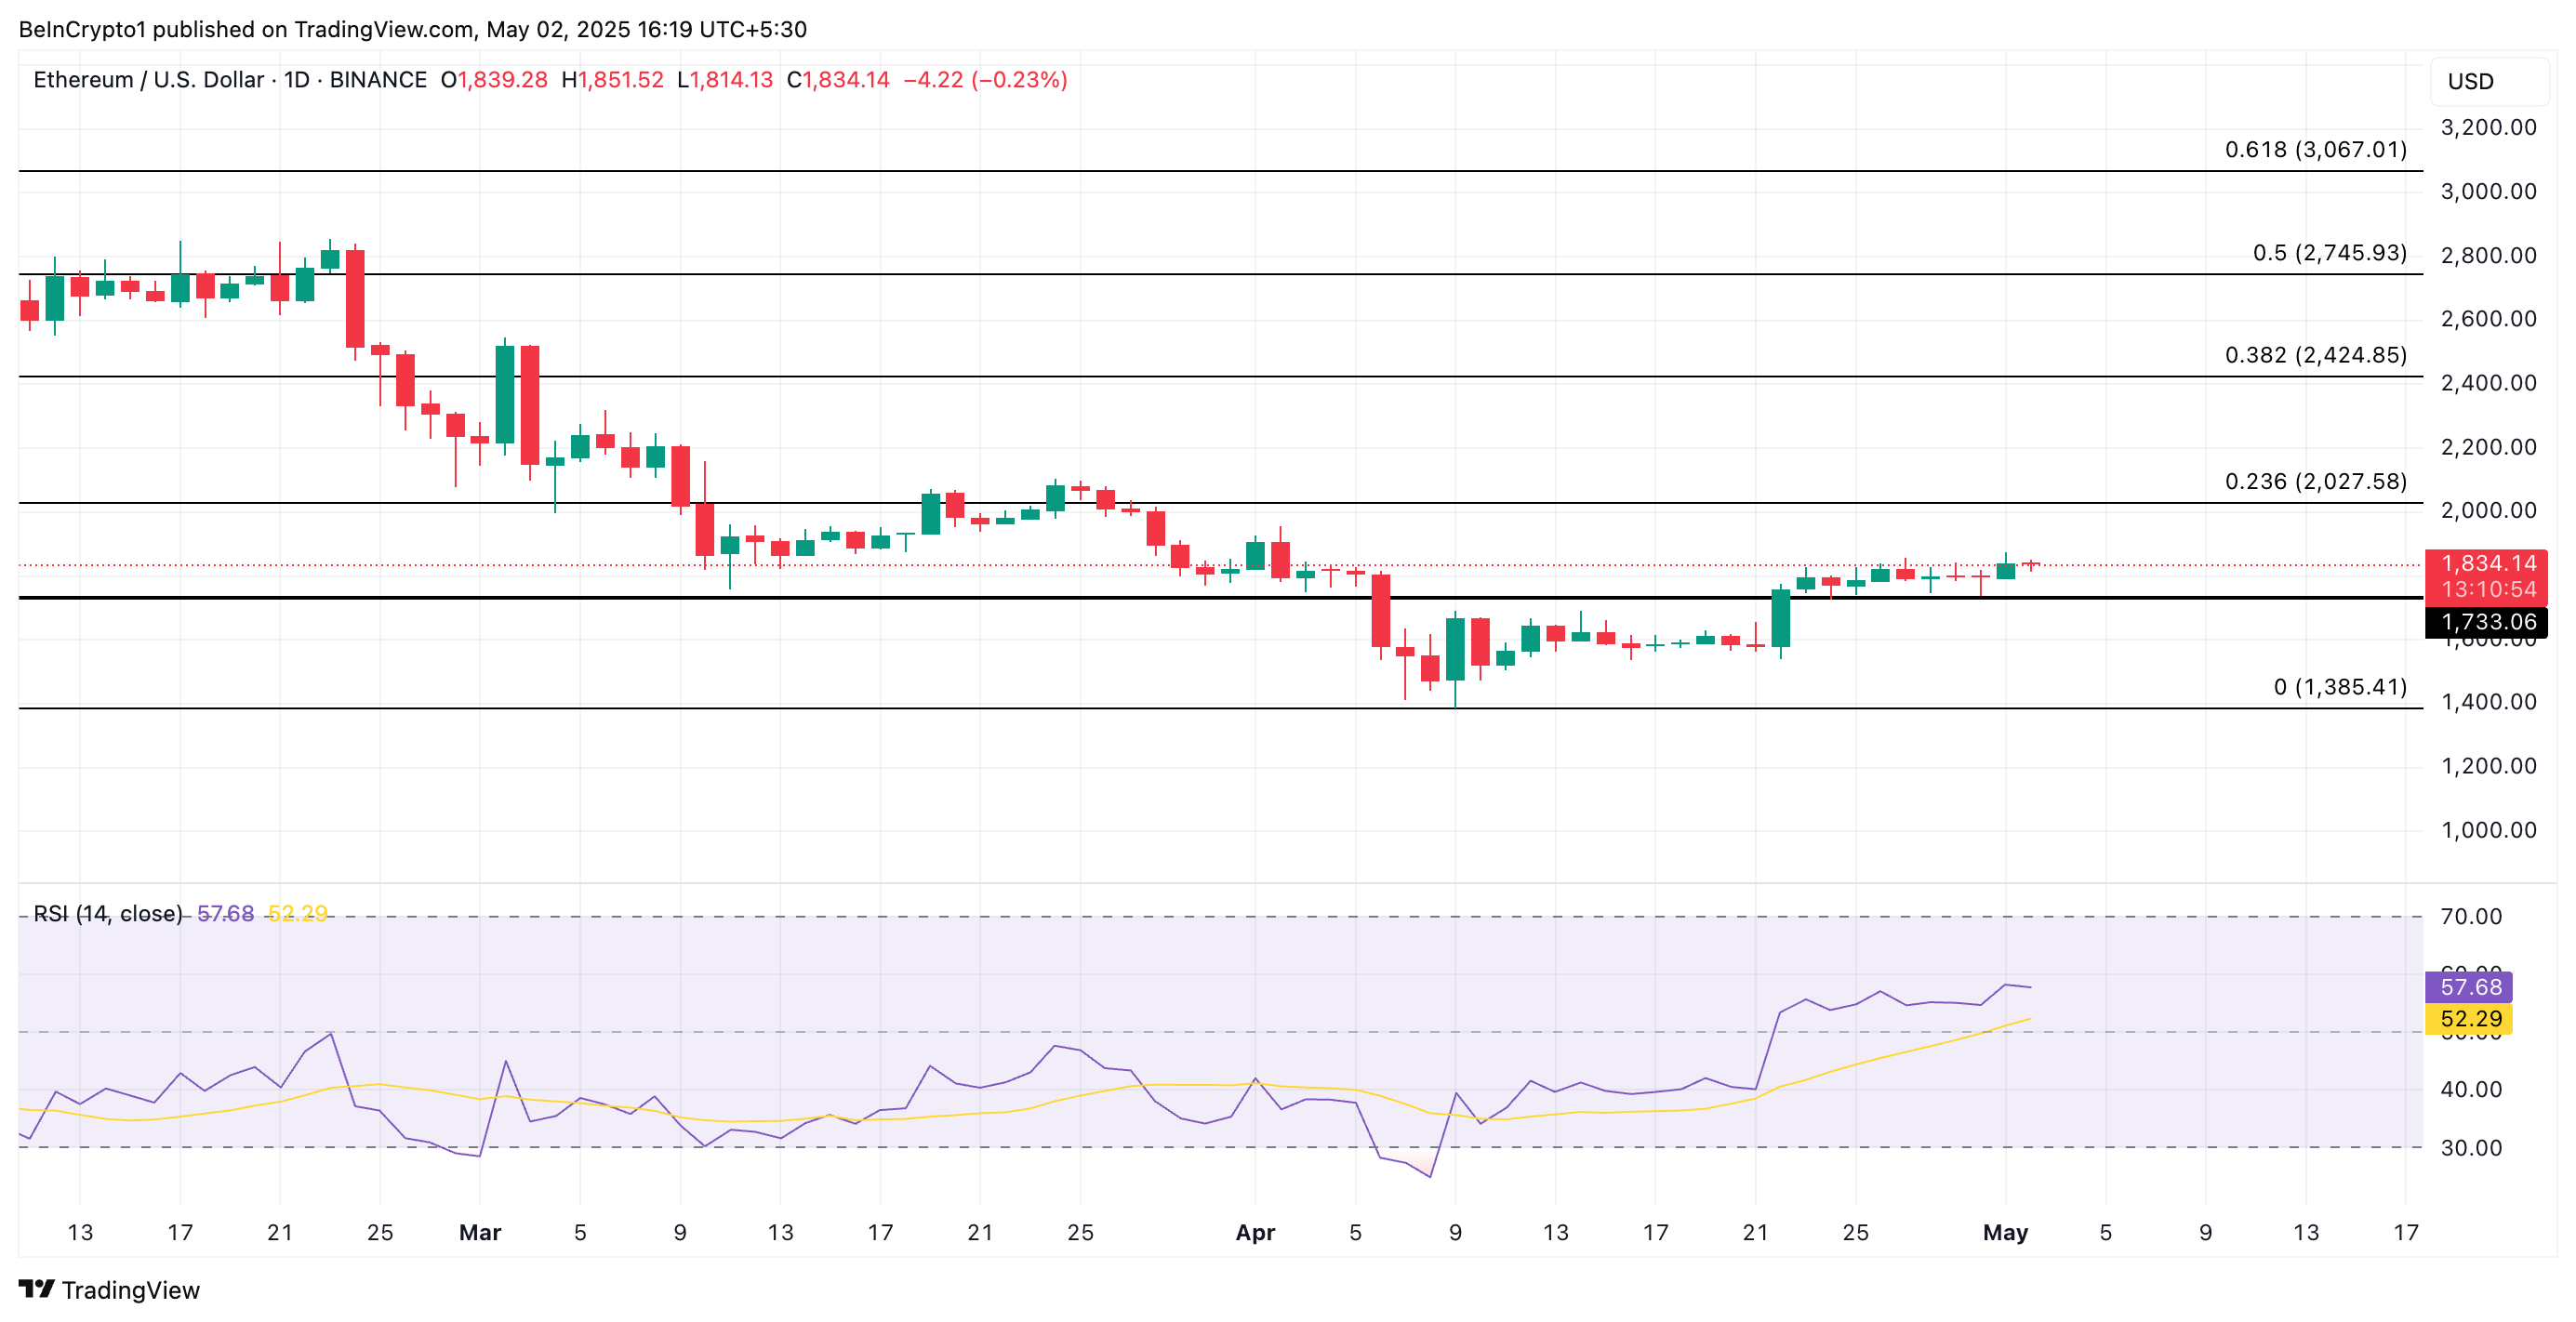
ETH Eyes $2,000 Breakout Amid Strengthening RSI
ETH currently trades at $1,834, noting a 1% price dip over the past day. Despite the brief pullback, the bullish pressure in the coin’s spot markets continues to strengthen, reflected by the coin’s climbing Relative Strength Index (RSI).
At press time, this momentum indicator is at 57.68. ETH’s RSI readings signal growing bullish conditions. This indicates that the altcoin has room for upward movement if buying pressure increases.
In this scenario, its price could break above $2,027.