In this ongoing market crash, XRP, Ripple Labs’ native token, is poised for a massive price decline despite its recent price recovery. Today, April 7, 2025, the overall crypto market has witnessed a significant downward rally, but it now appears to be recovering. However, some see this as a potential pullback before an upcoming price crash.
XRP Technical Analysis and Upcoming Level
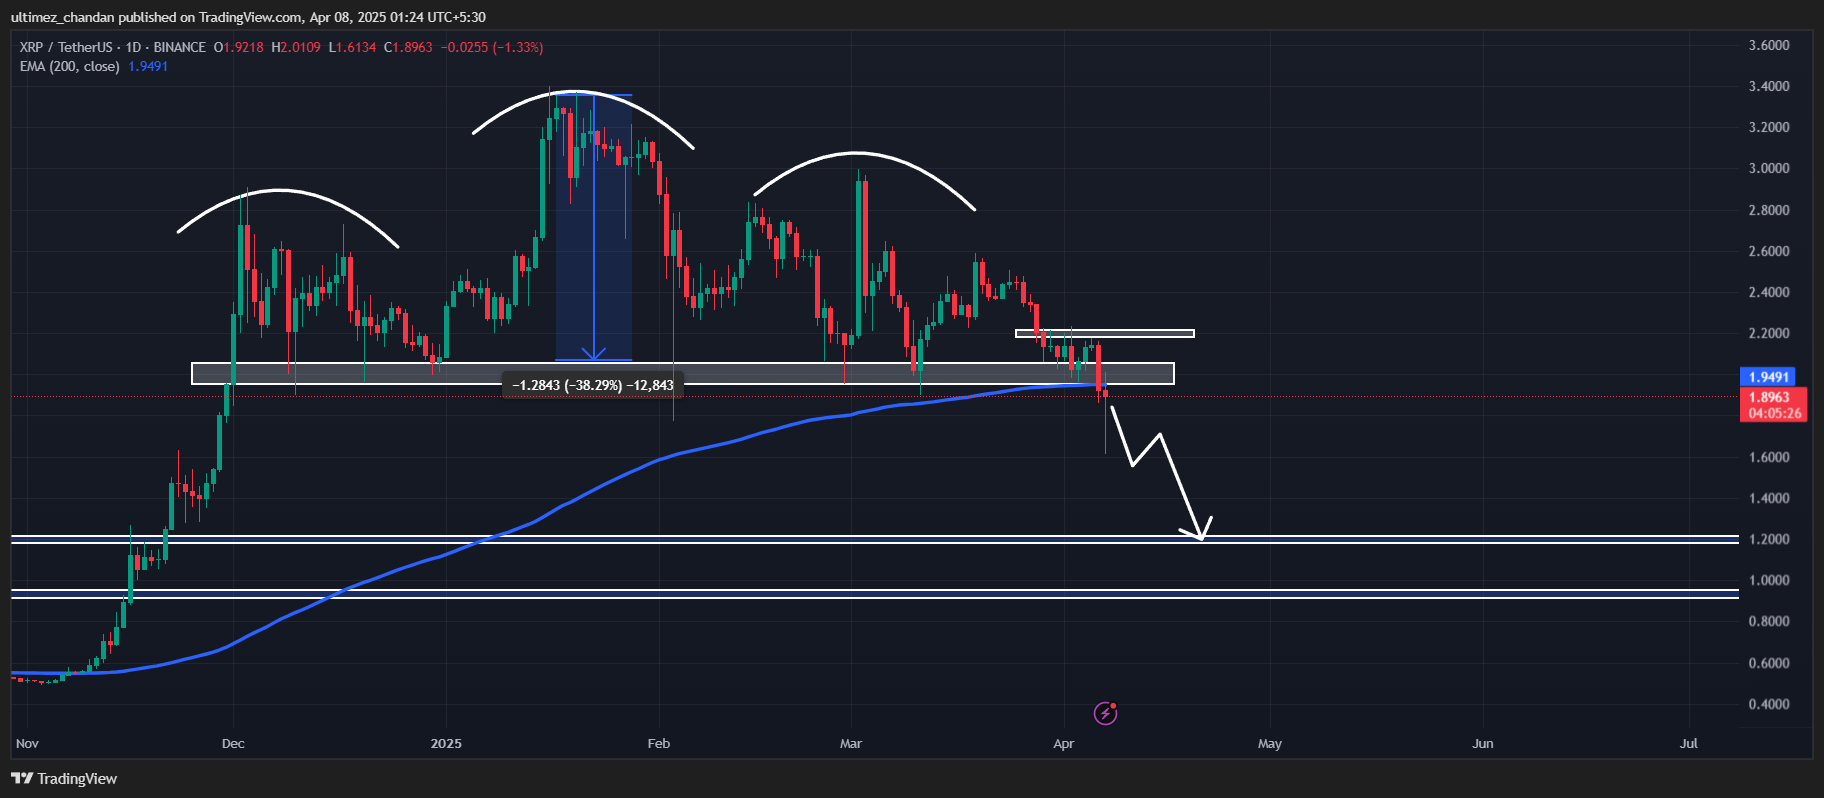
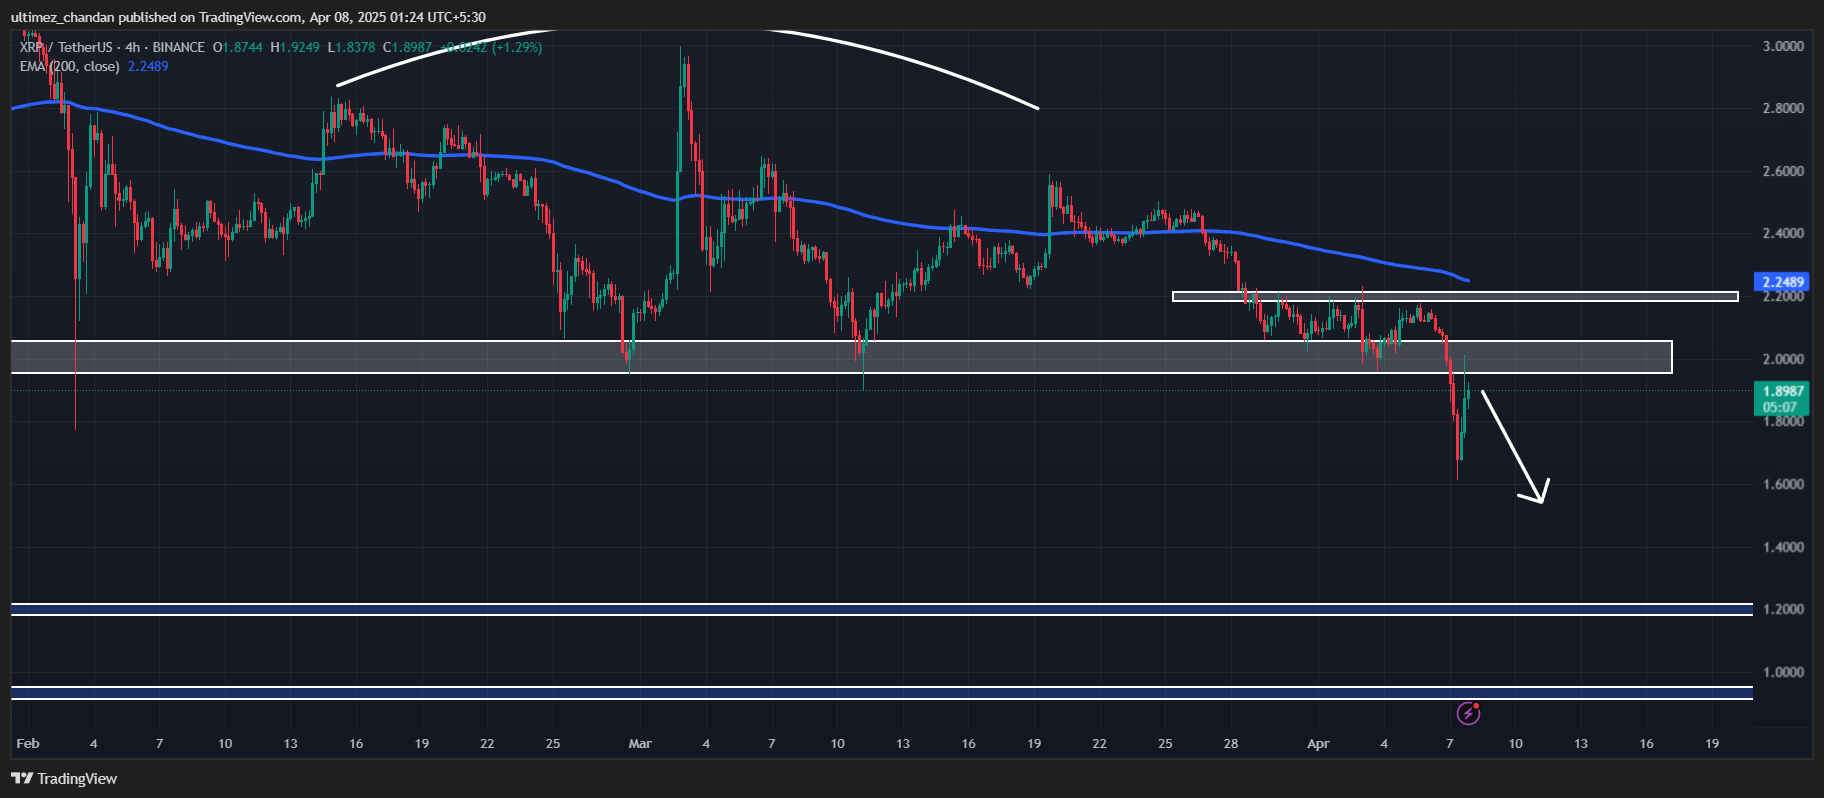
According to expert technical analysis, XRP appears to be continuing its downward momentum. The daily chart reveals that XRP is currently retesting its recent breakdown of the key support level at $1.95.
Source: Trading View
In addition to the support breakdown, XRP has also breached the neckline of a bearish head and shoulders price action pattern and has closed a daily candle below the 200 Exponential Moving Average (EMA). This is the first time XRP has fallen below its 200 EMA, which now shifts it into a strongly bearish asset.
Based on the recent price action and historical momentum, the candle closing below the key level has opened the path for a massive price crash, as the next support is not nearby.
Source: Trading View
According to CoinPedia’s price analysis, if XRP fails to reclaim the $1.95 level, there is a strong possibility it could drop by 39% to reach the next support at the $1.20 level in the future.
Current Price Momentum
At press time, XRP is trading near $1.88 and has recorded a price decline of over 6.50% in the past 24 hours. Meanwhile, amid the price drop, the asset also hit a low of $1.64. This significant downside move and increased price volatility have attracted notable interest from traders and investors, resulting in a 420% surge in trading volume.
$35.40 Million Worth of Bullish Bet
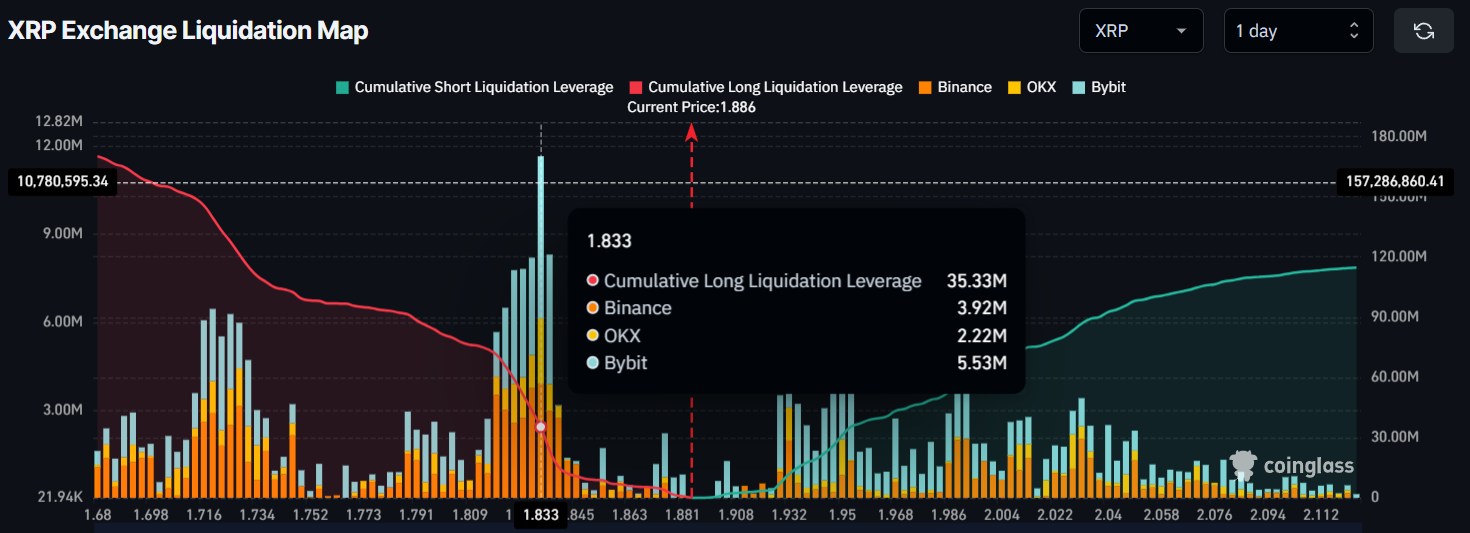
However, looking at the ongoing price recovery, trader sentiment seems to be shifting as they are strongly betting on the bullish side, according to the on-chain analytics firm Coinglass.
Data reveals that traders are currently over-leveraged at $1.833 on the lower side (support) and have built $35.40 million worth of long positions. On the other hand, $1.932 is another over-leveraged level on the upper side (resistance), where traders have built $11.80 million worth of short positions.
Source: Coinglass
The on-chain data indicates that the bulls are back, as the price appears to be retesting its breakdown level.
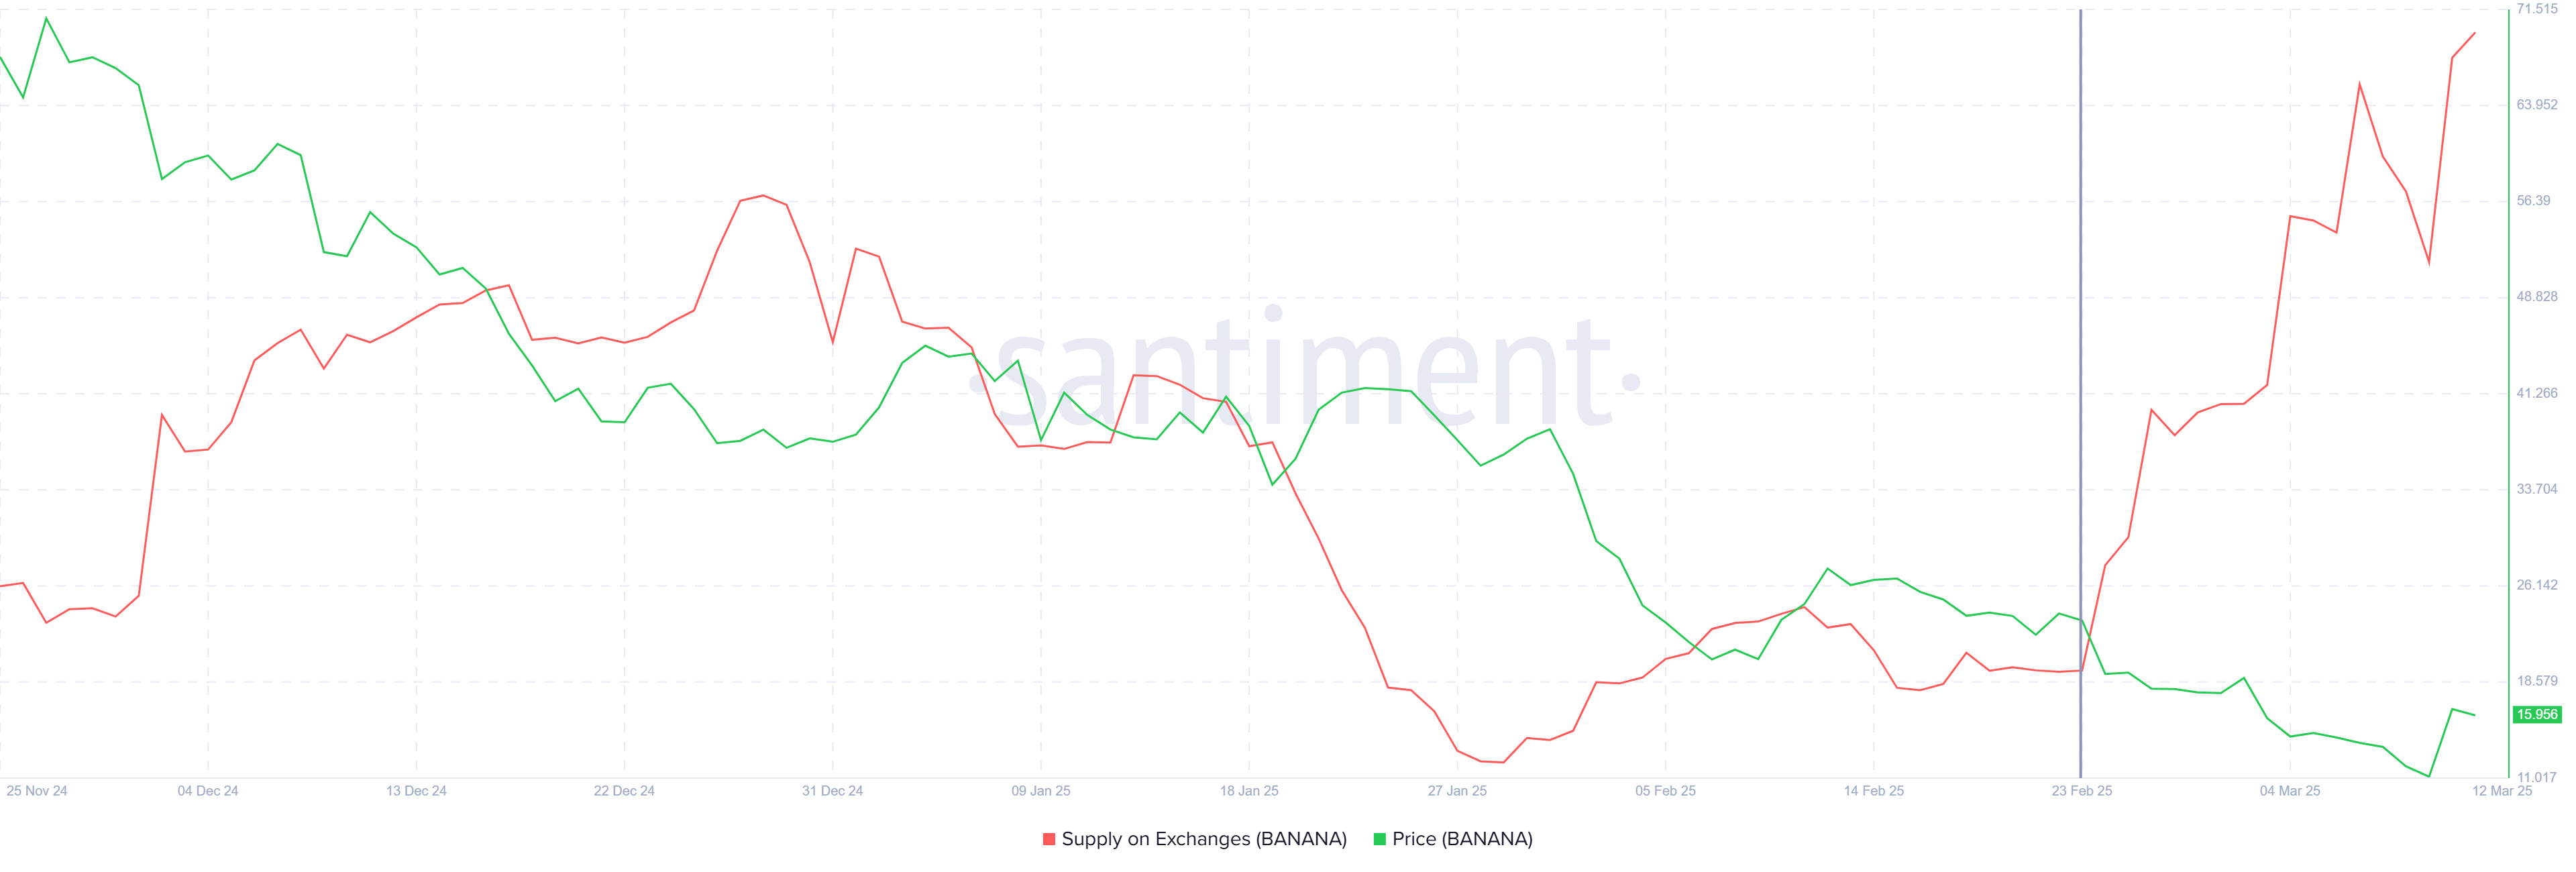
Banana (BANANA) has recently seen a price rally, gaining 44% as it attempts to break out of a descending wedge pattern. While this bullish setup suggests the potential for further gains, investors’ behavior could hinder the altcoin’s progress.
Despite the price rise, many investors are reluctant to hold, potentially delaying the breakout.
Banana Gun Faces Selling
Over the past two weeks, the supply of Banana on exchanges has risen by 300,000 tokens, worth just under $5 million. This increase in selling pressure amounts to roughly 9% of the entire market cap, which stands at $55 million. The growing supply on exchanges is a direct result of the altcoin failing to sustain its recovery, pushing many investors to sell and lock in profits.
This increased selling activity points to a highly bearish sentiment surrounding Banana. The failure to recover has triggered a wave of profit-taking, further weighing on the price.
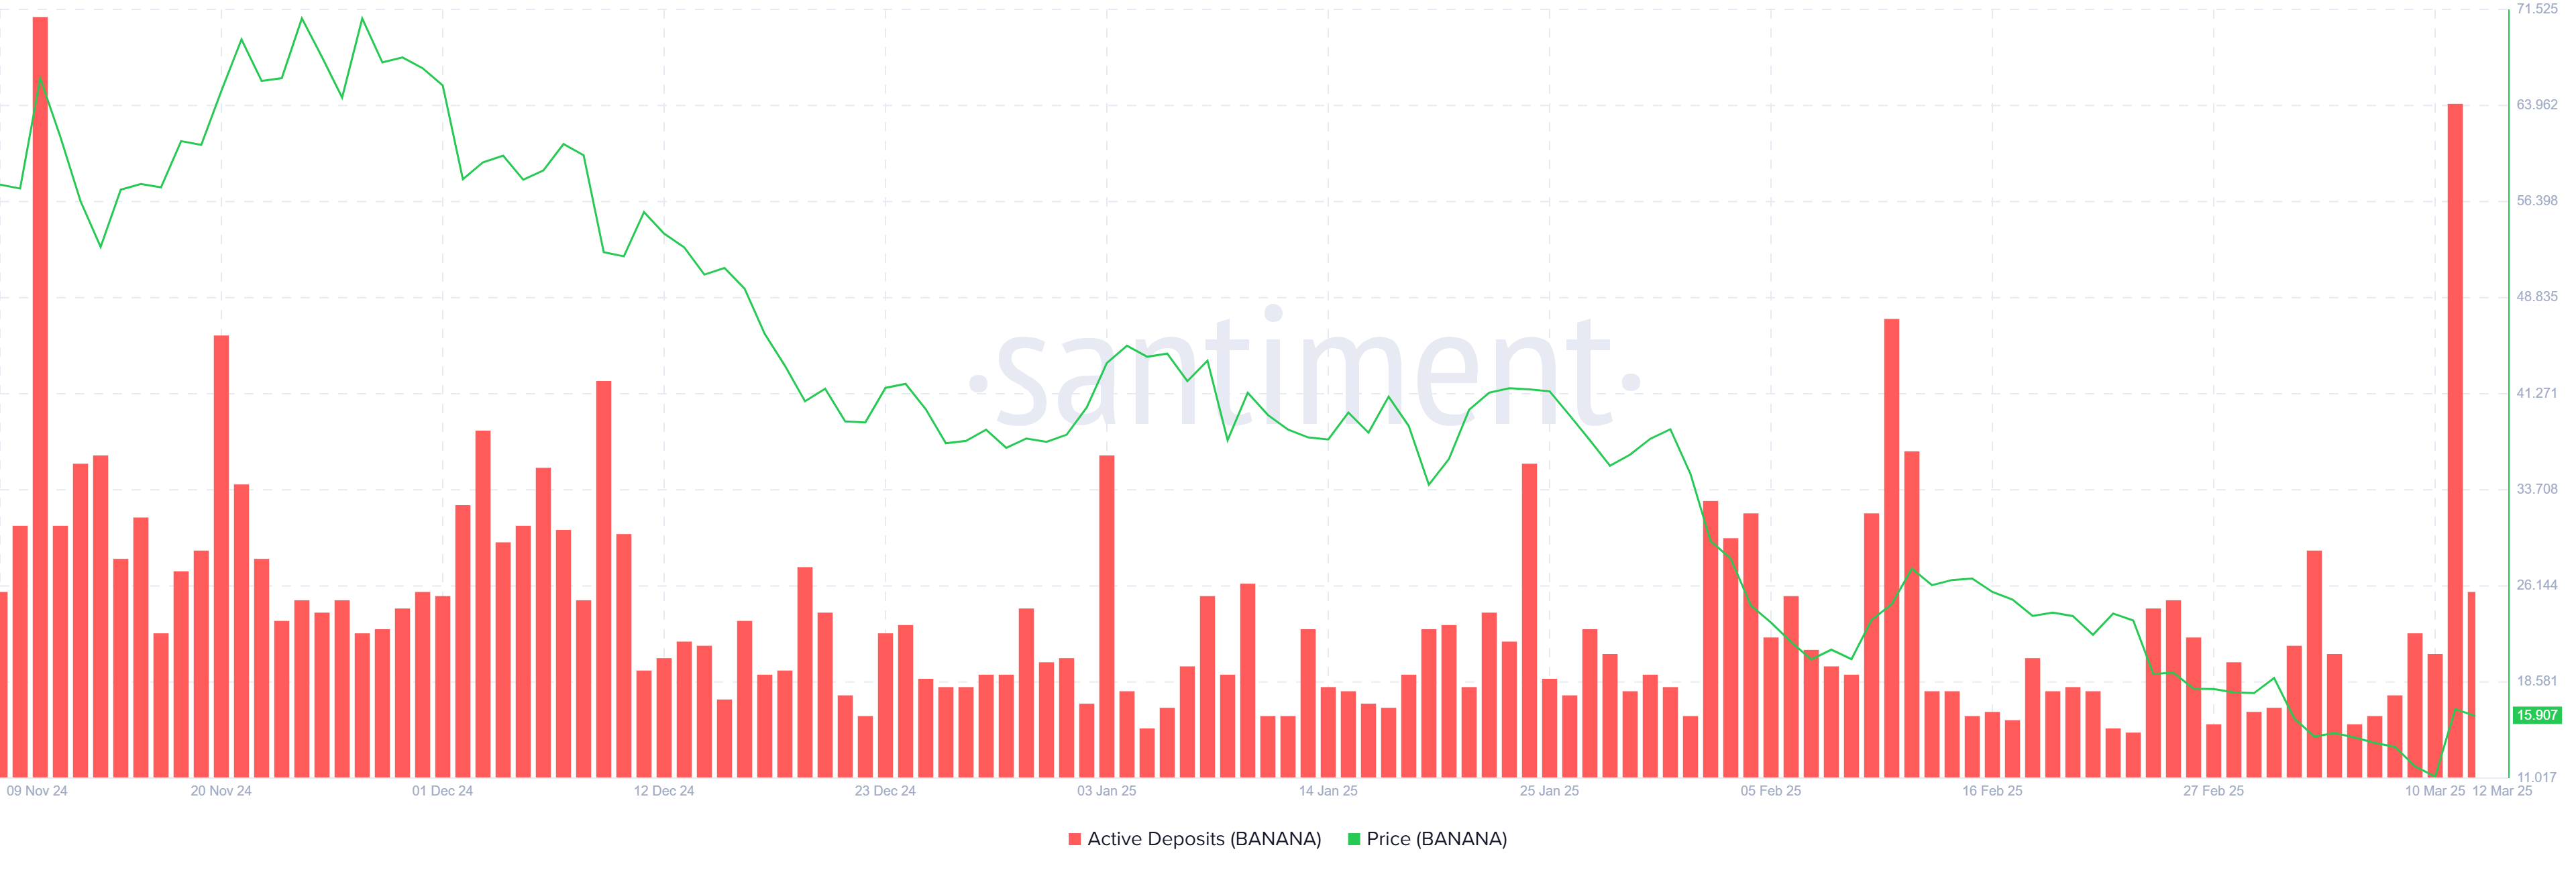
The overall macro momentum for Banana has been marked by a significant spike in active deposits over the past 24 hours, the highest since November 2024. This surge indicates that more Banana tokens are being offloaded, reflecting investor sentiment and profit-taking behavior.
Unlike previous selling periods where investors sought to offset losses, this round of selling appears to be driven by those booking profits. This shift in behavior could signal further selling in the short term, particularly if the price stabilizes or continues to rise.
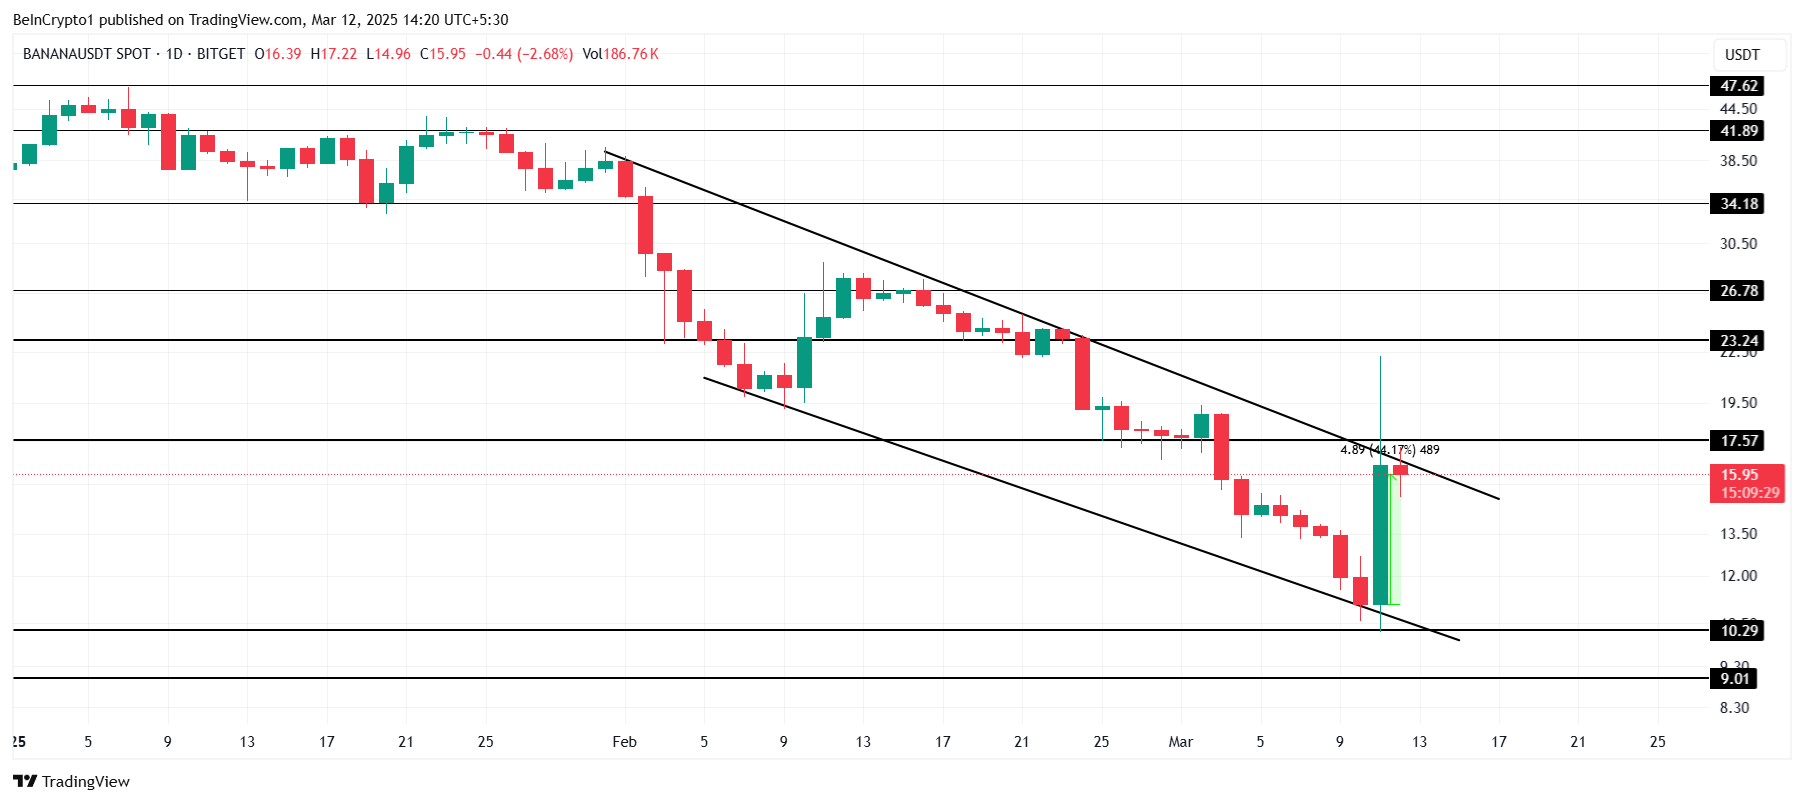
At the moment, Banana is trading at $15.95 after rising by 44% over the past day, sitting within a descending wedge pattern that typically signals bullish potential. However, despite this setup, the altcoin has struggled to break out in the last 24 hours, leaving its future uncertain.
If the current weak momentum and selling trends persist, Banana will likely test the lower trend line of the pattern. This could push the price down to $10.29, delaying any potential recovery and reinforcing the bearish outlook.
On the other hand, if broader market conditions improve and investor sentiment shifts, Banana could see a breakout from the wedge pattern. Successfully breaching the $17.57 barrier would signal a reversal and could send the price towards $23.24. Such a move would invalidate the current bearish outlook and mark the beginning of a stronger upward trend for Banana.
Recently, Solana’s price slipped below the $130 support level, worrying a good share of investors and market observers alike. This drop comes against massive transfers associated with FTX and Alameda Research wallets. Despite improving broader market conditions, such as the cooling inflation trend signaled by the latest U.S. CPI and PPI data, Solana’s potential for a price rebound appears limited.
However, a strong newcomer is beginning to take the front stage within the constantly shifting industry: Rexas Finance (RXS). Priced at just $0.20 and set to launch at $0.25, RXS is now being hailed as the next breakout altcoin—one that might multiply a $500 investment into over $21,000, a possible 42x gain, all while Solana moves onward in its post-peak trajectory.
Solana’s Slowing Momentum
The price of Solana continues to be under pressure. After a brief recovery to the $131 mark, the Sol price was dramatically reversed due to bearish pressure. Recently, the Solana price has fallen further and is now trading below the $125 support zone, which has now flipped into a key level regarding future price movement. As per some analysts’ predictions, an Elliott Wave pattern may be forming, indicating a potential reversal at $112.
According to TA, if the price of Solana fails to hold support in this proximity, there is a growing likelihood of further downward movement. Solana may still develop, but its course seems more steady than explosive. Rexas Finance fills in here with buzz and a complete ecosystem ready to upset many sectors in decentralized finance.
Rexas Finance (RXS): A $0.20 Giant in the Making
Rexas Finance arrived to rule rather than merely show up to participate. Rexas is linking the traditional and decentralized finance worlds in a way very few companies have accomplished, with an ambitious goal to change how real-world assets (RWAs) interact with blockchain.
It is a toolset, a launchpad, and a whole DeFi ecosystem, not only a token. Retail and institutional users can start tokens and mint assets and bring real-world objects such as real estate, commodities, and intellectual property on-chain from the Rexas Launchpad, Token Builder, and QuickMINT Bot. Most coins promise utility “someday,” but Rexas already proves value long before its formal release.
Rexas stands out not only for its high aspirations but also for its rapid execution. Starting at just $0.03, the presale has jumped more than six times to reach its final stage price of $0.20. More than 458.8 million tokens have already been sold, and $47.7 million has been raised thus far. This is investor conviction on full display. While presales may inspire mistrust, Rexas Finance passed its Certik assessment, the highest standard for smart contract security. Already registered on CoinMarketCap and CoinGecko, it provides openness and accessibility even before its June 19, 2025, release—when it will first show up on exchanges at a listing price of $0.25.
The 42x Math and Realistic Potential
A $500 investment gets 2,500 RXS tokens at $0.20 per token. Given its foundations and present buzz, if Rexas reaches $8.40—a reasonable price—that $500 leaps into $21,000. That is a 42x return without depending just on buzz. And concerning the long run? Echoing how early Ethereum or Solana ascended from cents to hundreds, more significant gains could be in play if RXS reaches its predicted multi-dollar targets by 2026. Still, the improvements are astounding relative to Solana’s already inflated position, even in a cautious $5–$10 range.
Conclusion
Solana is still a mainstay in the crypto scene, but its opportunity for life-changing profits is closing. Rexas Finance is only getting started in the meantime. RXS is primed to be among the most explosive prospects of 2025, with excellent presale traction, actual utility, and a scalable ambition.
Should history repeat itself—and crypto cycles suggest it often does—the real millionaires of this cycle will be those supporting tomorrow’s leaders today rather than those clutching yesterday’s victors. Should Rexas Finance perform on even a quarter of its promise, a meager $500 investment might be remembered as the best choice of the decade.
For more information about Rexas Finance (RXS) visit the links below:
The post Solana (SOL) Price Forecast: This Token Will 42x Your $500 While SOL Lags appeared first on Coinpedia Fintech News
Recently, Solana’s price slipped below the $130 support level, worrying a good share of investors and market observers alike. This drop comes against massive transfers associated with FTX and Alameda Research wallets. Despite improving broader market conditions, such as the cooling inflation trend signaled by the latest U.S. CPI and PPI data, Solana’s potential for …
Altcoin/BTC spot trading pairs were once considered a key channel for investors to increase their Bitcoin holdings. However, this perception is fading. Data indicates a decline in interest, with many Altcoin/BTC pairs delisted in early 2025.
Meanwhile, Altcoin/USDT spot pairs remain the primary avenue for traders seeking profits.
Binance Delists Multiple Altcoin/BTC Spot Pairs
At the beginning of 2025, Binance removed several Altcoin/BTC spot pairs from its platform. Today, Binance announced the delisting of MDT/BTC, MLN/BTC, VIB/BTC, VIC/BTC, and XAI/BTC due to low liquidity and trading volume. This is not the first such announcement this year.
“To protect users and maintain a high-quality trading market, Binance conducts periodic reviews of all listed spot trading pairs and may delist selected spot trading pairs due to multiple factors, such as poor liquidity and trading volume,” Binance stated.
Since the start of the year, Binance has issued seven delisting announcements, affecting 34 spot trading pairs. Of these, 50% were Altcoin/BTC pairs, while the rest were Altcoin/ETH or Altcoin/BNB. Notably, the delisting of an Altcoin/BTC pair does not necessarily mean its corresponding Altcoin/USDT pair is removed (e.g., ENJ, C98, REZ).
This shift reflects traders’ preference for Altcoin/Stablecoin pairs, likely due to better liquidity and lower risk exposure.
Retail Investors Reduce Bitcoin Holdings While Institutions Accumulate
CryptoQuant data shows that retail investors have been reducing their BTC holdings since Q4 2024, while large investors continue to accumulate.
Bitcoin Holdings of Retail And Large Investors. Source: CryptoQuant.
“Retail is panic-selling. Whales are accumulating,” Investor Mister Crypto commented.
Since the approval of Bitcoin ETFs and the start of Trump’s new term, Bitcoin has become a playground for institutional investors. Retail traders seem less interested, as BTC’s high price is out of reach for many. Instead, they hold fewer BTC and allocate more capital to altcoins, particularly meme coins.
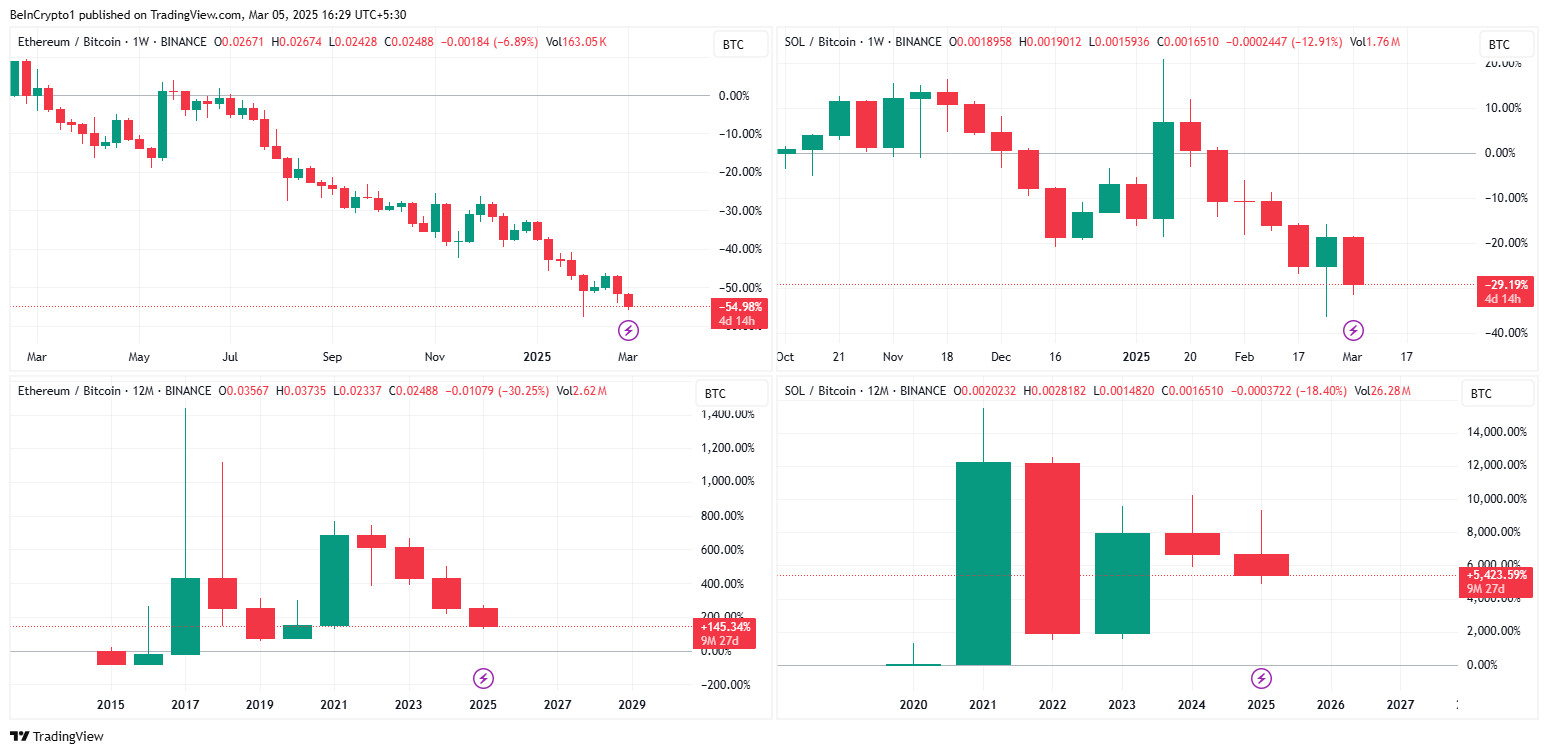
Furthermore, trading Altcoin/BTC pairs exposes traders to two risks simultaneously—the volatility of both altcoins and Bitcoin. Even the most liquid pairs, such as ETH/BTC and SOL/BTC, have shown prolonged downtrends and high volatility, increasing the risk of losses.
Volatility of ETH/BTC and SOL/BTC. Source: TradingView
Market analysts also tend to focus on Altcoin/USDT spot pairs, leaving Altcoin/BTC pairs with less attention.
According to CoinMarketCap data, USDT’s daily trading volume exceeds $115 billion, out of a total market trading volume of $147 billion. This confirms that USDT remains the primary channel for traders seeking opportunities.