The U.S. Securities and Exchange Commission (SEC) has formally acknowledged the filing for Fidelity’s spot Solana (SOL) Exchange-Traded Fund (ETF).
This marks a key development in the financial industry, as Fidelity seeks to list its Solana ETF on the Cboe BZX Exchange. The acknowledgment comes after Fidelity submitted a proposed rule change, paving the way for the potential approval of the product.
Fidelity’s Spot Solana ETF Proposal
The SEC’s acknowledgment follows Fidelity’s filing to list and trade shares of the Fidelity Solana Fund under the Cboe BZX Exchange. The proposed rule change, initially submitted on March 25, was later amended on April 1, 2025, to clarify certain points and add additional details.
The amended proposal aims to list the Solana ETF under BZX Rule, which pertains to commodity-based trust shares. According to the Cboe BZX Exchange, Fidelity plans to register the shares with the SEC through a registration statement on Form S-1.
Fidelity’s experience with crypto ETFs, having launched the Fidelity Wise Origin Bitcoin Fund (FBTC) and the Fidelity Ethereum Fund (FETH), has prepared it for this new initiative. FBTC has drawn substantial interest, accumulating nearly $17 billion in assets, while FETH currently manages around $975 million.
This Is A Developing News, Please Check Back For More
Magic Eden (ME), an established Solana (SOL)-based NFT marketplace, announced on Tuesday, during the mid-North American session, that it intends to launch a crypto wallet for Trump fans. According to an X post, Magic Eden announced that crypto enthusiasts can join the free waitlist for a chance to win a share of $1 million in $TRUMP.
According to the official website for the trumpwallet powered by Magic Eden, the project partnered with the Official Trump memecoin, which is backed by U.S. President Donald Trump.
“Yes! This is the Official $TRUMP Wallet by President Trump. Magic Eden partnered with GetTrumpMemes.com to create the first and only $TRUMP Wallet. Have Fun,” the FAQ noted.
An Epic Denial From Eric Trump
As soon as the news for the Trumpwallet launch hit major headlines, Eric Trump, the Executive Vice President of the Trump Organization, announced that he knew nothing about such a partnership with Magic Eden.
The announcement created more confusion among the crypto community, with some accusing Magic Eden of orchestrating a large-scale scam.
Following the announcement, Magic Eden’s native token rallied over 28 percent to reach a daily local high of about $1.15. However, the ME’s rally was short-lived as the token retraced towards $1 at the time of this writing, following the denial announcement by Eric Trump.
The demand for ME tokens, nonetheless, experienced a sharp uptick as shown by its daily average trading volume, which hovered about $192 million compared to its market cap of around $154 million.
The post Eric Trump Denies Family Involvement of an Alleged Trump Wallet By Magic Eden (ME) appeared first on Coinpedia Fintech News
Magic Eden (ME), an established Solana (SOL)-based NFT marketplace, announced on Tuesday, during the mid-North American session, that it intends to launch a crypto wallet for Trump fans. According to an X post, Magic Eden announced that crypto enthusiasts can join the free waitlist for a chance to win a share of $1 million in …
Bitcoin (BTC) is poised to reach significant price milestones in 2025, backed by optimistic forecasts from Matrixport, Willy Woo, and other institutions.
With support from ETFs and a positive market sentiment, Bitcoin is a speculative asset and a promising long-term investment option. However, if the profitable supply exceeds 90%, the market must remain cautious of potential corrections.
Numerous Positive On-Chain Metrics
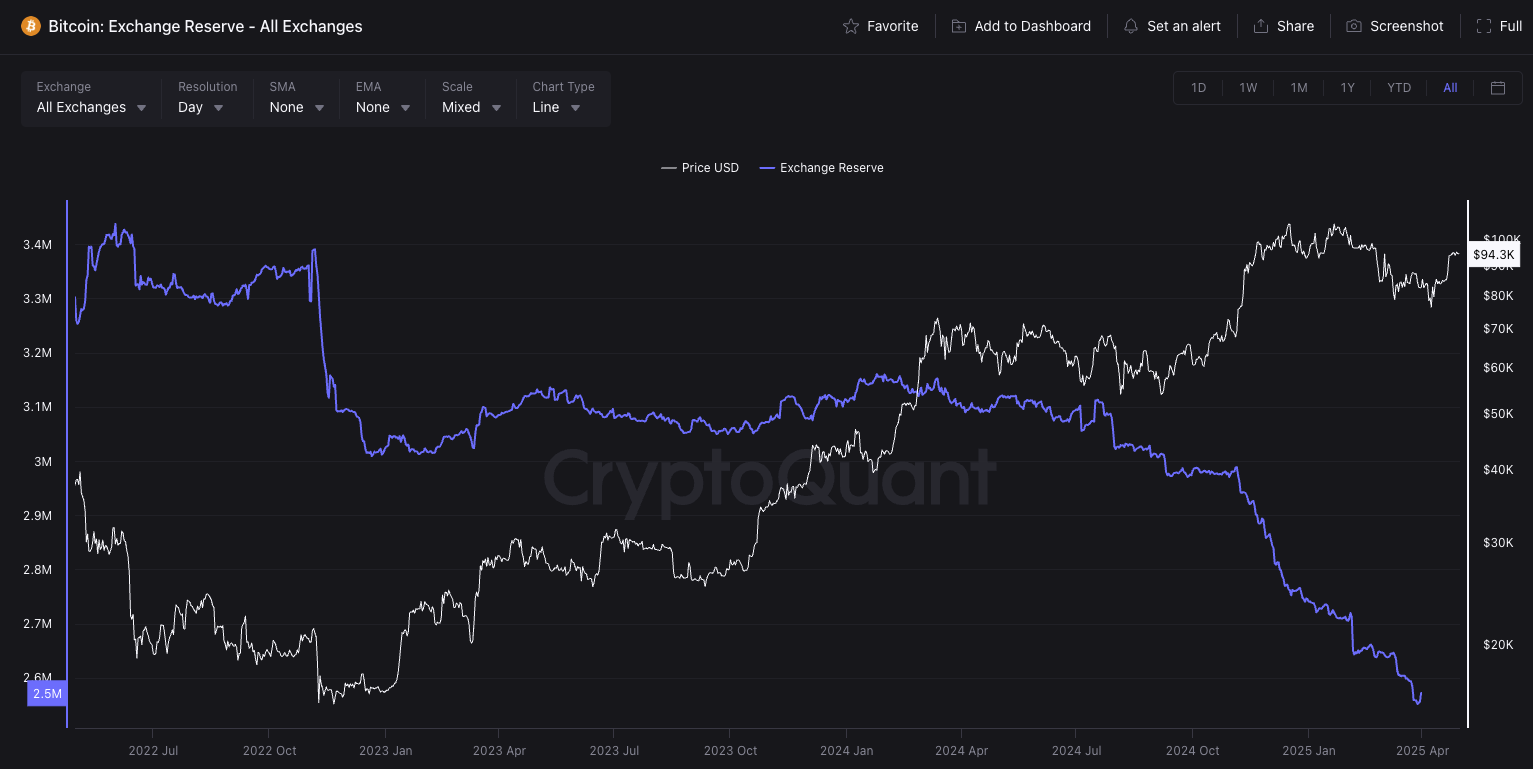
The Bitcoin market is showing encouraging signs as the supply on centralized exchanges (CEX) has dropped to a 7-year low. According to data from CryptoQuant, only about 2.492 million BTC remain on exchanges. This is a sharp drop from 2.488 million BTC, recorded on the previous Friday.
Moreover, CryptoQuant reports that the percentage of Bitcoin’s supply in profit has surpassed 85%, a historically high figure. However, they caution that if this ratio exceeds 90%, the market may enter a “historic euphoria” phase and face a correction. This suggests that while the current metrics are favorable, vigilance is required to navigate potential volatility.
Over the past seven days, Coinglass data recorded approximately 56,164.88 BTC being withdrawn from CEX platforms. This indicates that investors are accumulating and reducing selling pressure, which is often seen as a bullish signal. A reduced supply on exchanges lowers selling pressure, paving the way for price growth.
Additionally, new capital inflow into the market is rising. According to a CoinShares report, $3.2 billion poured into Bitcoin funds in the last week of April 2025. These factors are bolstering confidence that Bitcoin could soon hit significant price targets.
Experts’ Optimistic Forecasts for BTC
Amid a generally optimistic market outlook, numerous experts and organizations have expressed positivity regarding BTC’s price. Matrixport, a reputable crypto service platform, asserts that Bitcoin’s upward momentum is gaining strength.
In its latest analysis, Matrixport indicated that Bitcoin is approaching the $106,000 resistance level, with a strong likelihood of breaking through this mark soon. Previously, Matrixport had predicted that new capital inflows into the market would propel Bitcoin past the $100,000 threshold.
Willy Woo, a renowned analyst in the crypto industry, also shared an optimistic view on X. He believes that Bitcoin’s fundamentals have shifted to a bullish state, with the market likely to either move sideways or rise slowly in the coming period.
“BTC fundamentals have turned bullish, not a bad setup to break all-time highs,” he stated.
Woo emphasized that the “bullish ascending triangle” pattern he previously mentioned is forming, signaling a potential strong upward move if Bitcoin breaks through the resistance level.
Furthermore, a Coinness report revealed that 45.4% of South Korean investors believe Bitcoin will outperform gold in the next six months. It reflects strong confidence from a key Asian market.
Additionally, as reported by BeInCrypto, ARK Invest predicts that Bitcoin’s price could reach $2.4 million by 2030, driven by the growth of Bitcoin ETFs and increasing adoption by financial institutions. These long-term forecasts further reinforce the belief that Bitcoin’s potential extends far beyond the $100,000 mark, with significant growth prospects in the future.
Dogecoin price remains much-eyed by crypto traders and investors as whale accumulations for the meme coin spiked recently. A renowned market analyst revealed on Wednesday that DOGE whales accumulated 180 million coins amid the ongoing broader market flux.
As a response, investors now anticipate a highly bullish price outlook amid rising buying pressure. Further, top analysts also conveyed a highly bullish forecast for the token amid strong market technicals, with one even revealing that a 5x rally looms.
Dogecoin Price Bullish? Here’s Why Whale Data Sparks Optimism
According to analyst Ali Martinez’s X post on March 5, DOGE whales purchased a whopping 180 million coins in the last 24 hours. The analyst’s data suggests that the accumulations occurred as the Dogecoin price fluxed near the $0.2 price level intraday.
Source: Ali Charts, X
For context, rising whale accumulations signal heightened market interest, underscoring the asset’s potential for gains. Moreover, it’s also noteworthy that whales reflected a potential ‘buy-the-dip’ sentiment amid broader volatility.
Why The Broader Turbulence?
Notably, weekly and monthly Dogecoin price charts showcase a 6% and 19% dip, respectively. This waning action is attributable to a market bloodbath in February due to macro heat and liquidity hurdles.
Traders and investors panic sold risk assets amid Donald Trump’s new import tariffs on China, Canada & Mexico, which kicked off on March 4. In turn, global markets took heat amid trade war speculations. BTC price slumped from a $99K level high to as low as the $78K mark amid this market pressure. In turn, even altcoins (including meme coins) followed.
Nevertheless, CoinGape reported that the crypto market showed resilience as BTC and altcoins reversed previous losses just a day after Trump’s tariffs kicked off.
DOGE Price Jumps 3%
DOGE price today soared over 3% intraday and exchanged hands at $0.1990. The meme coin bottomed and peaked at $0.1837 and $0.2036 in the past 24 hours. Today’s rising action falls in line with the broader market trend that shows traders and investors are digesting trade war tensions.
Top Analysts Convey Bullish Outlook
Simultaneously, top crypto analysts have taken the stage to inject optimism into the meme coin. Analyst ‘Trader Tardigrade’ recently revealed that Dogecoin price follows ‘Mean Reversion on macro chart.’ This phenomenon suggests that the price is likely to return to its long-term historical average as time longs. The analyst spotlighted this concept via the price chart below, with DOGE exhibiting “Mean Reversion along the yellow dotted line on the chart.”
Source: Trader Tardigrade, X
Also, the analyst revealed that the meme coin’s price daily candle closed with a ‘Dragonfly Doji.’ This pattern suggests that Dogecoin’s price is currently at the bottom of a downtrend, indicating that a reversal, and thus gains loom.
Source: Trader Tardigrade, X
On the other hand, renowned trader ‘Chandler’ revealed on X that DOGE’s MVRV ratio formed a bearish divergence against price in previous cycles. However, this phenomenon has yet to occur in this cycle, paving an optimistic path for price ahead.
Source: Chandler, X
In addition, market expert CryptoELlTES revealed on X that the meme coin’s price is gearing up for 5x gains ahead, solidifying investor optimism amid rising DOGE whale activity and strong pattern formations. It’s noteworthy that with DOGE ETF approval odds gaining substantial weight in recent days, market sentiments over a 5x rally remain uplifted.