The National Consumer Disputes Redressal Commission (NCDRC) has dismissed a lawsuit filed against WazirX over a ₹2000 crore hack. The court ruled that there is no established legal framework for cryptocurrency-related issues in India. As a result, the case against the crypto exchange was thrown out, highlighting the regulatory gap surrounding cryptocurrency in the country. This decision marks a significant moment in the ongoing debate over crypto regulations in India.
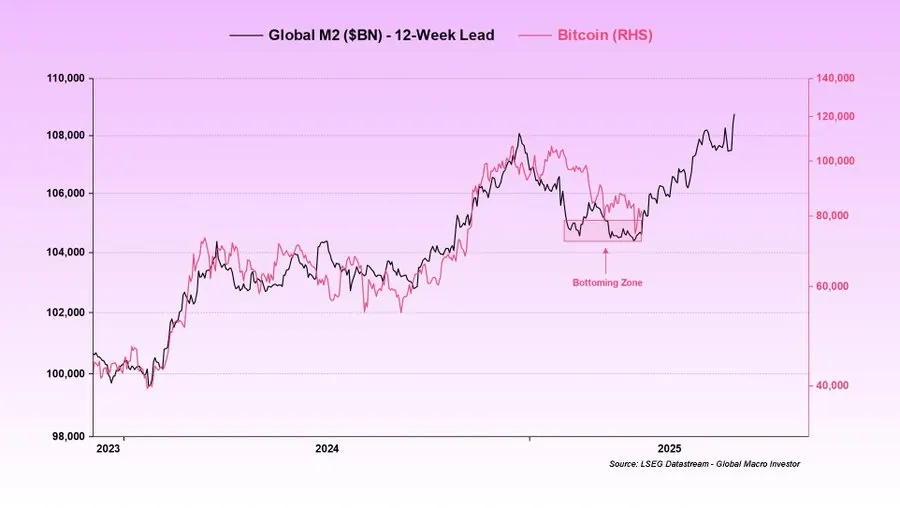
A macroeconomic chart reveals that the M2 Money Supply is starting to rise again. Historical market patterns suggest that there is a correlation between the M2 Money Supply index and the Bitcoin price index. Crypto market watchers are now eyeing a potential all-time high for Bitcoin within this quarter, if historical correlations between M2 and crypto prices hold true. Here is what you should know.
M2 Money Supply on the Rise: What It Means
Analysing M2 is a way economists use to track all the money that is easily available in an economy. M1 is the most basic form of money, which includes cash and checking accounts. M2 is a broader measure, which includes everything in M1 plus savings accounts, money market accounts and certificates of deposit.
A macroeconomic chart, shared on X by renowned crypto analyst Michael van de Poppe, shows that the M2 money supply is starting to rise again.
A sharp rise in the M2 money supply implies that there is a significant increase in the amount of easily accessible money in the economy.
Historical Correlation Between M2 and Bitcoin Prices
Historical market patterns indicate that there is a correlation between the M2 money supply index and the BTC price index.
Last time, while Bitcoin was inching towards an all-time high, the US was preparing to witness a political shift.
It was on January 20, hours before Trump’s inauguration, that the BTC market crossed the crucial $109K mark. Since January 21, the BTC market has declined by over 19.28%.
This crypto analyst also warns that if BTC rises with M2 supply, the global economy could see several unusual developments: decreasing bond yields, falling gold prices, declining dollar index, increasing CNH/USD, and rising altcoins.
The US 5-year Bond Yield sits at 4.021%, 10-year at 4.384%, 20-year at 4.862%, and 30-year at 4.821%. Since the start of this month, especially after the announcement of Trump’s tariffs, all these bond markets have seen steady growth.
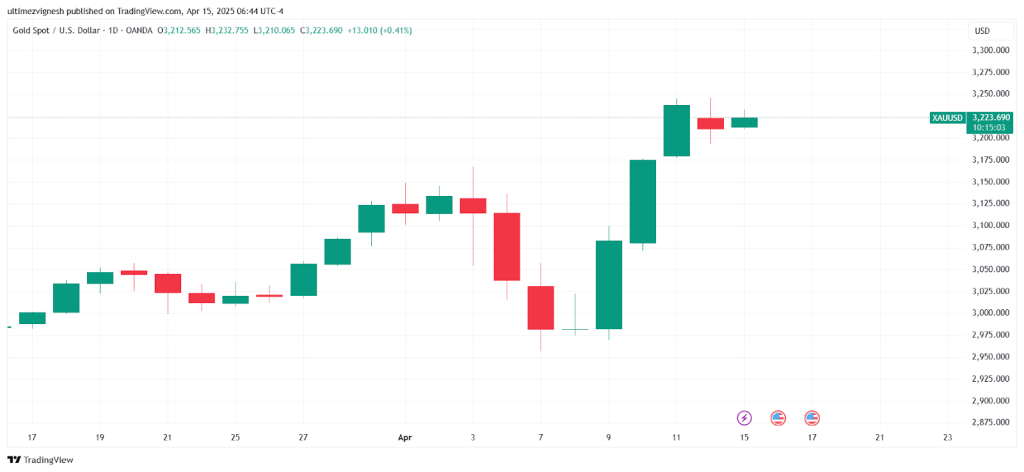
Similarly, the Gold Spot market, which is currently priced at $3,222.885, has grown significantly during the period. On April 11, the market even touched an ATH of $3,244.
In conclusion, while a rising M2 supply brings renewed optimism for Bitcoin and the broader crypto market, investors must remain cautious. Correlations can shift and macroeconomic events may change course quickly. As analysts warn of ripple effects across asset classes, it is crucial to monitor the evolving data closely, Whether this is the start of a new rally or a temporary spike, the coming weeks will be decisive for BTC’s direction.
Never Miss a Beat in the Crypto World!
Stay ahead with breaking news, expert analysis, and real-time updates on the latest trends in Bitcoin, altcoins, DeFi, NFTs, and more.
The post How High Can Bitcoin Price Go? Exploring the Correlation Between M2 and Bitcoin appeared first on Coinpedia Fintech News
A macroeconomic chart reveals that the M2 Money Supply is starting to rise again. Historical market patterns suggest that there is a correlation between the M2 Money Supply index and the Bitcoin price index. Crypto market watchers are now eyeing a potential all-time high for Bitcoin within this quarter, if historical correlations between M2 and …
A total of 230 million XRP, worth more than $498 million, has left the wallet associated with Ripple to an unnamed wallet. The movement was brought to X by Whale Alert and has drawn the attention of many cryptocurrency enthusiasts. The Large Transfer Causes Excitement About Ripple’s Next Actions It is recorded on the Ripple
After a strong rally, the crypto market is finally cooling down. In the last 24 hours, the market cap has slipped by 2.43%, now standing at $3.35 trillion. At the same time, trading activity picked up, with volumes jumping to $184.7 billion as traders rushed to react to the latest market moves.
Possible Reasons Behind The Dip Today
Macroeconomic Factors:
On the macro side, the market sentiment was hit after a second US court blocked President Trump’s proposed tariffs. In addition, Treasury Secretary Bessent confirmed that trade talks with China have stalled — adding uncertainty to global markets, including crypto.
Fear & Greed Index Signals ‘Greed’ at 61:
The crypto Fear & Greed Index remains at 61 (Greed). Historically, markets tend to cool down after extended periods of greed-driven rallies, and today’s decline fits that pattern.
Bitcoin’s Short-Term Weakness:
Bitcoin, the market leader, has dipped to a nine-day low of $104,684. Analysts said that Bitcoin is currently flashing short-term warning signals as it liquidates long positions. The market is cooling off after weeks of upward momentum, and technical indicators like the Super Trend remain green but are starting to slow in bullish momentum.
Ethereum faced rejection from a major resistance zone once again, pulling its price down by over 3.6% in the past 24 hours to trade around $2,609. A slowing MACD on the 3-day timeframe also hints at weakening bullish momentum, raising concerns of a possible bearish crossover in the coming weeks.
Altcoins Slip Into The Red Zone
Solana (SOL) dropped by 4.79%, while Cardano (ADA) slipped 5.73%. Dogecoin (DOGE) also took a hit, falling 6.76%. BNB was down by 2.47%, and XRP declined by 3.37%. Even newer coins like Sui (SUI) weren’t spared, with a 4.06% dip. Stablecoins like USDT and USDC stayed mostly flat, as expected.
Never Miss a Beat in the Crypto World!
Stay ahead with breaking news, expert analysis, and real-time updates on the latest trends in Bitcoin, altcoins, DeFi, NFTs, and more.
The post Why Is Crypto Going Down Today? appeared first on Coinpedia Fintech News
After a strong rally, the crypto market is finally cooling down. In the last 24 hours, the market cap has slipped by 2.43%, now standing at $3.35 trillion. At the same time, trading activity picked up, with volumes jumping to $184.7 billion as traders rushed to react to the latest market moves. Possible Reasons Behind …