Cardano’s native token, ADA, is facing a notable price drop amid market uncertainty, mirroring the downturn seen across major cryptocurrencies. The volatility has shaken investor confidence, triggering millions of dollars in liquidations across both long and short positions.
For the past few days, the overall cryptocurrency market has witnessed a price surge followed by a drop. This pattern has been ongoing for the last couple of weeks, leaving investors and traders confused.
Current Price Momentum
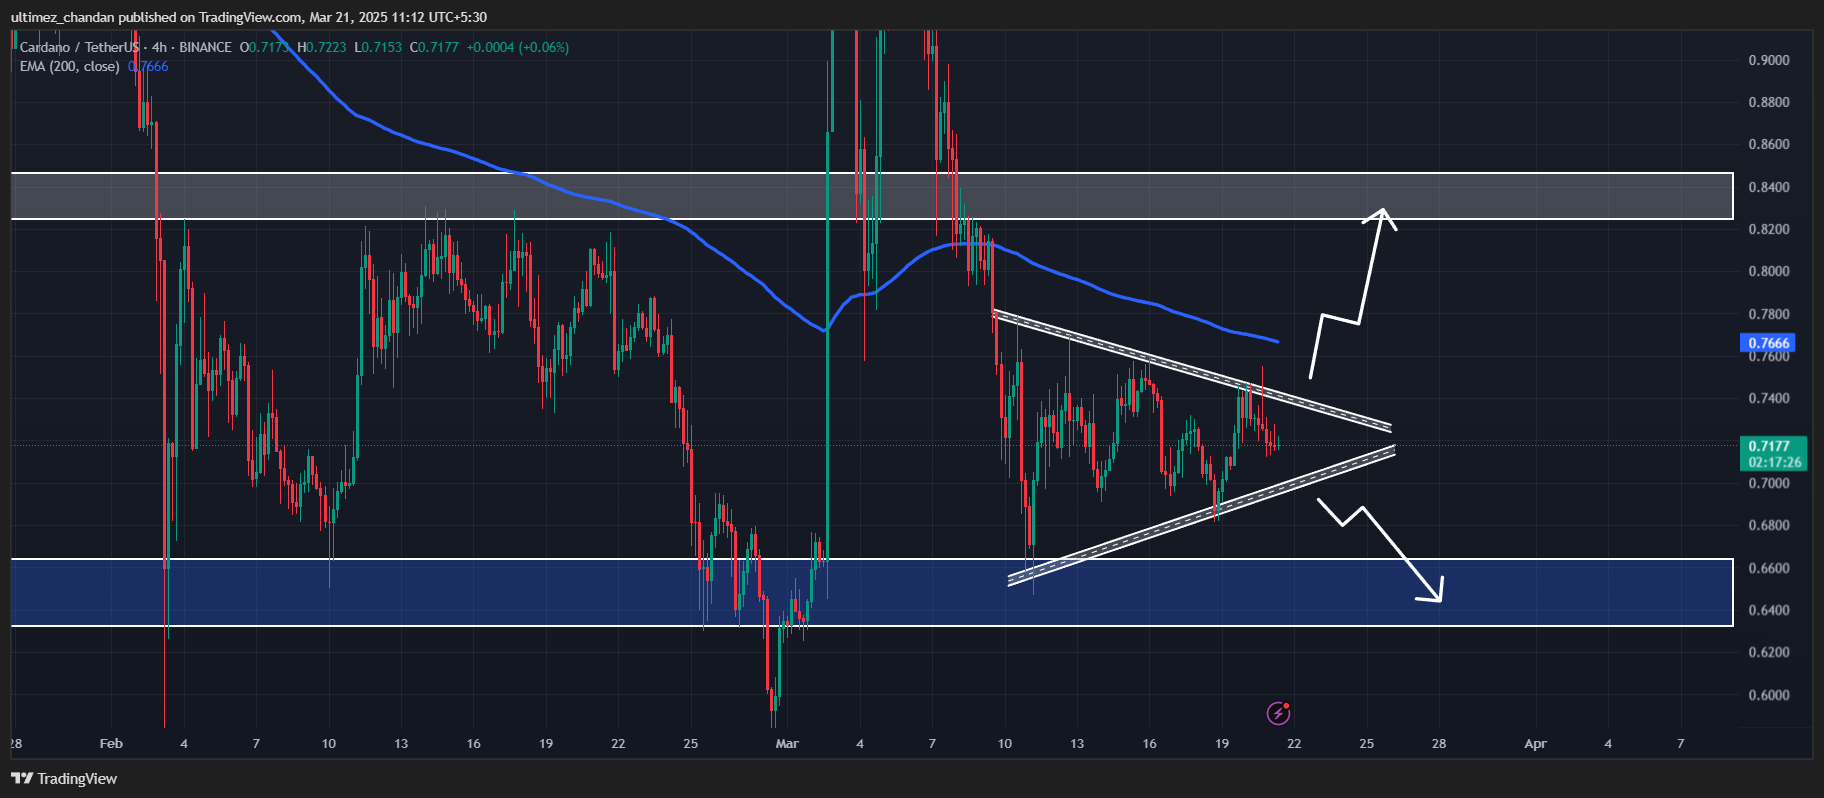
ADA is currently trading near $0.72 and has recorded a 2% price drop in the past 24 hours. However, during the same period, its trading volume declined by 25%, indicating lower participation from traders and investors compared to the previous day.
Cardano (ADA) Technical Analysis and Upcoming Levels
With notable price fluctuations in recent days, ADA appears to be forming a symmetrical triangle pattern on the four-hour timeframe.
Source: Trading View
Based on the recent price momentum, if the asset breaks out of the pattern and closes a four-hour candle above the $0.74 level, there is a strong possibility it could soar by 13% to reach $0.83 in the near future.
Besides this short-term price prediction, if the asset breaks down from the pattern and falls below $0.70, it could decline to the crucial support level of $0.65 in the coming days.
Based on expert analysis, a potential breakout or breakdown will determine the price direction in the coming days.
Major Liquidation Areas
At press time, traders seem to be strongly betting on the bearish side, as reported by the on-chain analytics firm Coinglass. Data reveals that traders are currently over-leveraged at $0.71, with $2.61 million worth of long positions. Meanwhile, $0.73 is another over-leveraged level, where traders have built $4.20 million worth of short positions.
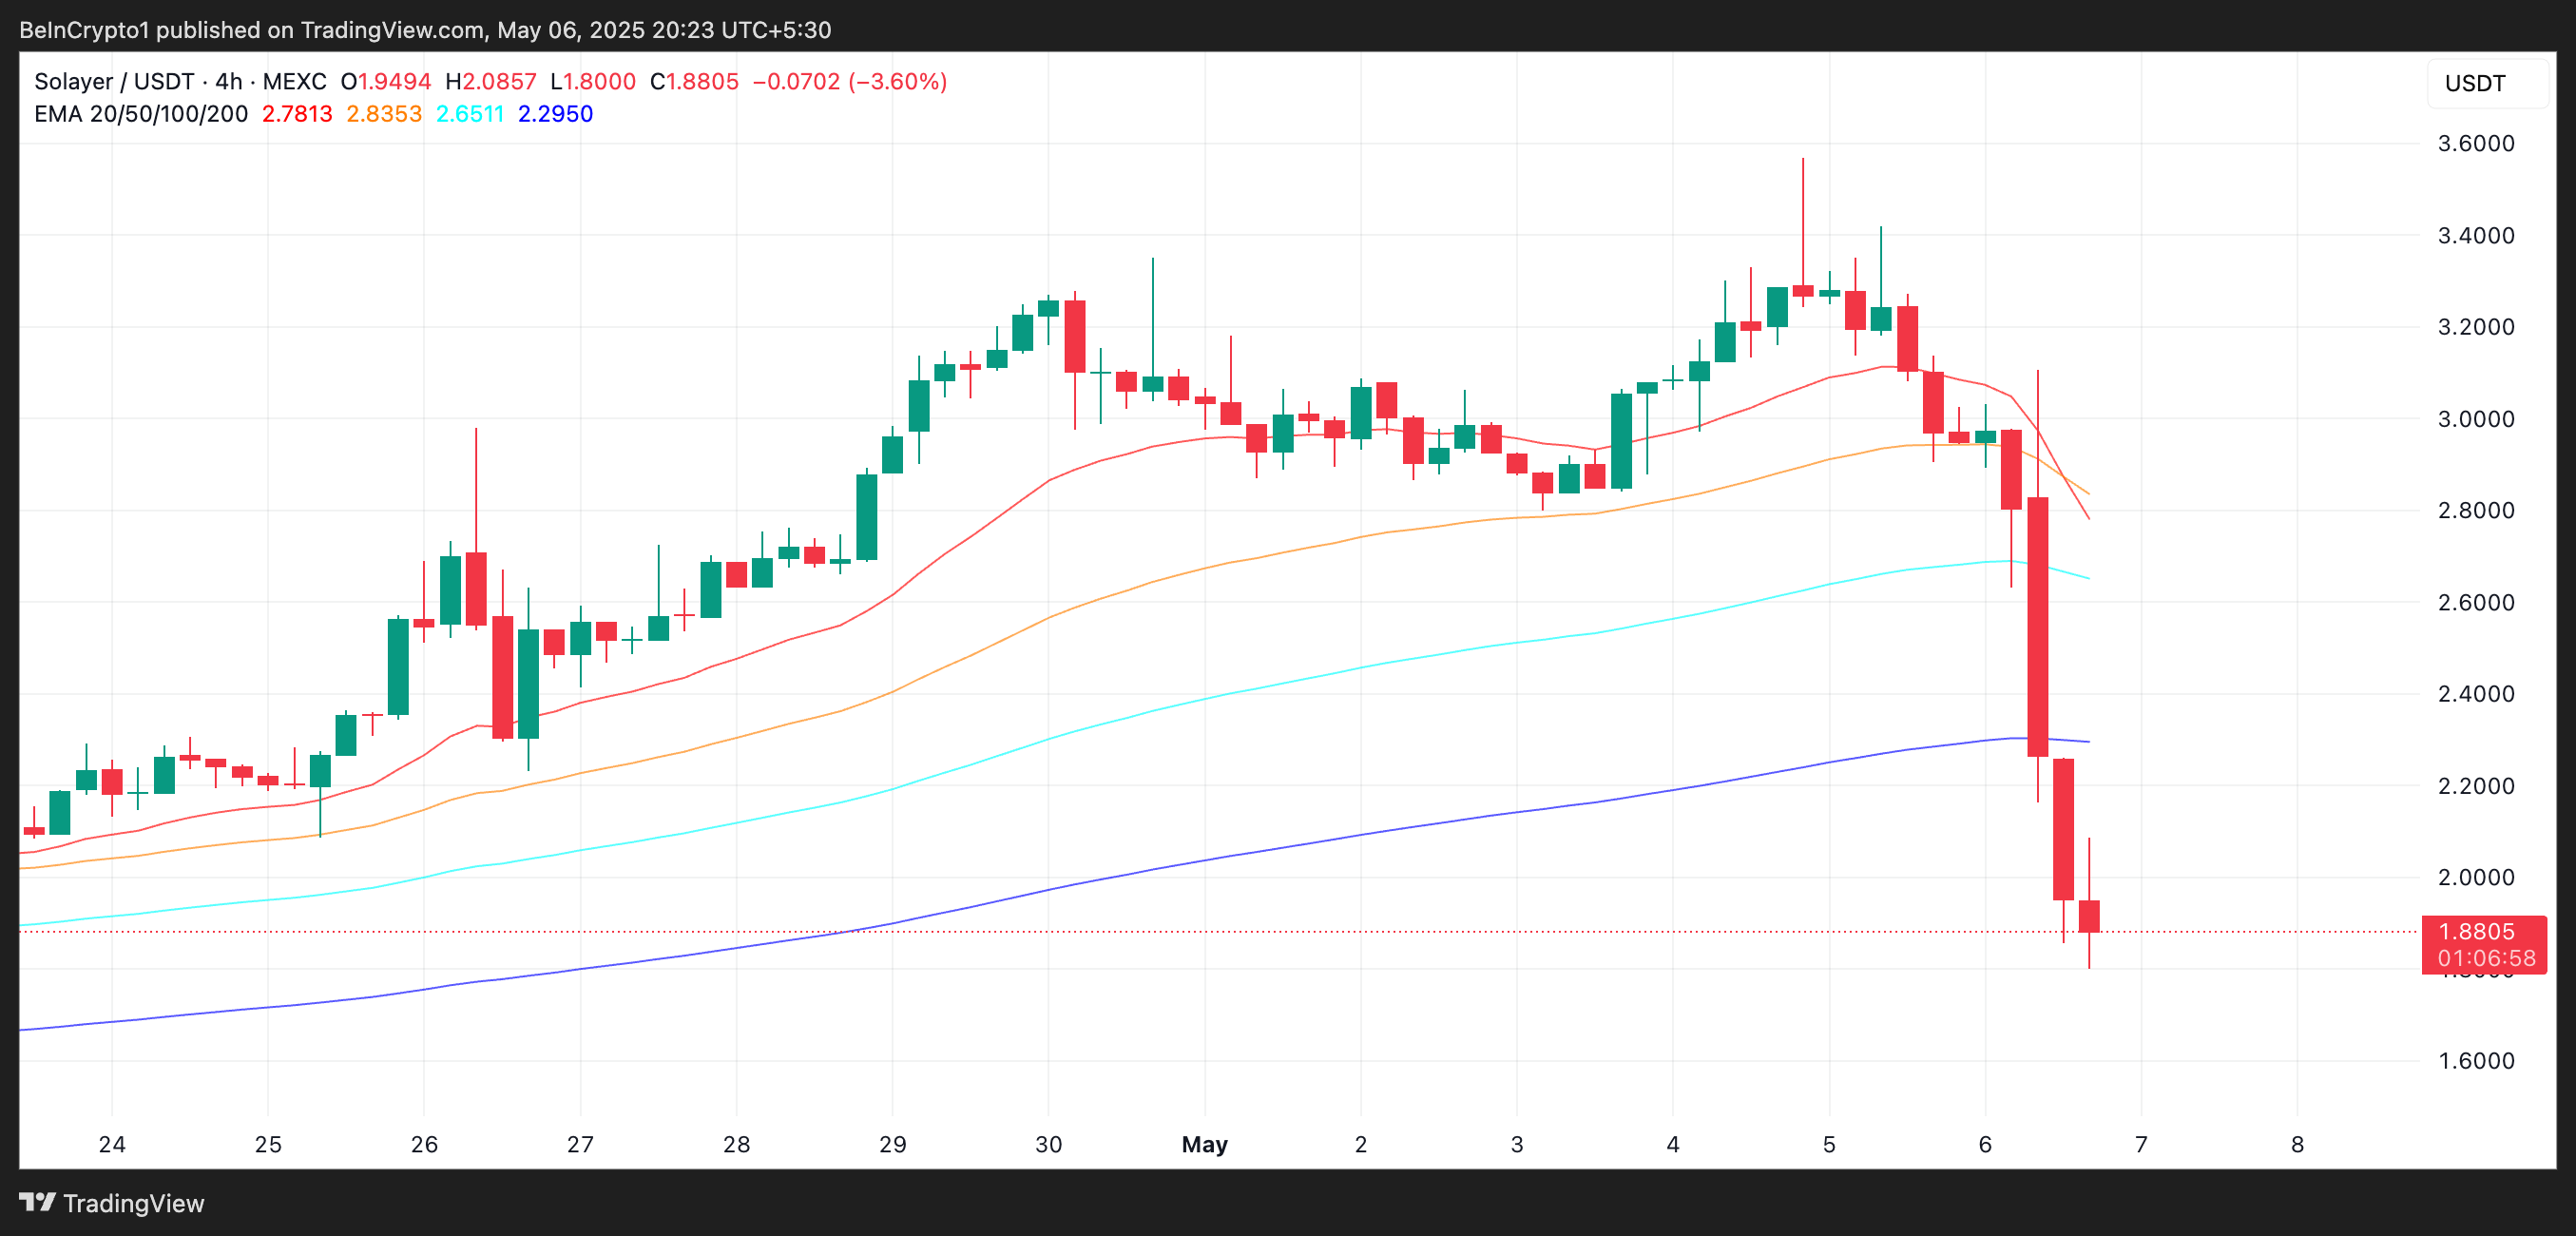
Solayer (LAYER) is under intense pressure after a sudden 45% crash wiped out weeks of bullish momentum. Once up 460% since February, the token trades below $1.70 as traders scramble to understand what triggered the collapse.
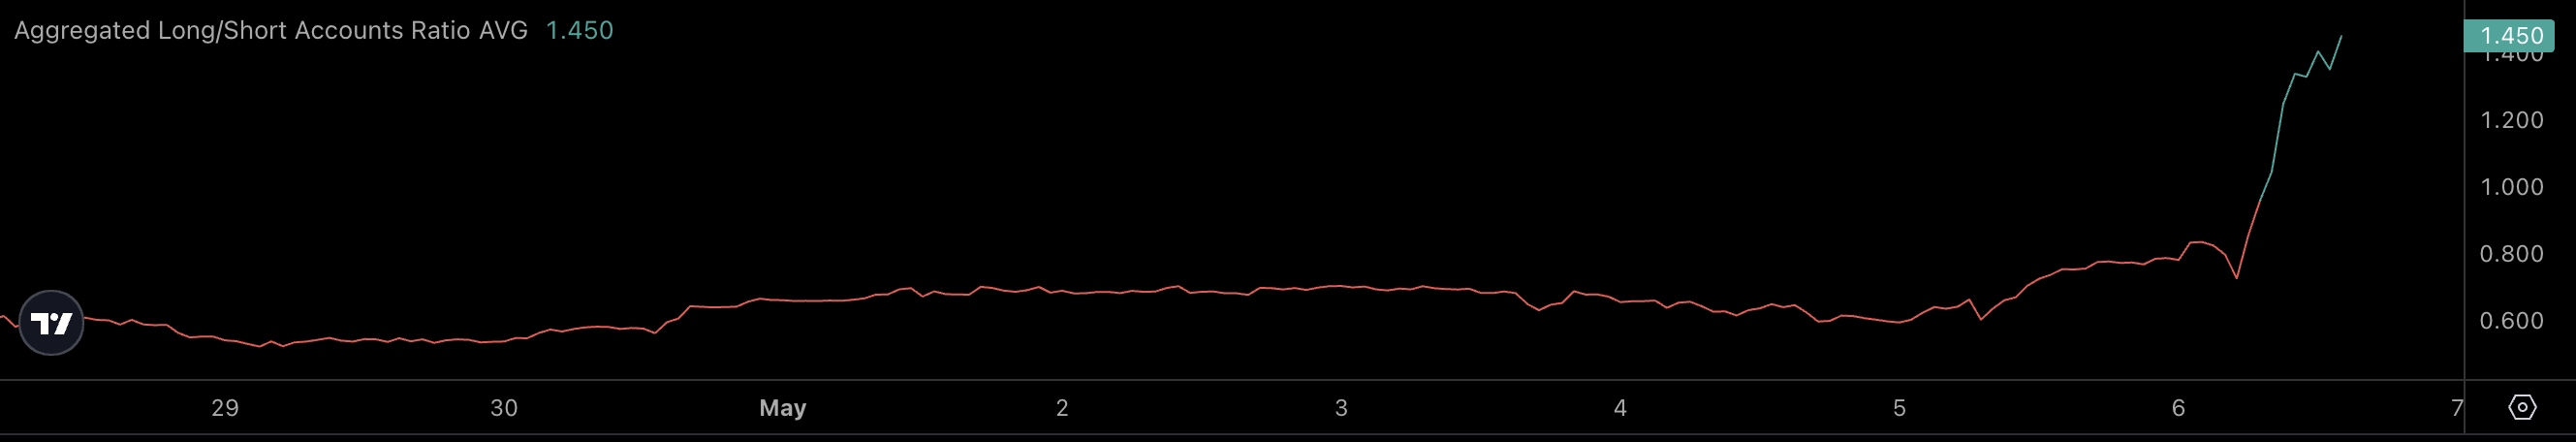
The altcoin lost nearly $350 million in market cap in this crash. With volatility rising and the long/short ratio now at 1.45, the market appears divided between those expecting a rebound and those bracing for further downside.
Solayer Loses Nearly $350 Million Market Cap – What’s Behind the Drop?
LAYER has plunged roughly 35% in just 24 hours, falling from nearly $3.10 to $1.90, leaving the community scrambling for answers. This sharp drop comes despite Solayer’s strong fundamentals—it’s the first hardware-accelerated blockchain designed to offload operations onto programmable chips, aiming for over 1 million TPS and 100 Gbps bandwidth.
The project also offers real-world utility through its Solayer Emerald Card, which allows users to spend USDC seamlessly via Visa, with support for Apple Pay and Google Pay.
From February 18 to May 5, LAYER surged 460%, making it one of the best-performing altcoins of the year—until the sudden crash disrupted momentum.
Right now, confusion reigns. Some blame market makers for triggering a cascade of liquidations, others accuse the founders of shady practices, while a few point to the daily 110,600 LAYER token unlocks.
However, those daily unlocks account for just $219,000 in value—hardly enough to justify a $250 million+ loss in market cap. What’s more concerning is the upcoming major unlock on May 11, when 26.5 million LAYER (worth about $51 million) will be released.
If market sentiment doesn’t recover before then, this influx of supply could intensify selling pressure and potentially push the price even lower.
LAYER Crash Deepens: $3.2 Million in Long Liquidations Fuel Panic
LAYER’s long/short ratio sat at 0.78 over the past 24 hours, with 56.14% of traders positioned short—reflecting rising bearish sentiment.
Around $3.2 million in long liquidations were triggered, more than double the $1.5 million in short liquidations. This forced selling likely accelerated the drop from $3.10 to $1.90, as liquidation cascades compounded the pressure.
Aggregated Long/Short Accounts Ratio AVG. Source: Coinalyze.
With the upcoming May 11 token unlock, the unwind of leveraged positions became a key driver of the crash.
While the long/short ratio has since flipped to 1.45—indicating that more traders are now positioning for a rebound—the lack of order book depth remains a concern. In such environments, price volatility can remain elevated regardless of whether sentiment shifts back to bullish.
Longs Pile In as LAYER Struggles Below $1.90
LAYER’s outlook remains highly uncertain as its price struggles to hold above $1.90 following a steep decline.
Traders and investors are still seeking clarity on the cause of the crash, while sentiment remains fragile ahead of the May 11 token unlock.
In this context, the current long/short ratio of 1.45 reveals an important shift—more traders are now betting on a rebound, with 59.2% of positions long versus 40.8% short.
This rising long bias may suggest that some believe the worst is over, especially after an aggressive selloff.
However, it also introduces new risk: if LAYER fails to recover and drops further, these newly opened long positions could be liquidated just like before—potentially setting off another wave of forced selling.
The crypto market is witnessing some cautious declines today, with the total market capitalization dropping below $2.9 trillion. Major tokens like Bitcoin and Ethereum slipped, driven by profit-taking and market consolidation. Meanwhile, the POL (Prev. MATIC) price has been showing strong bullish momentum and has delivered an impressive performance today. This validates its growing relevance within the market, which may help the MATIC price to keep up the bullish trend.
The POL price surged over 14% to $0.2529, breaking the key resistance on strong volume amid bullish sentiment. This upward momentum follows a volatile month for POL, which plunged to a 30-day low of $0.1533 in the first week of April before staging a dramatic rebound. The current price action not only marks a striking short-term gain but also signals a potential end to the prolonged downtrend that defined the POL since December 2024.
Why POL Price is Rising? WIll it Reach $1 in 2025?
The rally was catalyzed by the announcement of the Agglayer Breakout Program, which aims to incentivize POL staking through project airdrops. This has increased the activity within the ecosystem and also the demand for the token has risen significantly. Technically, POL broke out above a critical resistance zone near $0.22, which had capped prices during weeks of accumulation. Therefore, this decisive move, supported by a rise in volume and open interest, suggests a genuine shift in the market sentiment, which could initiate a 30% to 40% rise.
As seen in the above chart, the POL price has broken above the descending trend line but failed to secure levels above $0.257, which is an important resistance level. The crypto attempted to surpass the upper band of the Gaussian channel that could have validated the beginning of a bullish trend. However, the bears restricted the move, but the MACD formation suggests the upswing may continue as the levels are heading back to the positive range for the first time in 2025.
Therefore, the POL (Prev. MATIC) price is expected to close the day’s trade above $0.257, which could validate the bullish divergence. Some overbought signals may prompt short-term volatility, but the token’s reversal from recent lows and a rise in the trader’s attention suggest the POL price could enter a new bullish phase soon.
The post Should You Be Bullish on POL (Prev. MATIC) Price? Will It Ever Reach $1? appeared first on Coinpedia Fintech News
The crypto market is witnessing some cautious declines today, with the total market capitalization dropping below $2.9 trillion. Major tokens like Bitcoin and Ethereum slipped, driven by profit-taking and market consolidation. Meanwhile, the POL (Prev. MATIC) price has been showing strong bullish momentum and has delivered an impressive performance today. This validates its growing relevance …
Ethereum (ETH) is entering a critical week, with technical signals, on-chain data, and a major upgrade all converging. The Pectra Upgrade, set for May 7, aims to improve staking and wallet functionality, but short-term volatility is likely during the rollout.
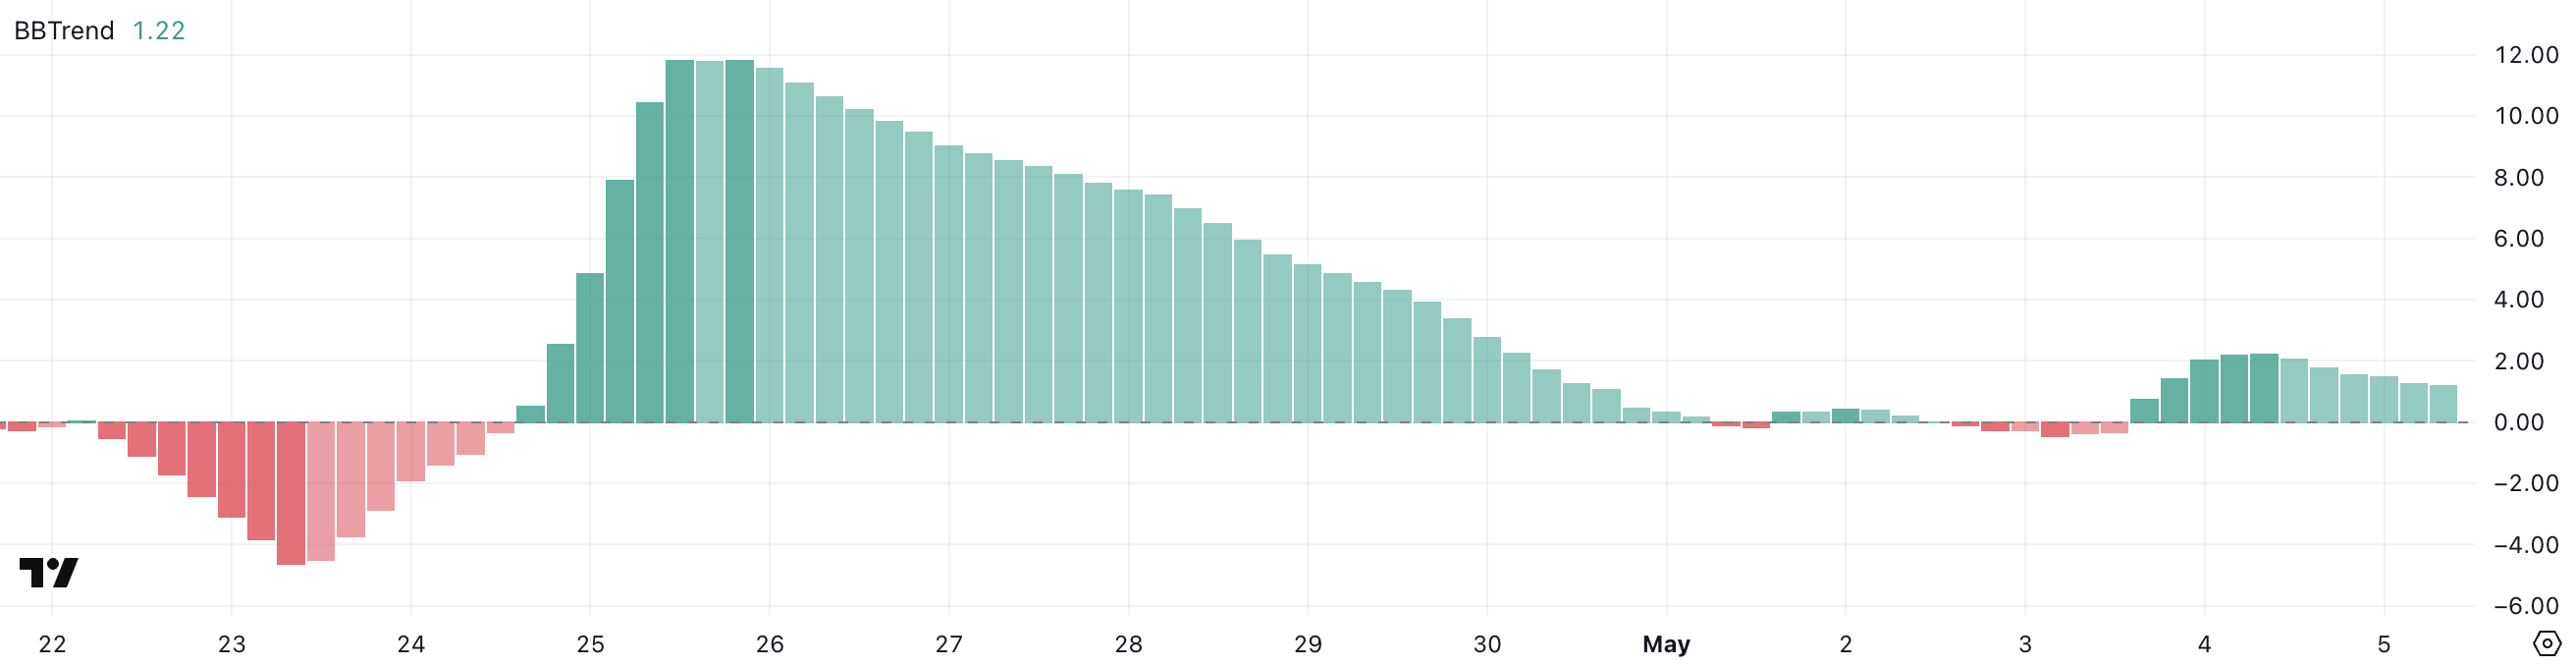
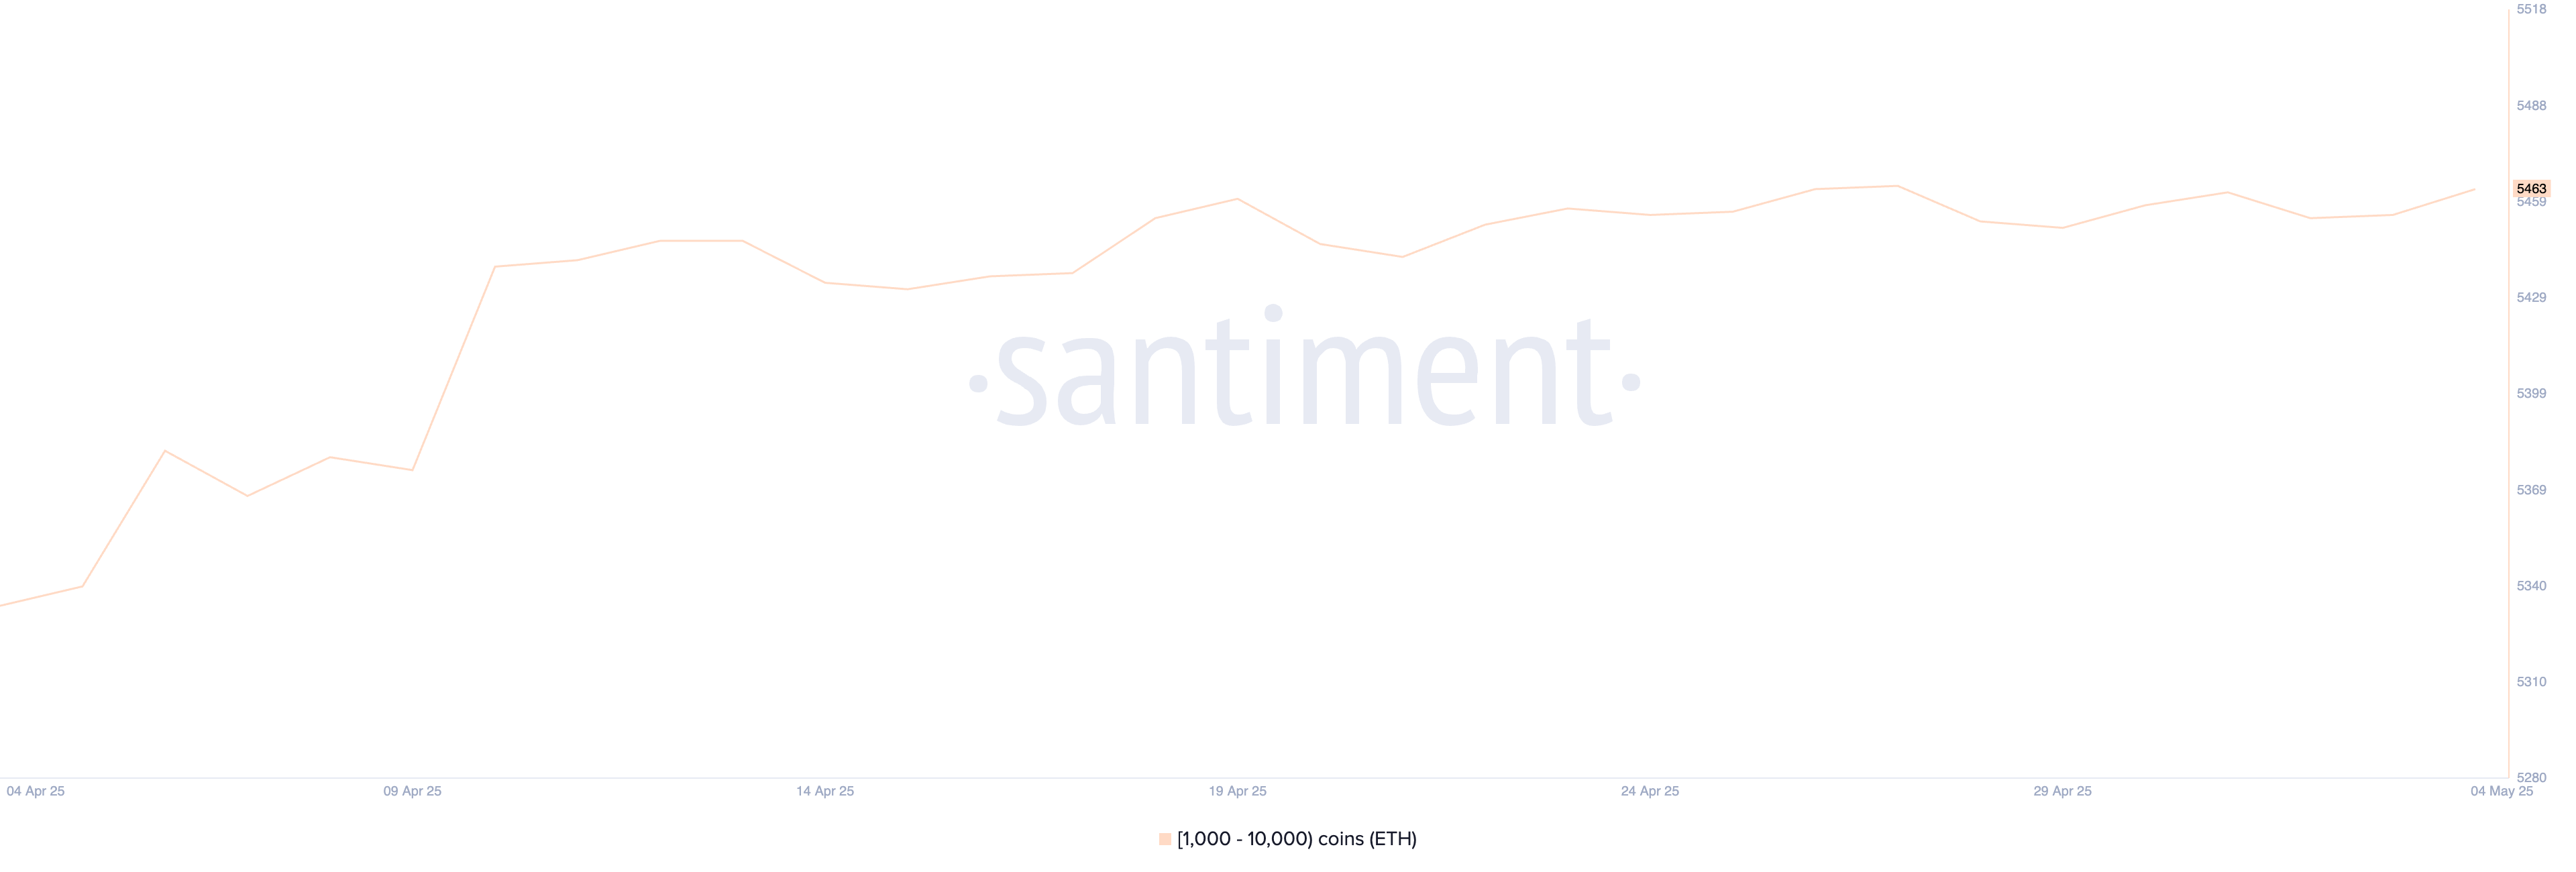
Meanwhile, ETH’s BBTrend sits at 1.22, showing early bullish momentum, though not yet strong enough to confirm a breakout. At the same time, whale activity remains near 5,463 addresses, and price continues to trade in a tight range between $1,828 and $1,749—setting the stage for a potential breakout or breakdown.
Ethereum Pectra Upgrade Set for May 7: What to Expect
Ethereum’s highly anticipated Pectra Upgrade is set to go live on May 7, introducing 11 new Ethereum Improvement Proposals (EIPs). EIP-7251 stands out for raising the staking cap from 32 ETH to 2048 ETH, aiming to streamline validator operations and boost staking efficiency.
The upgrade also includes wallet improvements focused on user experience, such as easier recovery and gasless transactions, which could drive broader dApp adoption. While this may increase ETH demand long term, exchanges could temporarily halt ETH transfers during deployment, causing short-term volatility.
Though the upgrade promises significant enhancements, it has already faced multiple delays due to extended testing on networks like Hoodi and Sepolia. A smooth rollout may boost confidence and price, but any technical issues could trigger negative market reactions.
ETH Trend Signal at 1.22: Early Uptrend or Just Noise?
Ethereum’s BBTrend indicator is at 1.22, signaling a mild bullish bias. Over the past day, the BBTrend reached a high of 2.23, showing stronger momentum before pulling back slightly.
Although the current reading has cooled, it remains positive, suggesting the uptrend is not yet invalidated. Traders are watching whether BBTrend can rise again to confirm renewed strength or if momentum continues to fade.
The BBTrend (Band-Break Trend) is a volatility-based indicator designed to detect the strength and direction of price trends. Readings above 1.00 typically suggest a bullish trend, while readings below -1.00 indicate a bearish trend.
Values between -1.00 and 1.00 are considered neutral or trendless, signaling either sideways movement or weak conviction in either direction. The farther the BBTrend moves from zero, the stronger the trend, making values like 2.23 notable for trend confirmation.
However, it’s not a strong breakout level, meaning the price could still reverse if selling pressure increases or momentum fades.
A push back above 2.00 would likely confirm sustained bullish momentum, while a drop below 1.00 might indicate a return to consolidation or even a shift to bearish conditions.
Adding to the broader picture, the number of Ethereum whales—addresses holding between 1,000 and 10,000 ETH—currently stands at 5,463.
This number has fluctuated in recent weeks, struggling to break decisively higher. Whale activity is a critical on-chain signal, as these large holders often influence price movements through accumulation or distribution. A steady or rising whale count typically signals confidence and long-term accumulation, which could support ETH’s price in the coming weeks.
Conversely, a continued stall or drop in whale numbers may reflect hesitation among larger investors, potentially limiting upside momentum.
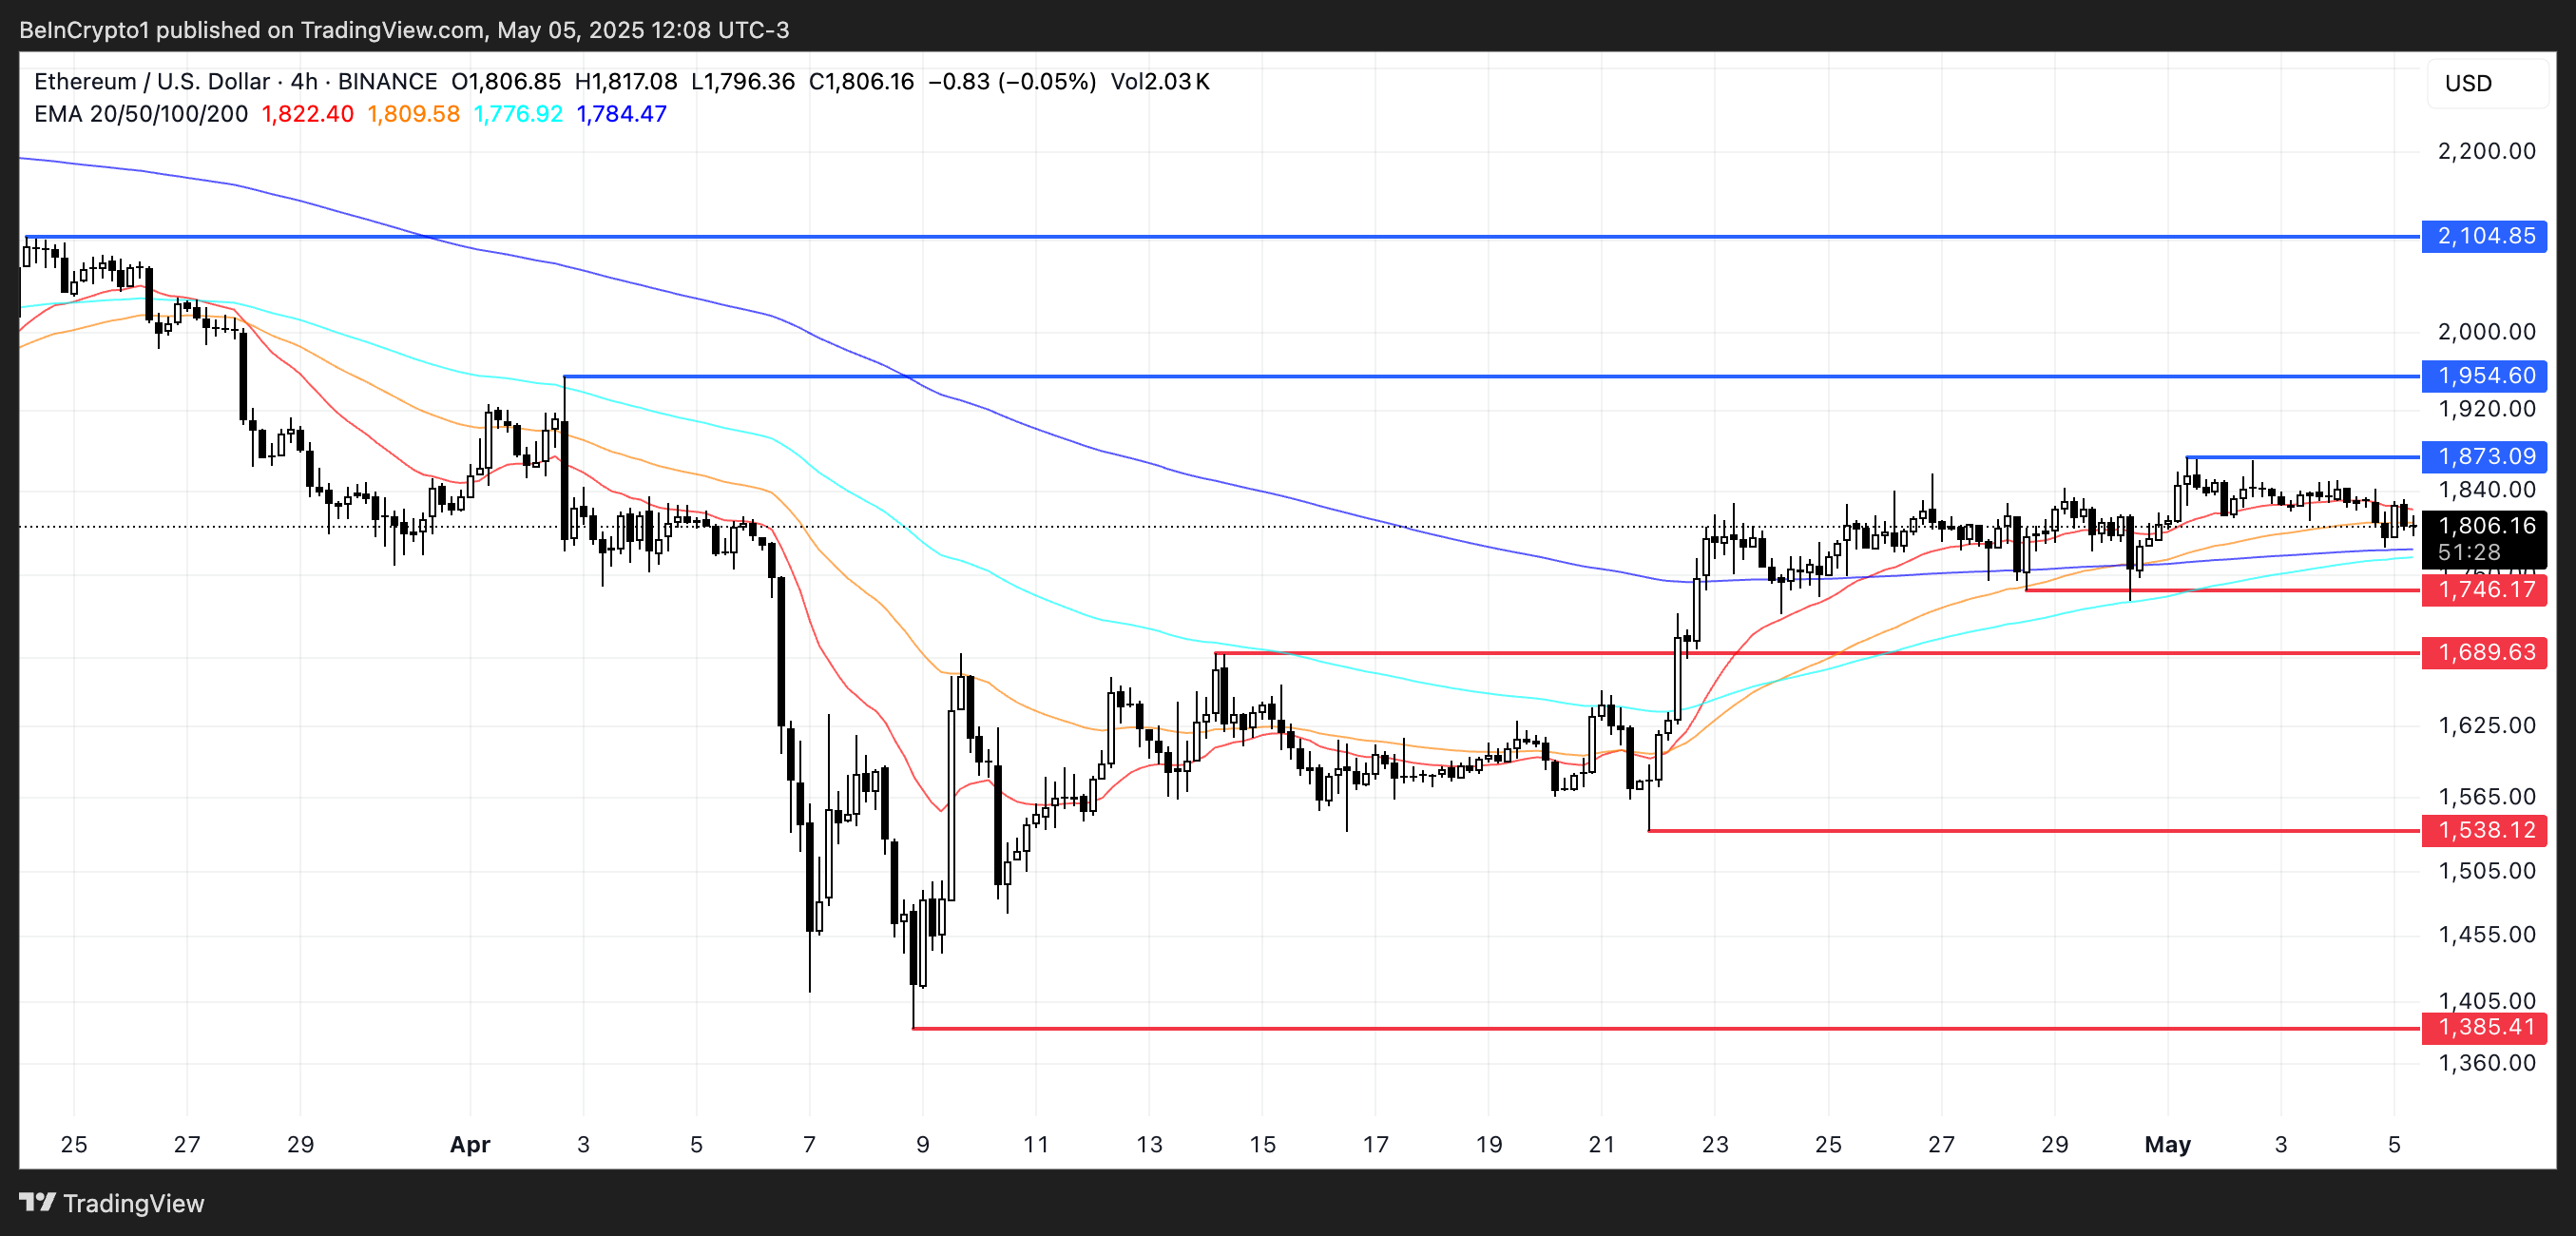
ETH Stuck in a Range as Traders Await Breakout or Breakdown
Ethereum price has traded between $1,828 resistance and $1,749 support since April 21. The range has held for over two weeks, showing market indecision.
The EMA lines remain bullish, with short-term averages still above long-term ones. However, they’re starting to converge, and a death cross could form soon.