Cardano has noted significant whale activity over the past 24 hours, aligning with the broader market recovery. During that period, the total crypto market capitalization has added another $50 billion, signaling renewed bullish momentum.
As bullish pressure strengthens, ADA appears poised to re-commence an upward trend.
Cardano Sees Heavy Whale Accumulation
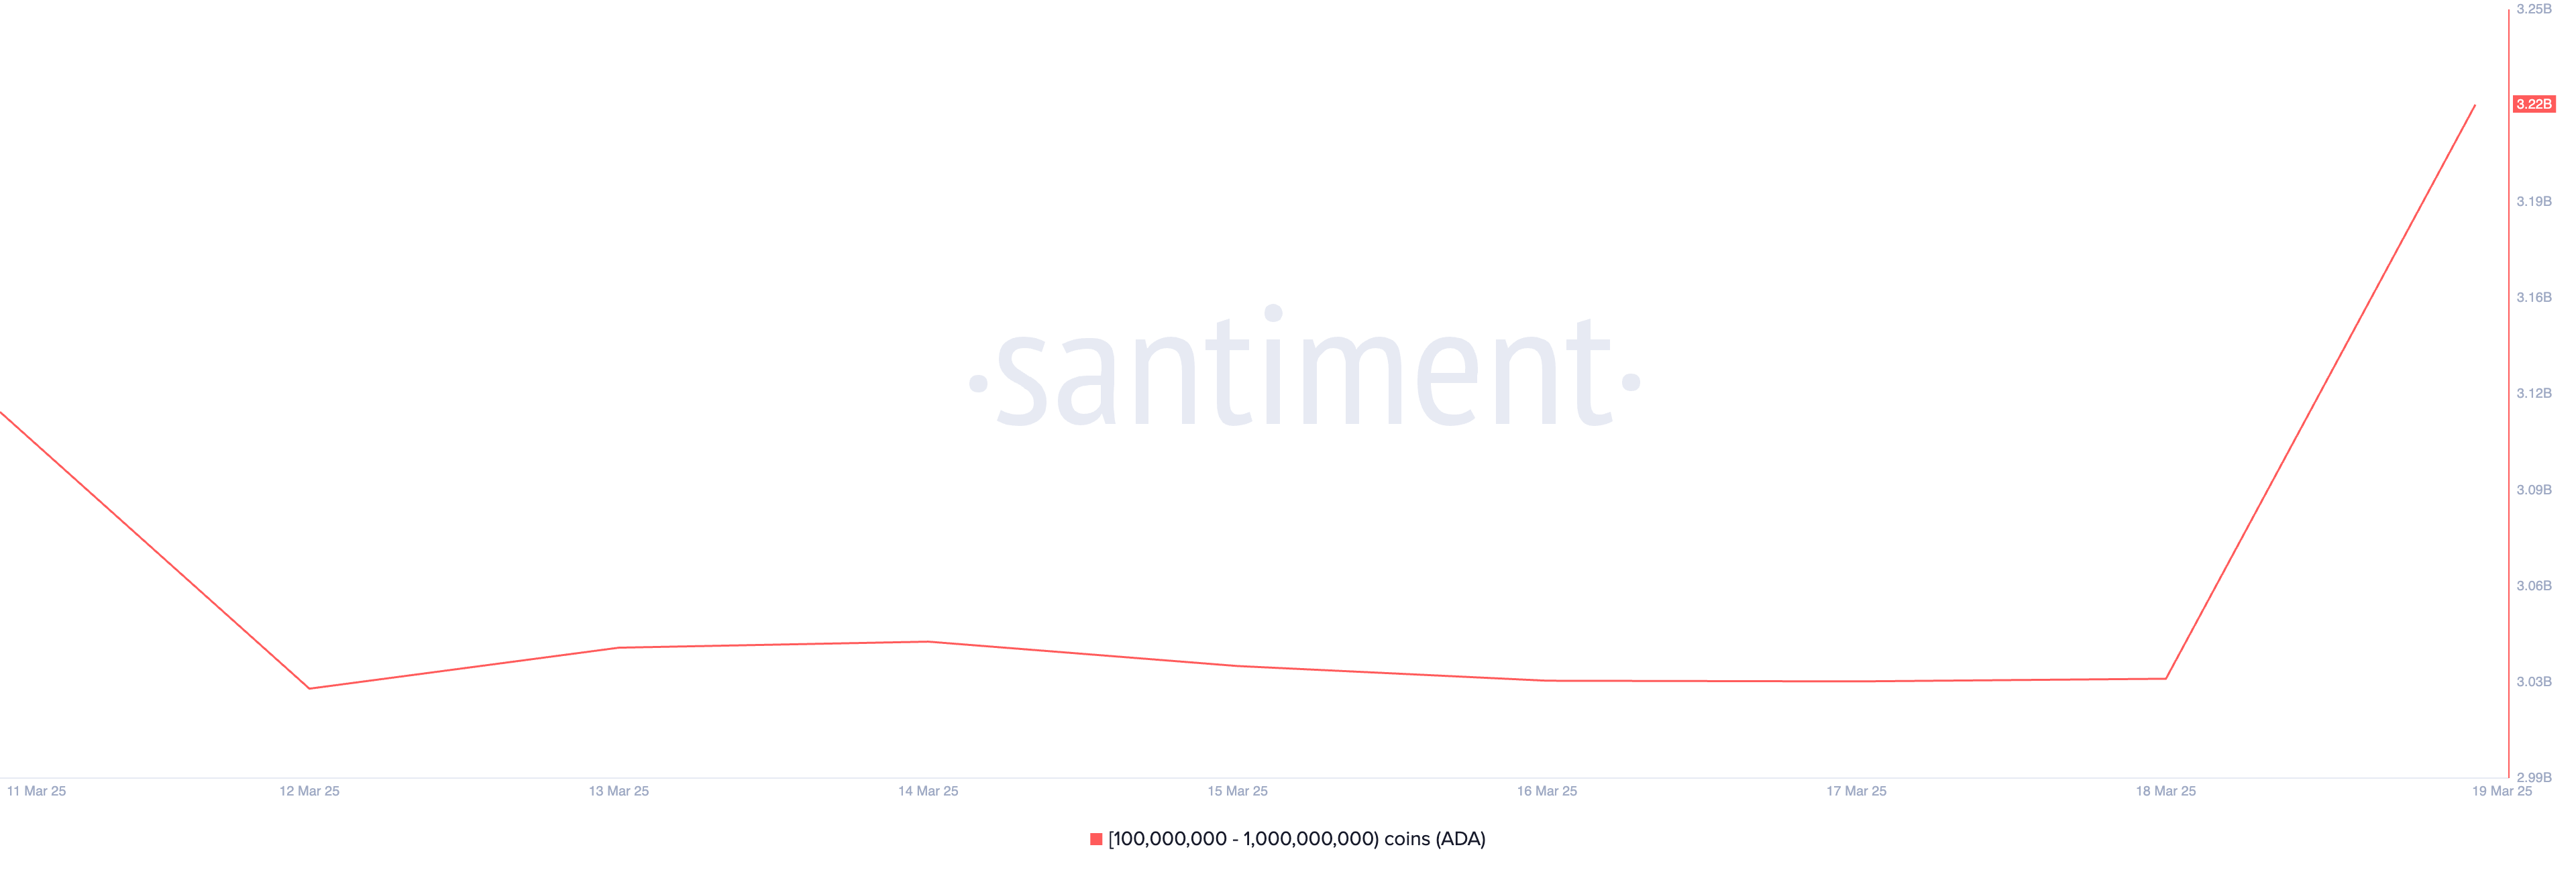
On-chain data shows that Cardano whales, holding between 100 million and 1 billion coins, have acquired 190 million ADA in the past 24 hours. This cohort of large ADA investors currently holds 3.22 billion coins.
When whales increase their coin holdings, it signals strong confidence in the asset’s future price potential.
Large-scale accumulation like this would reduce ADA’s available supply in the market, which can drive up its price if demand remains steady. The trend indicates a bullish outlook, as whales typically buy in anticipation of higher prices.
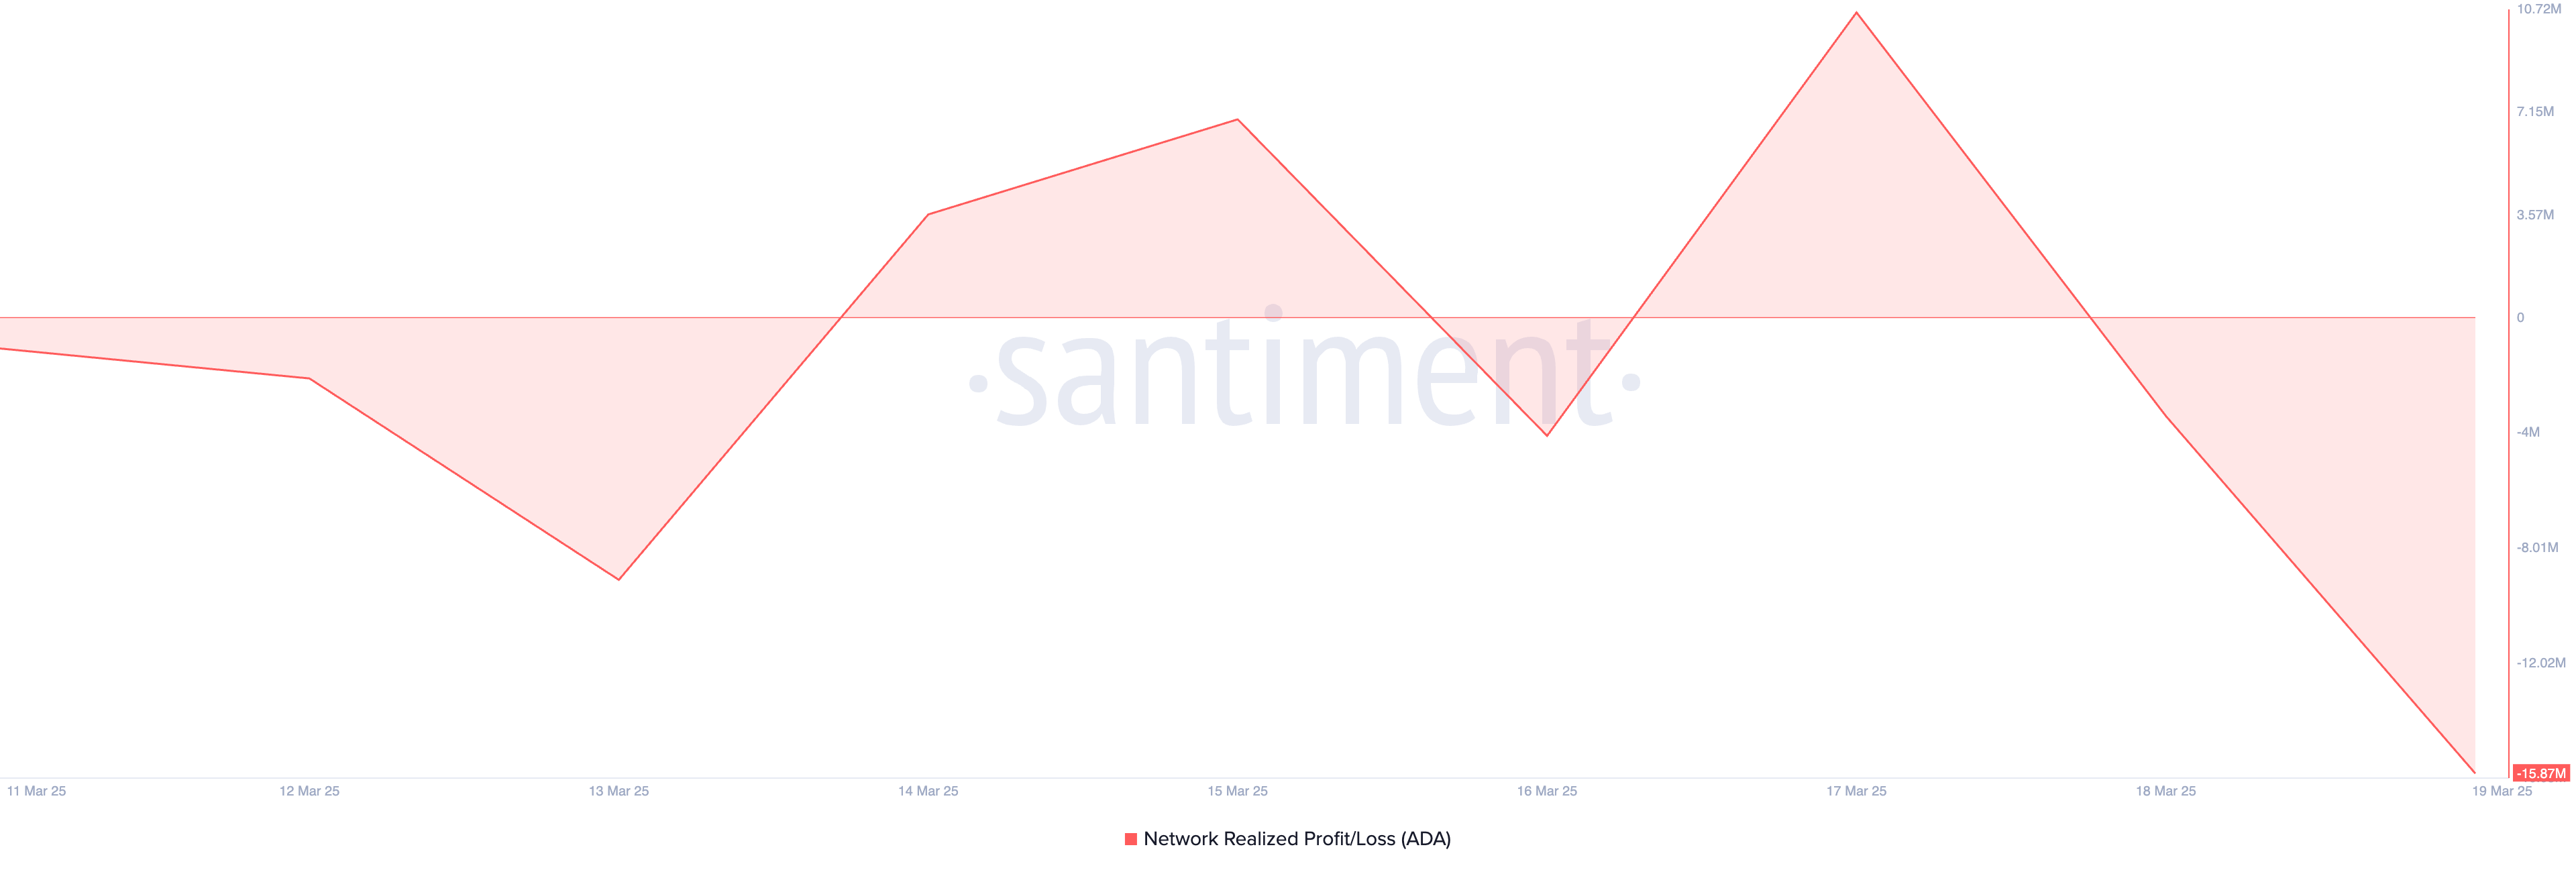
ADA’s Network Realized Profit/Loss (NPL) further supports this bullish outlook. At press time, it stands at -15.87 million.
This metric measures the net profit or loss of all coins moved on the blockchain depending on their acquisition cost. When an asset’s NPL is negative, many investors are holding at a loss.
This situation is known to reduce the selling pressure in the market, as traders may choose to hold their assets instead of realizing losses, which could support a potential price rebound.
The steady dip in ADA’s NPL indicates that many holders are sitting on unrealized losses. To avoid selling at a loss, they may choose to hold onto their investments, reducing selling pressure. The increased holding time could, in turn, drive up ADA’s price as supply tightens in the market.
ADA’s Buying Pressure Increases—Will It Fuel a Price Breakout?
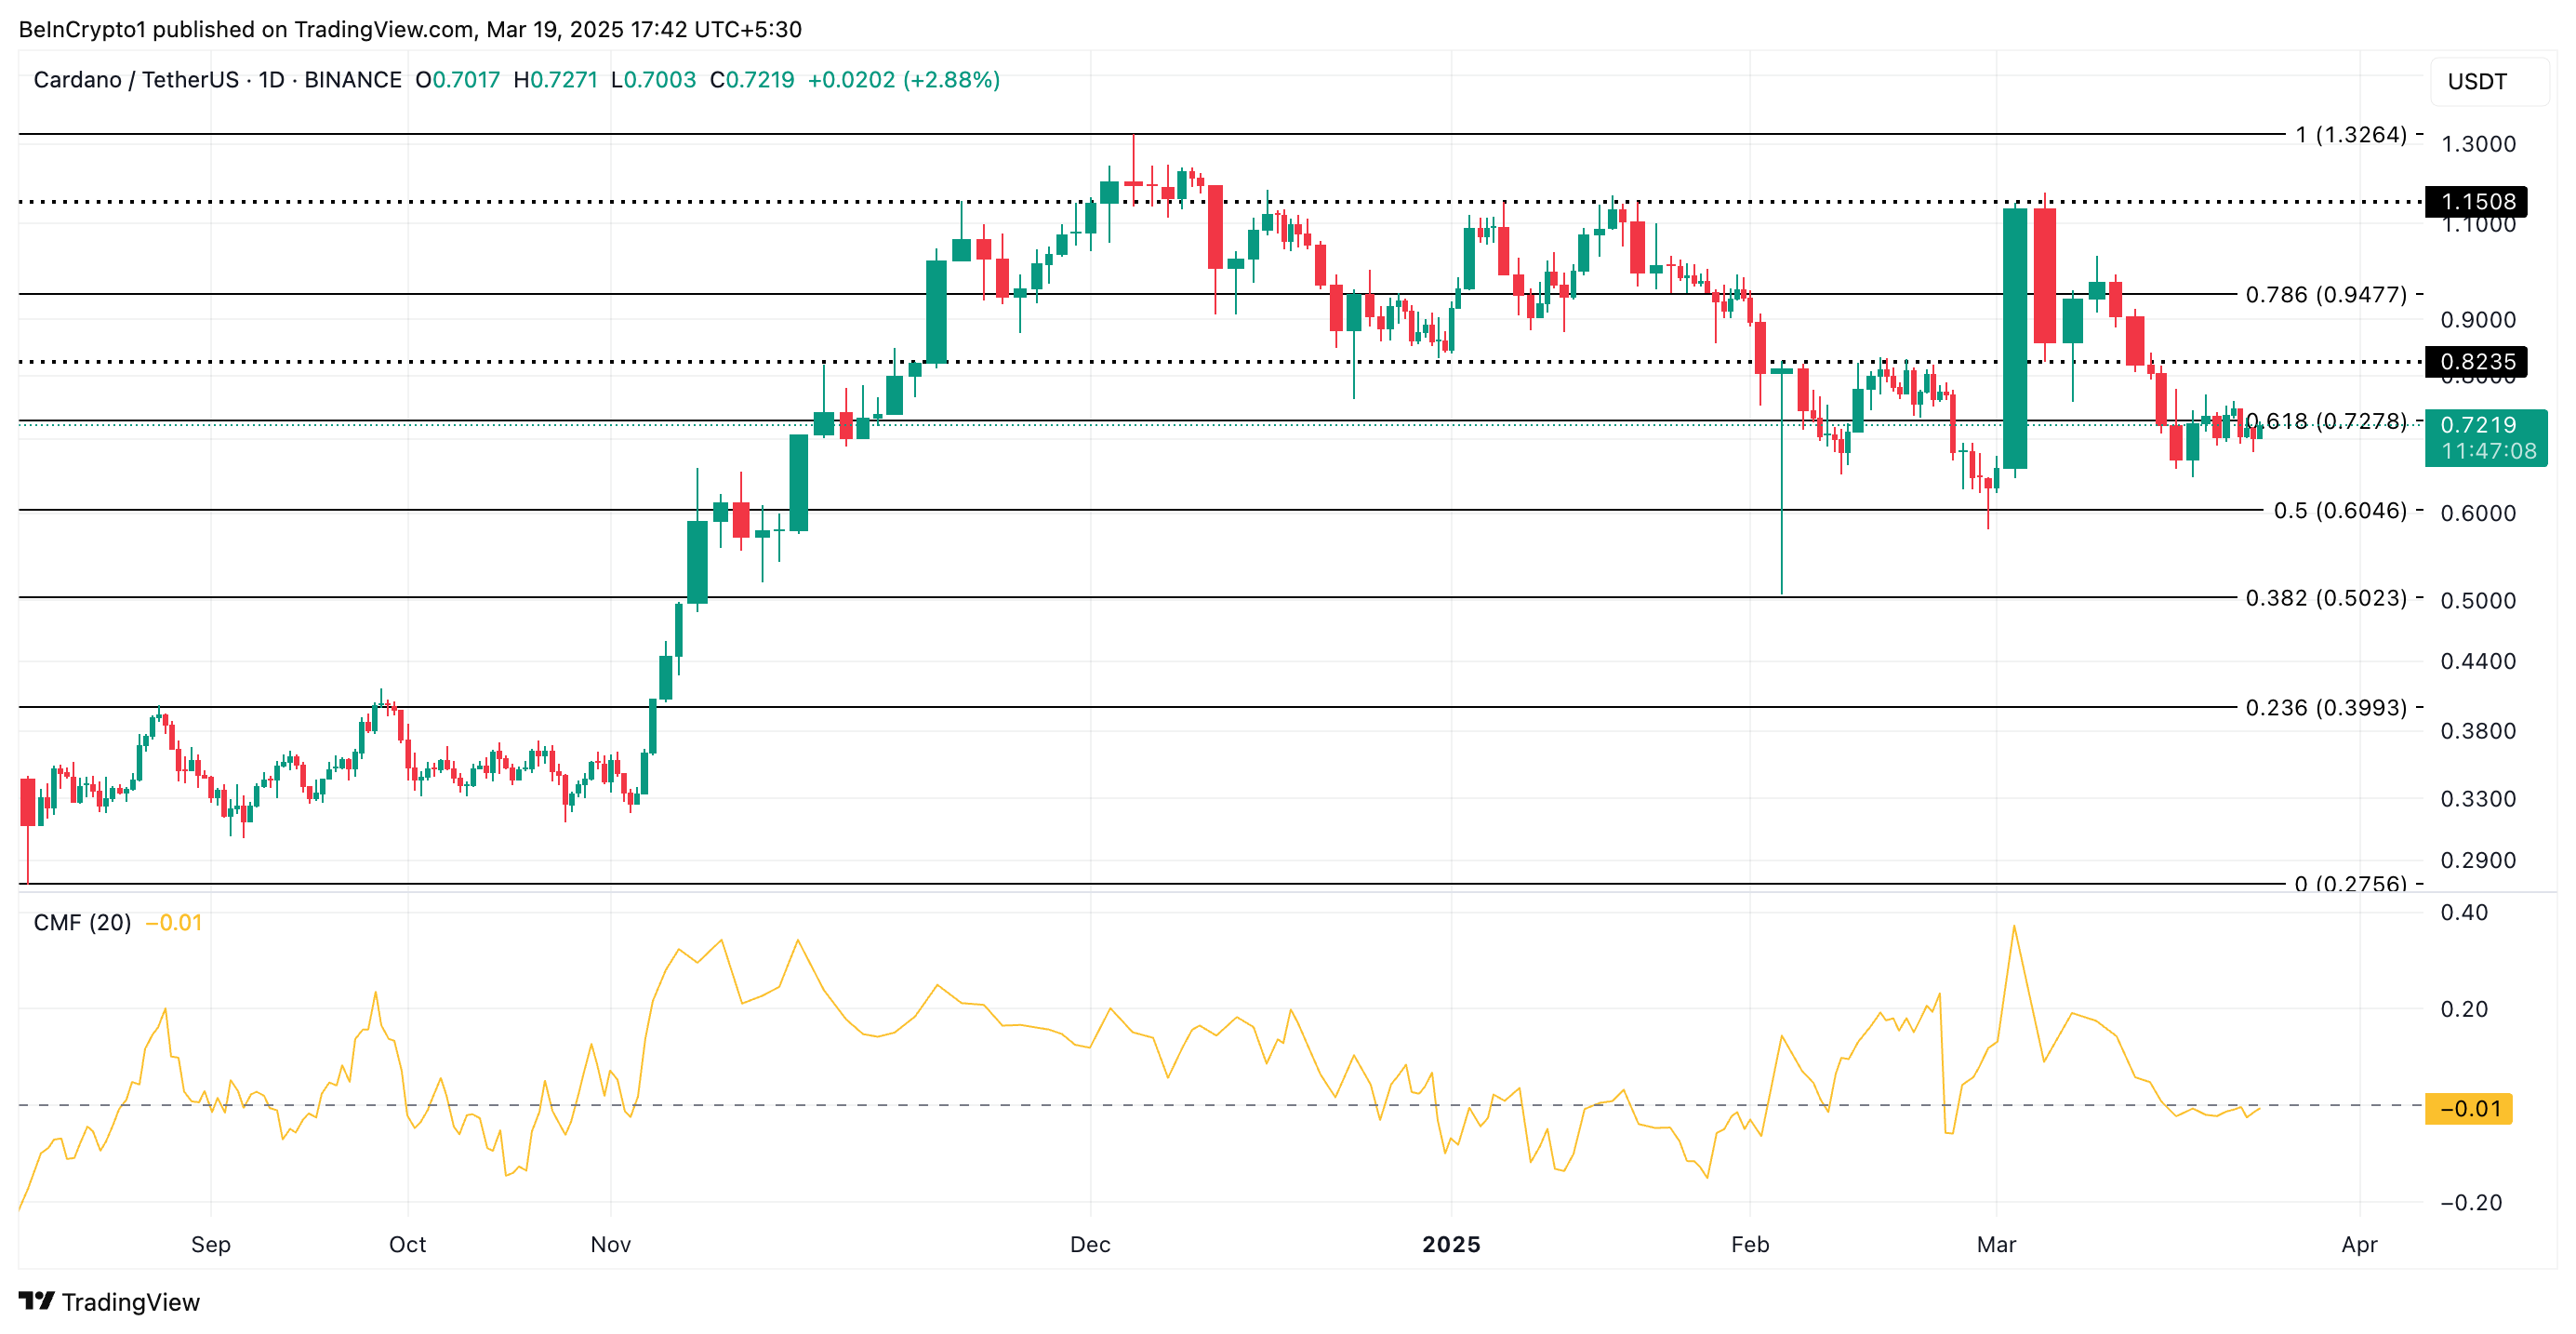
At press time, ADA trades at $0.72. On the daily chart, the coin’s Chaikin Money Flow (CMF) is in an uptrend and poised to cross above the zero line, highlighting the rise in buying pressure.
The indicator measures fund flows into and out of an asset. When it attempts to break above the zero line, it signals a potential shift from selling pressure to buying pressure.
If the breakout is sustained, it would confirm strengthening bullish momentum in the ADA market and hint at a potential price uptrend. In this case, the coin’s price could rally toward $0.82.
Following years of anticipation, Shiba Inu’s Layer-2 (L2) solution Shibarium launched on August 16, 2023. Despite being designed to bring speed, scalability, and reduced costs to SHIB holders, network data shows that Shibarium’s daily activity has significantly lagged behind competing L2 networks like Base, Arbitrum, and Optimism.
This piece looks at how Shibarium has performed this year and what its slow growth means for the wider Shiba Inu ecosystem, especially for BONE, the token that powers Shibarium, and SHIB itself.
Shibarium’s User Engagement Falters After Meme Market Rally
According to Shibariumscan, Shiba Inu’s L2 network had an unimpressive start to the year. In the first quarter of 2025, daily active addresses on the network were relatively low, showing little user engagement.
It was not until April that activity began to pick up on Shibarium. This spike in network usage was driven by the surge in meme coin activity across the broader crypto market.
For context, between April 10 and May 10, the meme coin market capitalization rose 56% as demand for these assets rocketed.
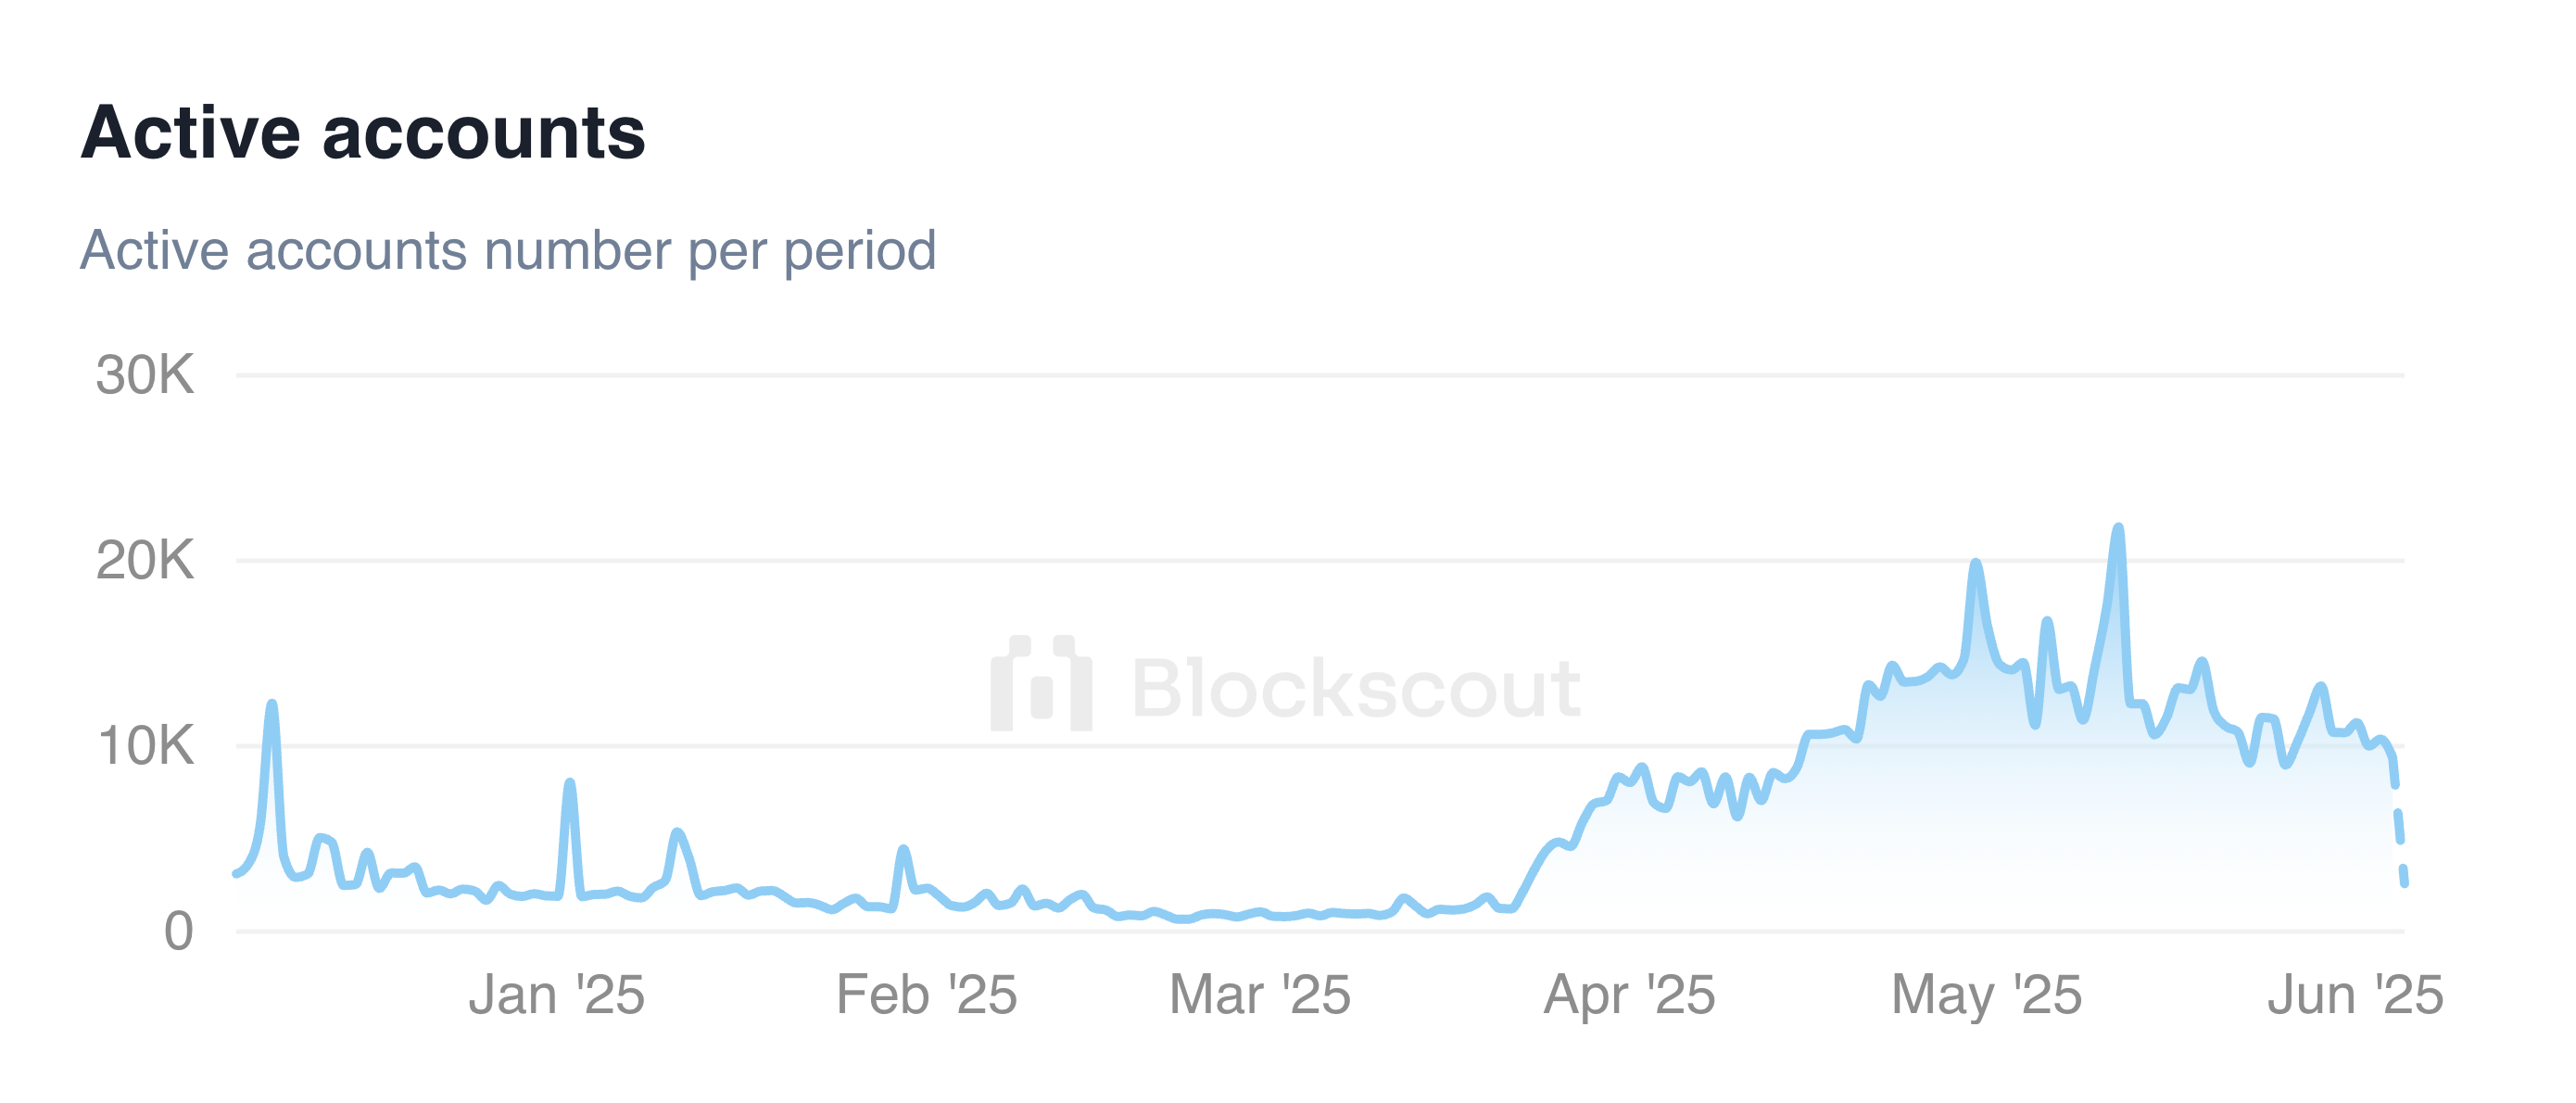
Riding that wave, Shibarium saw a surge in activity, peaking at over 21,000 daily active addresses on May 12, its year-to-date high. However, this momentum did not last.
As the meme coin market mania began to fade in late May, user activity on Shibarium also declined. By June 5, the number of daily active addresses had fallen to around 9,000—a drop of more than 55% in just three weeks.
Shibarium Daily Active Accounts. Source: Shibariumscan
Why Shiba Inu’s Layer-2 Network Is Falling Behind Other L2s
This pattern of user activity on Shibarium suggests a lack of sustained utility or use cases that keep users engaged beyond speculative trading.
In an exclusive interview with BeInCrypto, Dominick John, an analyst at Kronos Research, noted that while Shibarium experiences “bursts of community-driven activity,” it still lags behind other Layer-2 networks like Base, Arbitrum, and Optimism.
“Those networks benefit from robust ecosystems and composability in DEFI beyond the memecoin hype. For Shibarium to stand out, it must evolve and cultivate a unique DeFi ecosystem that delivers long-term value,” John explained.
According to John, Shibarium’s muted growth “reflects project-specific hurdles, limited dApp adoption, ecosystem fragmentation, and fierce L2 competition more than meme-token fatigue.”
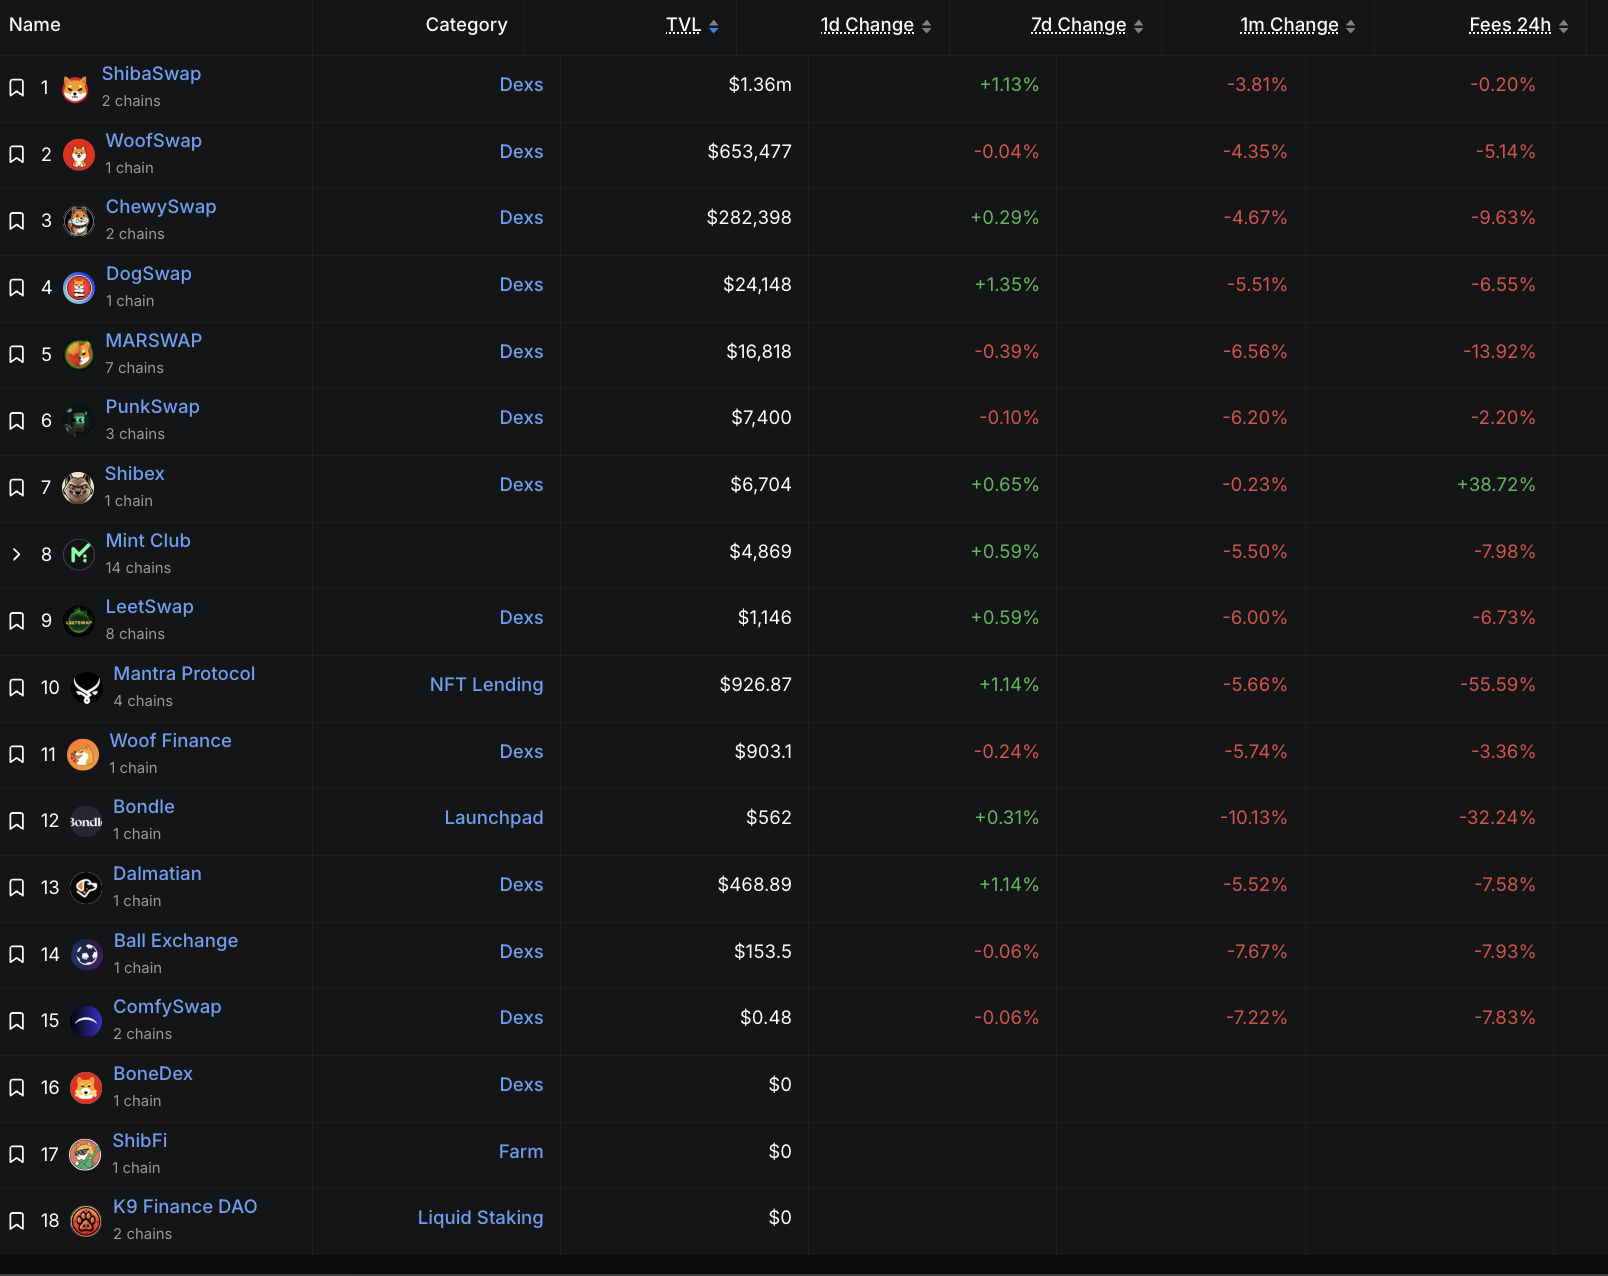
On-chain data from DefiLlama confirms this narrative. Currently, Shibarium hosts just 18 decentralized finance (DeFi) projects— a stark contrast to more established Layer-2s like Base and Arbitrum, which support 549 and 741 projects, respectively.
Lynn C., SONEX’s CMO, echoes the same sentiment. Lynn acknowledges that meme-token fatigue may be partially responsible for Shibarium’s slow adoption, but emphasizes that much of the challenge lies in project-specific scaling strategies.
“On one hand, there is certainly meme-token fatigue in the market as users look for more utility-driven projects. On the other hand, Shibarium’s growth challenges may be specific to how the network is structured and its approach to scaling. There’s no one-size-fits-all solution, and different projects take different paths toward growth,” she said.
Despite its challenges, Shibarium has introduced utility benefits to the Shiba Inu ecosystem. John noted, “Shibarium has strengthened the Shiba Inu ecosystem by enabling cheaper transactions, supporting SHIB burns, and giving BONE real utility.”
For Lynn, the L2 “has added an important component to the Shiba Inu ecosystem by offering a Layer-2 network that promises to scale transactions and reduce costs.”
BONE Token Struggles Amid Shibarium’s Slow Adoption
BONE serves as the primary gas token, facilitating transactions and enabling users to interact on Shibarium. With fewer transactions taking place on the L2, the practical need for BONE as gas has diminished. This lack of on-chain utility has impacted the token’s market performance, falling 38% YTD.
John echoed this concern, stating that, “from a market-making perspective, token utility needs to translate into recurring on-chain demand and transactional velocity. At this stage, BONE demonstrates some early use cases, but it has yet to establish consistent capital retention across the ecosystem.”
On the other hand, Lynn holds a more cautiously optimistic view of BONE. In her words:
“BONE has certainly played a role within the Shiba Inu ecosystem, but like many tokens, it’s still working on building its utility beyond speculative trading. It’s common for newer tokens to find their footing as they grow and develop more use cases. The demand for tokens like BONE will evolve as the ecosystem matures and as more opportunities for real utility emerge.”
For the SHIB meme coin, Shibarium’s lackluster performance also has its impacts.
“If Shibarium fails to scale meaningfully, SHIB holders face several risks: reduced utility due to low transaction volume and limited dApp adoption, weaker SHIB burn rates, and stagnating token value,” John added.
Lynn, on the other hand, struck a slightly more optimistic tone. According to her:
“If Shibarium doesn’t scale, it could slow down the momentum of the broader Shiba Inu ecosystem, especially in terms of user adoption and network effects. However, it’s important to remember that blockchain and DeFi projects face various challenges as they grow, and Shibarium’s trajectory will likely continue to evolve as the team adapts to feedback and market needs.”
The crypto market shows positive signs in the second half of April 2025. Several divergence signals have appeared, suggesting a potential recovery for Bitcoin and altcoins.
Divergence is a key concept in data analysis. It happens when the values of two metrics suddenly shift and move in opposite directions compared to their previous trend. This often signals a change in price momentum. Based on expert analysis and market data, this article highlights five major divergence signals—three for Bitcoin and two for altcoins—to help investors better understand the market outlook.
3 Divergence Signals in April Point to a Bitcoin Price Rally
Historically, Bitcoin and the DXY Index (US Dollar Index) move in opposite directions. When DXY rises, Bitcoin tends to fall, and vice versa. But from September 2024 to March 2025, Bitcoin and the DXY moved in the same direction.
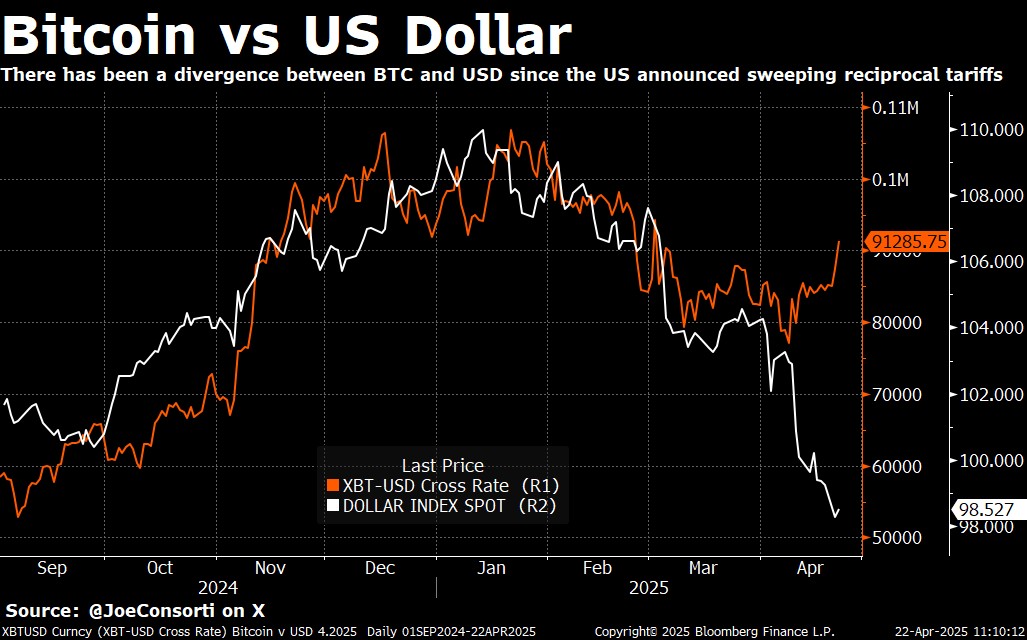
Joe Consorti, Head of Growth at TheyaBitcoin, noted that Bitcoin started decoupling from the US dollar after the announcement of the sweeping tariff regime. A chart from his post shows that in April, while the DXY fell sharply from 103.5 to 98.5, Bitcoin surged from around $75,000 to over $91,000.
Divergence Between BTC And USD. Source: Joe Consorti
This divergence may reflect investors turning to Bitcoin as a safe-haven asset amid global economic uncertainty caused by the tariffs.
“Bitcoin has been diverging from the US dollar since the US announced its sweeping tariff regime. Amidst this global economic reordering, gold and bitcoin are shining,” Joe Consorti predicted.
Another key divergence comes from Tuur Demeester, an advisor to Blockstream. He pointed out a separation between Bitcoin and the NASDAQ Index, which represents tech stocks. Historically, Bitcoin closely followed the NASDAQ due to its ties to tech and macroeconomic sentiment.
But in April 2025, Bitcoin started showing independent growth. It no longer moves in sync with the NASDAQ. While some, like Ecoinometrics, argue that this divergence isn’t necessarily bullish, Demeester remains optimistic.
Divergence Between Bitcoin And NASDAQ. Source: Ecoinometrics
“Bitcoin divergence” and “Bitcoin decoupling” will be dominant headlines for 2025,” Tuur Demeester said.
Specifically, NASDAQ has faced downward pressure from interest rate concerns and slowing growth. Meanwhile, Bitcoin has shown strength, with significant price gains. This suggests that Bitcoin is cementing its role as a standalone asset less tied to traditional markets.
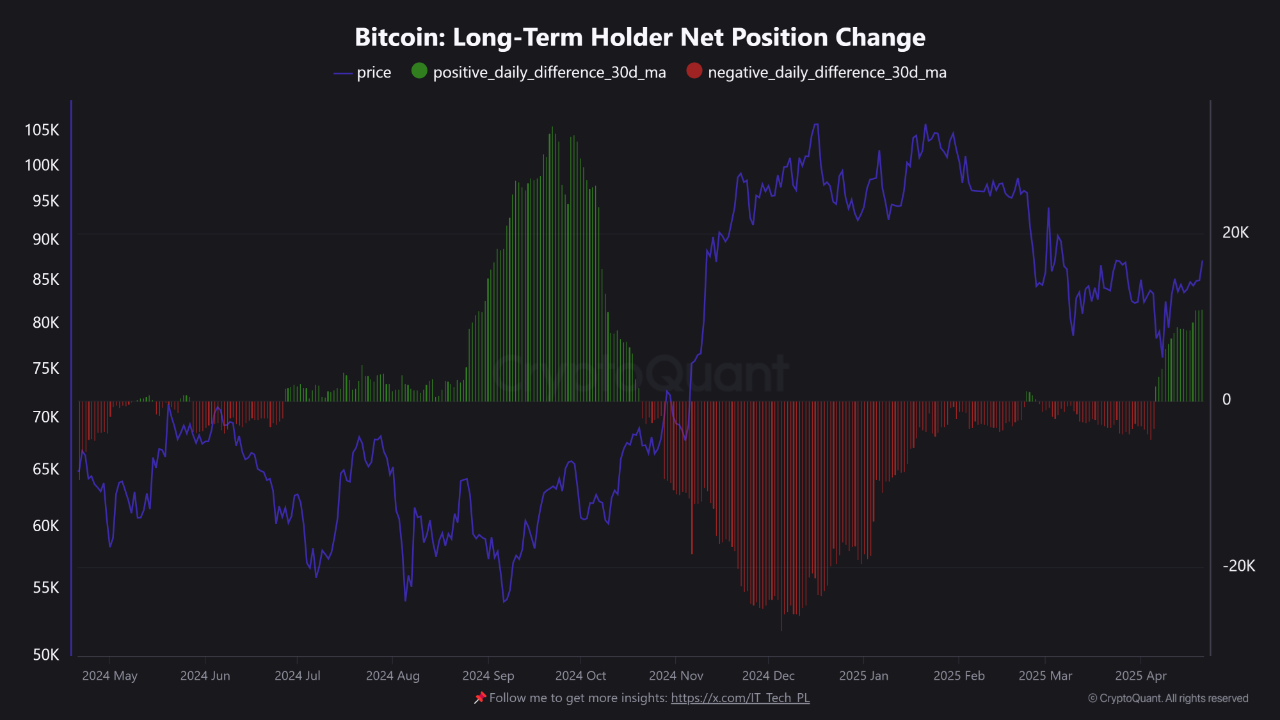
Data from CryptoQuant highlights another divergence—this time in investor behavior. Long-term Bitcoin holders (LTH, those who’ve held BTC for over 155 days) began accumulating again after the recent local peak.
In contrast, short-term holders (STH) are selling off. This divergence often signals the early stage of a re-accumulation phase and hints at a future price rebound.
Bitcoin Long Term Holder Net Position Change. Source: CryptoQuant.
“Why This Divergence Matters? LTH behavior is generally associated with macro conviction, not speculative moves. STH activity is often emotional and reactive, driven by price volatility and fear. When LTH accumulation meets STH capitulation, it tends to signal early stages of a re-accumulation phase,” IT Tech, an analyst at CryptoQuant, predicted.
Altcoin Recovery Round the Corner
Divergence signals also appeared for altcoins, indicating a positive short-term outlook.
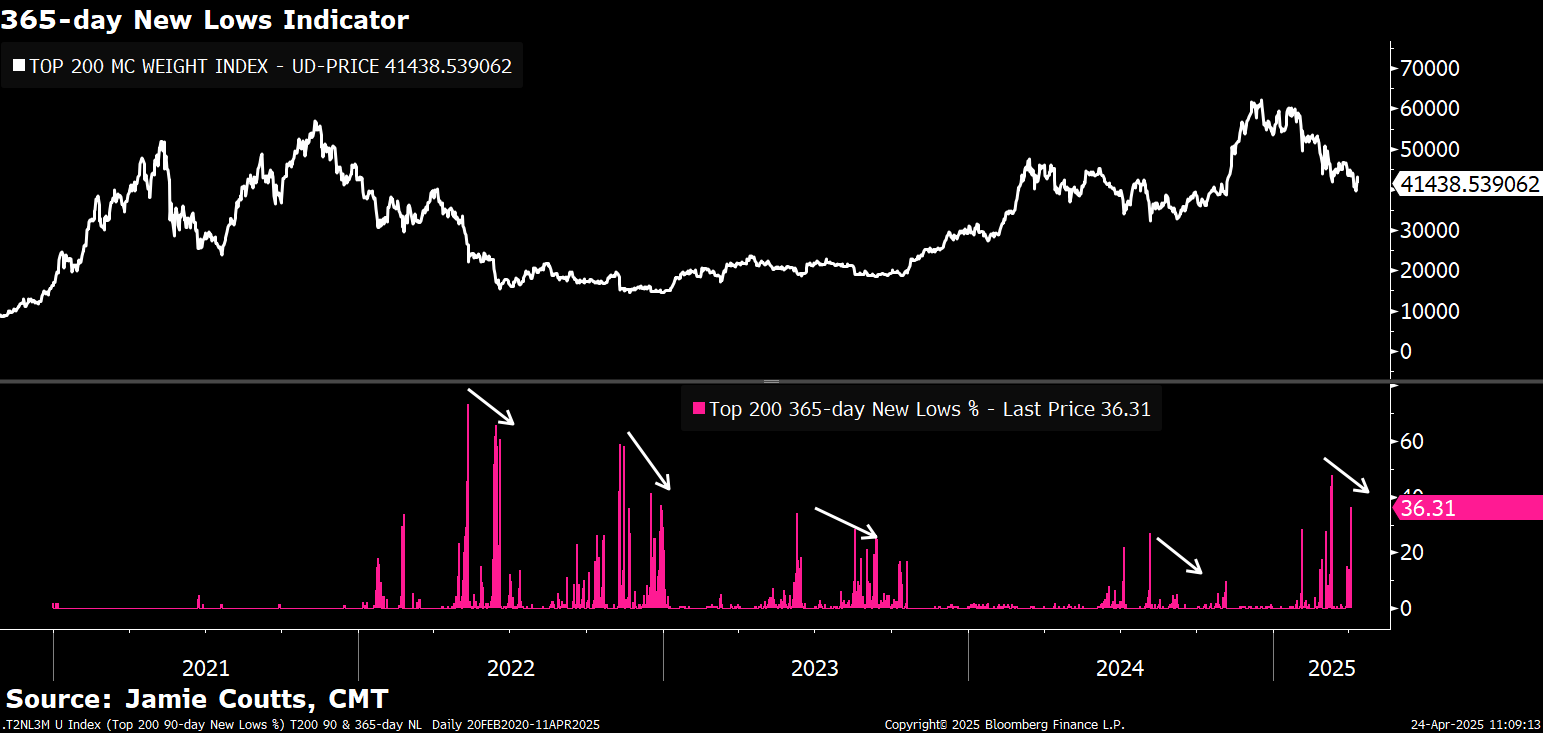
Jamie Coutts, Chief Crypto Analyst at Realvision, pointed to a key divergence using the “365-day new lows” indicator. This metric tracks how many altcoins hit their lowest point in the past year.
In April 2025, although altcoin market capitalization dropped to a new low, the number of altcoins hitting new 365-day lows decreased significantly. Historically, this pattern often precedes a recovery in altcoin market caps.
“Divergence shows downside momentum was exhausted,” Jamie Coutts said.
In simpler terms, fewer altcoins hitting rock bottom means less panic-selling. It suggests that negative market sentiment is weakening. At the same time, rising prices show renewed buying interest. These factors hint that altcoins may be gearing up for a recovery—or even an “altcoin season,” a period when altcoins outperform Bitcoin.
Another technical divergence comes from the RSI (Relative Strength Index) on the Bitcoin Dominance chart (BTC.D), noted by analyst Merlijn The Trader. This chart reflects Bitcoin’s share of the total crypto market capitalization.
“Bearish Divergence Spotted on BTC.D. Higher highs on the chart. Lower highs on RSI. This setup doesn’t lie. Altcoin strength is brewing. Watch for trade setups,” Merlijn said.
This pure technical divergence suggests that BTC.D might soon undergo a strong correction. If that happens, investors may shift more capital into altcoins.
The altcoin market cap (TOTAL3) rebounded by 20% in April, from $660 billion to over $800 billion. The divergence signals discussed above suggest that this recovery could continue.
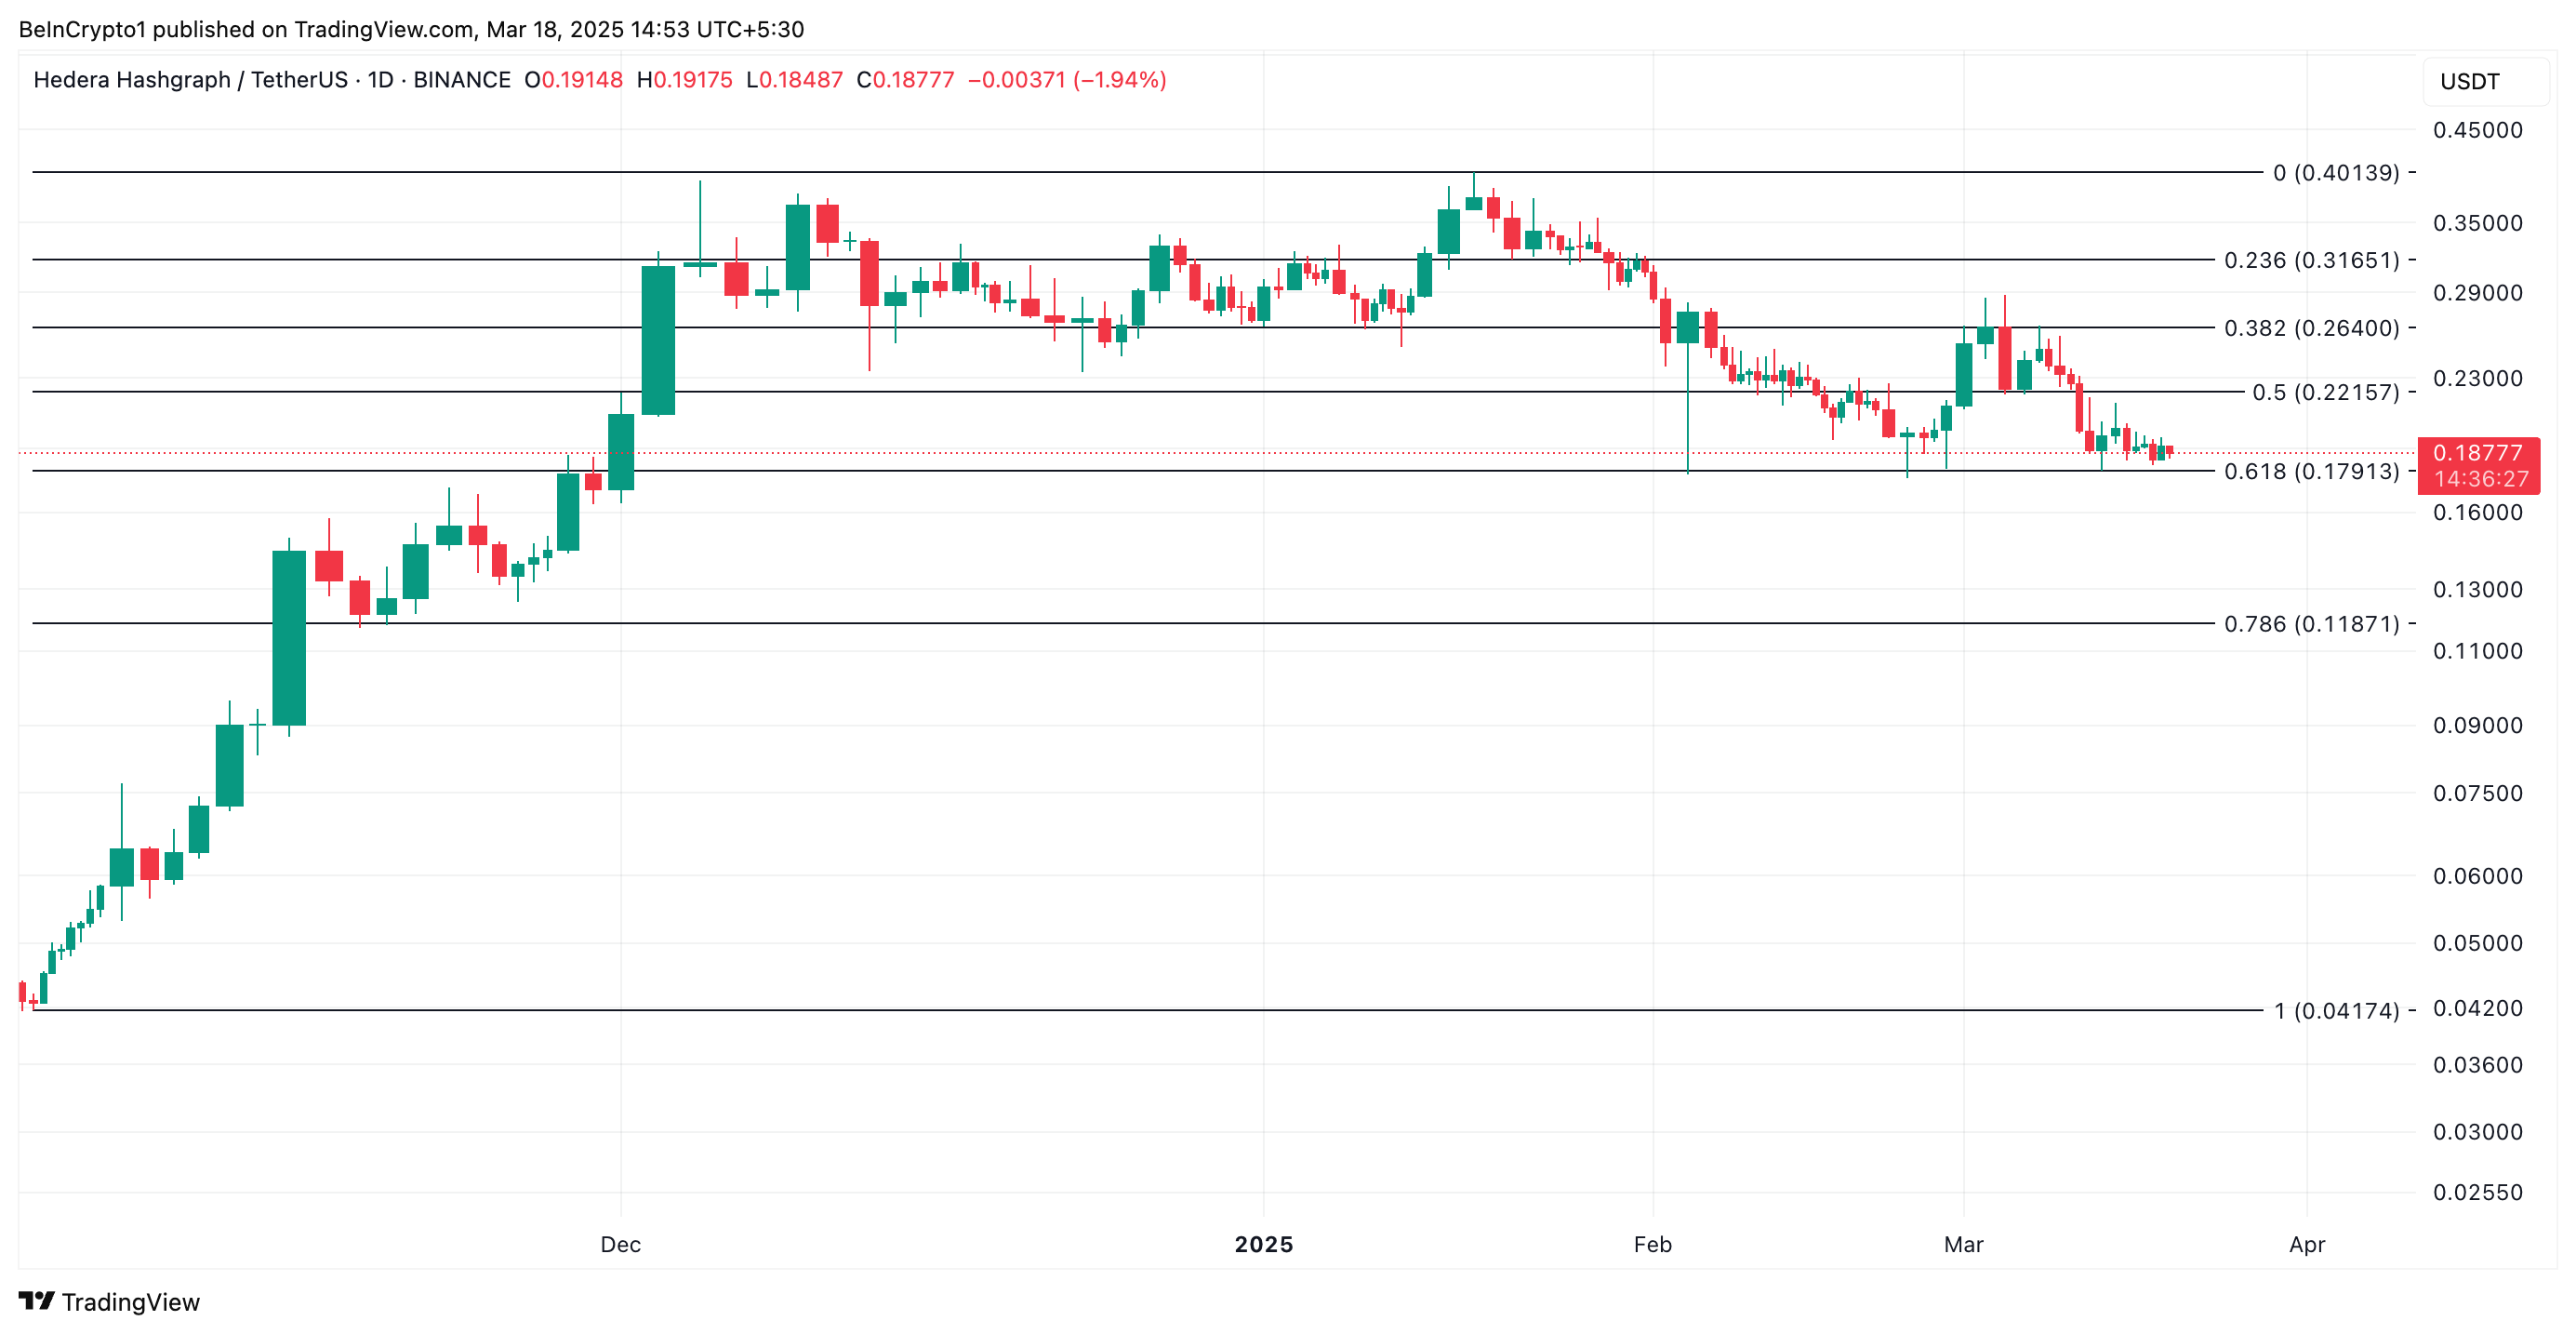
Hedera remains under heavy pressure, marking yet another day of decline as traders continue to bet against the altcoin. It trades at $0.18 at press time, noting a 2% price drop over the past 24 hours.
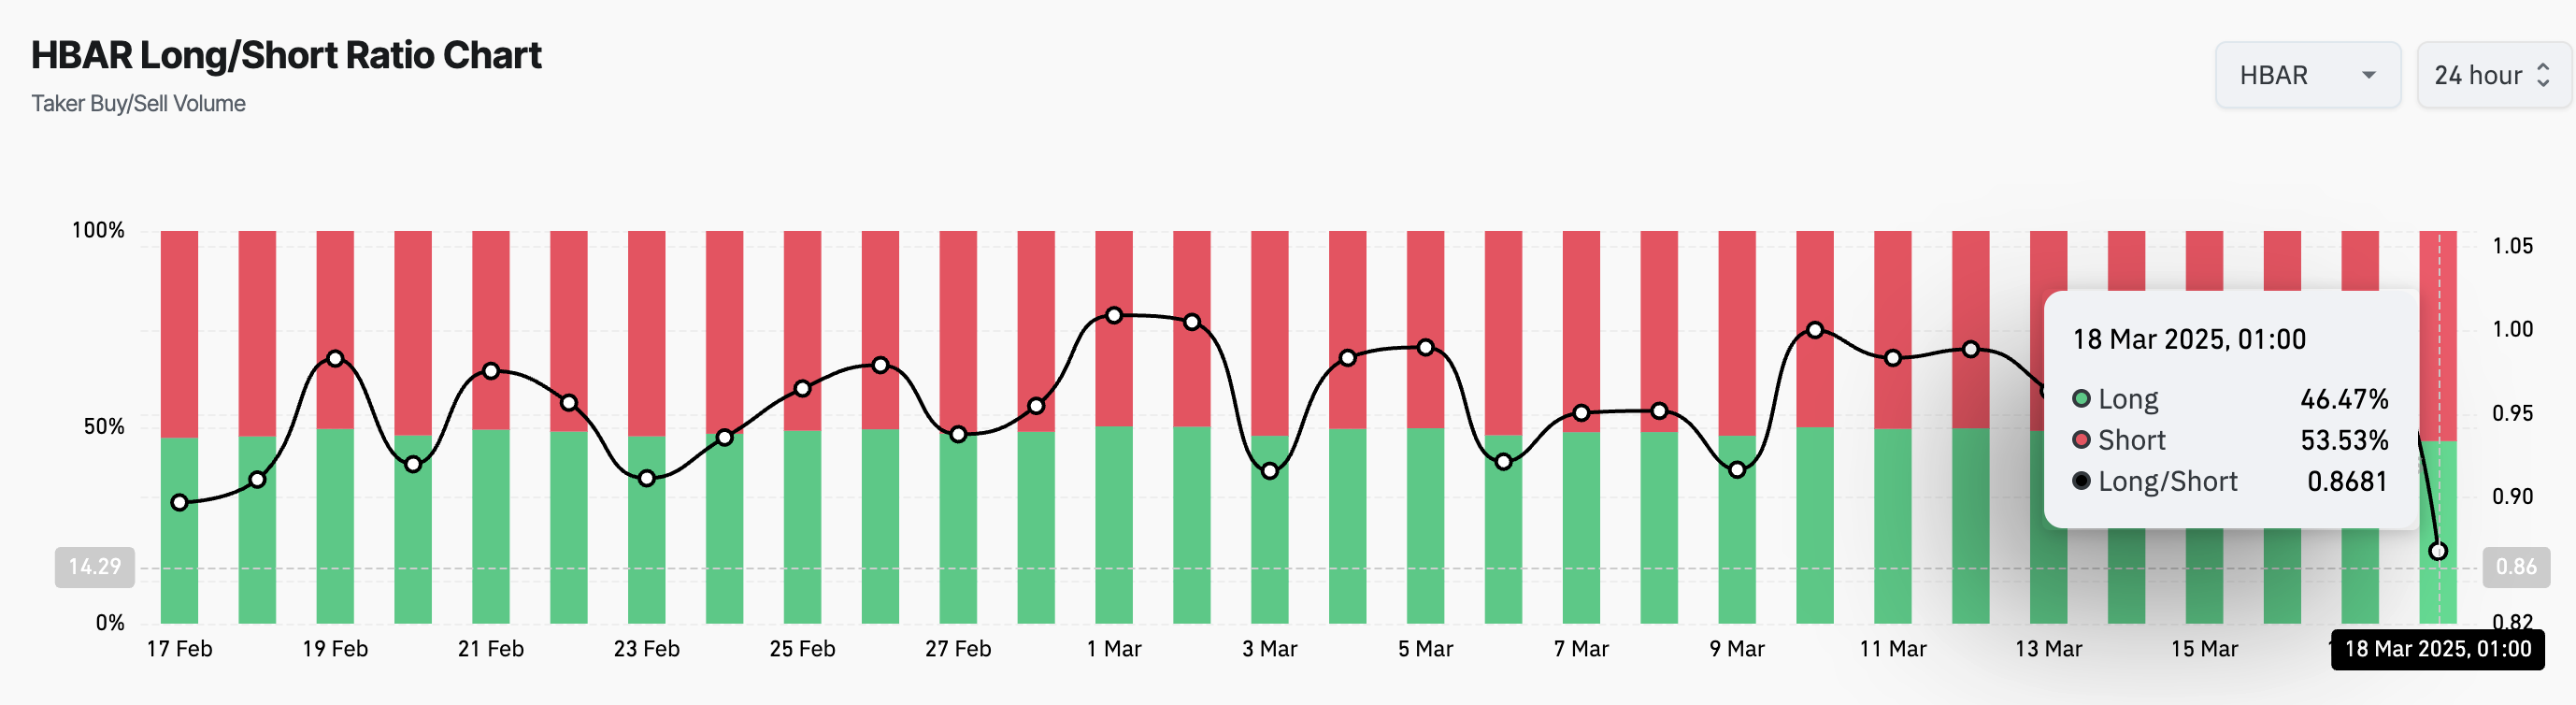
With its long/short ratio signaling a surge in short interest, market sentiment has turned increasingly pessimistic.
Short Sellers Tighten Grip on HBAR
HBAR’s long/short ratio has dropped to 0.86, its lowest level in a month. This reflects a sharp increase in short positions among derivatives traders.
The long/short ratio measures the proportion of long positions (bets on price increases) to short positions (bets on price declines) in the market. A ratio below one means there are more short positions than long ones. This indicates that traders are predominantly bearish on HBAR and hints at a higher likelihood of continued downside movement.
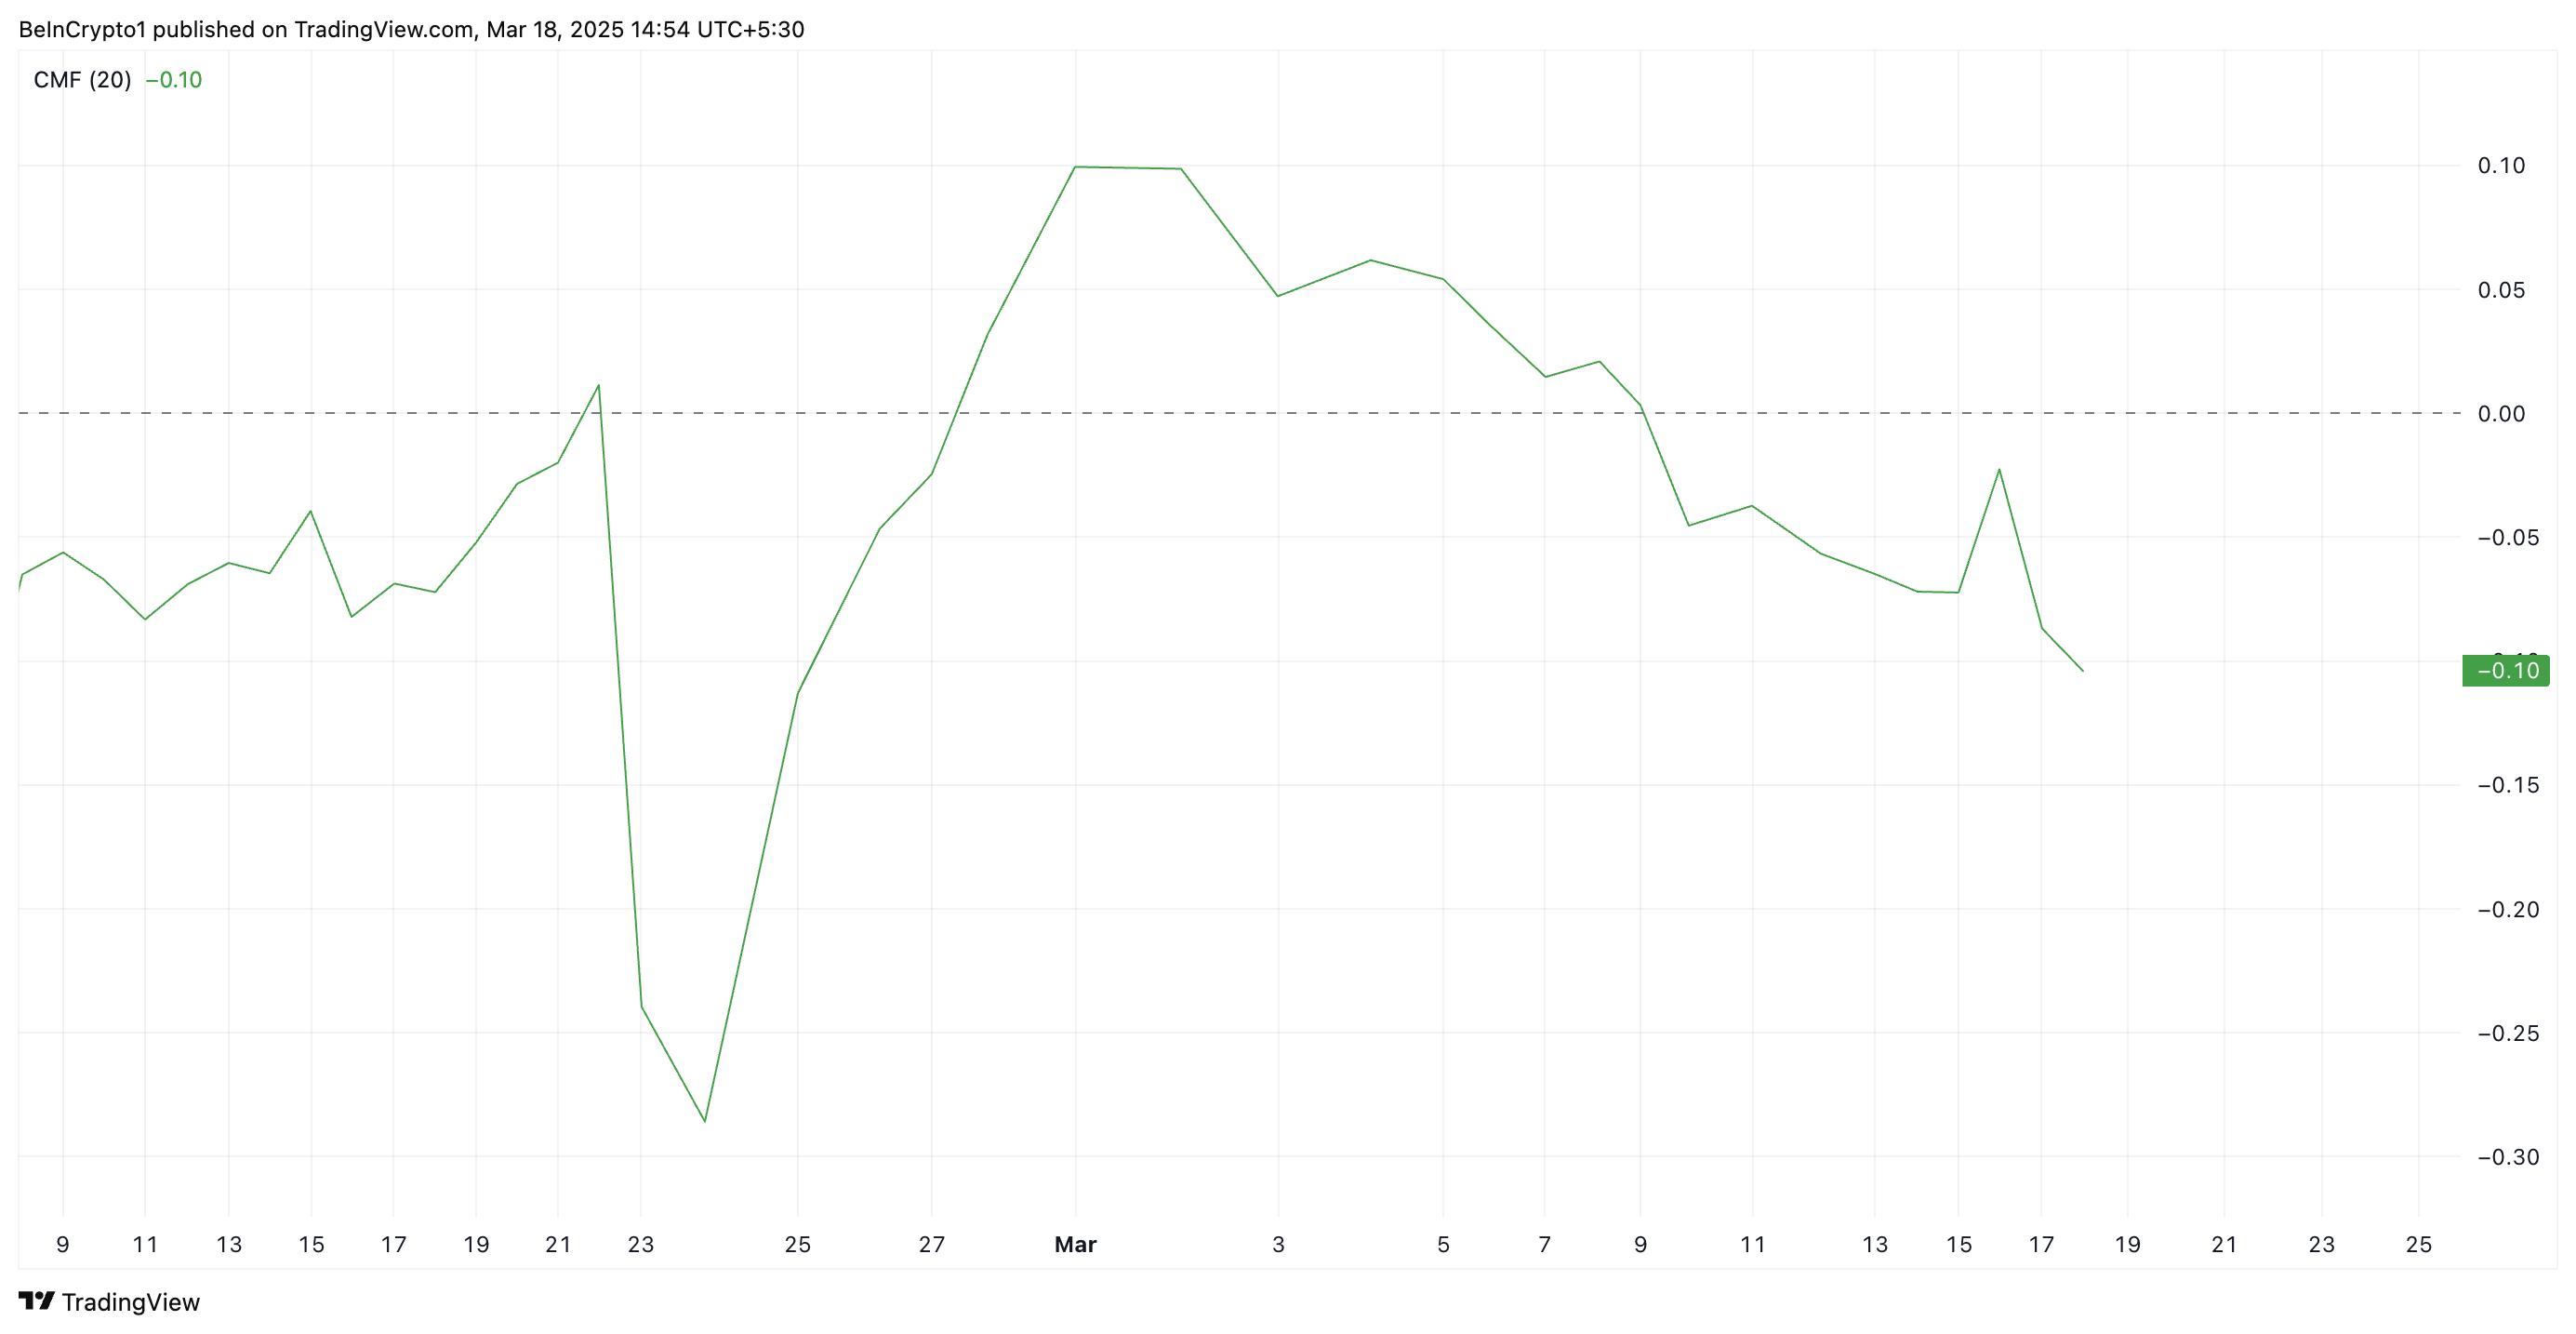
Further, HBAR’s negative Chaikin Money Flow (CMF) on the daily chart supports this bearish outlook. This indicator, which measures how money flows into and out of the asset, is below zero at -0.10 when writing.
HBAR’s negative CMF reading suggests high selling activity, with its sellers dominating the market and looking to push prices lower.
HBAR Traders Brace for Volatility as Price Flirts with Key Support Levels
The growing demand for short positions highlights investors’ expectations of further downside, raising concerns about HBAR’s ability to hold above the critical support level formed at $0.17.
If it fails to hold, the token’s price could plummet to a multi-month low of $0.11, which it last traded at in November.
However, a resurgence in demand for the altcoin could invalidate this bearish projection. If buyers regain market dominance and increase demand, HBAR could rebound toward $0.22.