In a significant development, the Bank of Korea has unveiled its central bank digital currency (CBDC) pilot program, dubbed “Digital Test Project Hangang.” The Bank of Korea, in partnership with seven major banks, is set to launch the pilot program next month, with a planned duration of about three months.
Notably, the Bank of Korea intends to test the efficiency and feasibility of a CBDC-based payment system via the Hangang program. The partnering banks will issue deposit tokens for use at various retail outlets, including local supermarkets, online shopping platforms, and convenience stores.
Bank of Korea Launches CBDC Program: What To Know
According to local reports, the Bank of Korea will debut a real-world CBDC pilot program in April, possibly involving 100,000 local citizens. This trial will enable participants to exchange bank deposits for “deposit tokens” and make payments at partner merchants.
Significantly, Hangang, expected to begin in April, will possibly last for about three months. In collaboration with seven major banks, including KB Kookmin, Shinhan, Hana, Woori, NH Nonghyup, IBK Industrial Bank of Korea, and BNK Busan, the BoK will examine the potential of its CBDC for real-world transactions. Commenting on the development, a BoK official stated,
Through deposit token payments, merchants can receive settlement funds in real time. Additionally, related transaction fees are expected to be reduced by minimizing intermediary institutions in the payment process.
Beyond Traditional Finance: Unveiling the Potential of CBDCs
Through the Hangang CBDC program, the Bank of Korea intends to test the feasibility of CBDCs for real-world transactions. The BoK intends to replace the traditional payment methods with digital currencies, specifically CBDCs. Thus, the Hangang pilot program will serve as a trial.
If the Bank of Korea introduces an “institutional digital currency,” the other banks involved in the program will issue linked tokens. This process will enable consumers to use these tokens for payments. Participants in the pilot program can convert their bank deposits into deposit tokens and vice versa, allowing for seamless transactions. The central bank is expected to release a public announcement by the end of this month to recruit eligible participants.
Meanwhile, South Korea has strengthened its anti-money laundering regulations to tackle the growing crypto threats.
Will South Korea Establish a Strategic Bitcoin Reserve?
Recently, the Bank of Korea dismissed the possibility of adopting a strategic Bitcoin reserve. The bank cited price volatility and inherent risks of cryptocurrencies as a major reason. The BoK stated, “In the case of cryptocurrency market instability, transaction costs to cash out Bitcoins could rise drastically.”
This comes amid speculations of North Korea’s potential Bitcoin reserve plans as the country’s notorious Lazarus Group accumulates Bitcoin. Reportedly, North Korea flipped Bhutan and El Salvador in BTC holdings, becoming the fourth largest holder of Bitcoin.
Spot Bitcoin ETFs extended their inflow streak by another day on Thursday, marking the fifth consecutive day of net positive flows. The total inflow for the day stood above $440 million.
The continued inflows come amid a modest market rebound over the past 24 hours.
Bitcoin ETF Inflows Hit $2.68 Billion for the Week
Bitcoin ETFs recorded another day of net inflows on Thursday, extending their streak to five consecutive days. The latest addition of $442 million brought the week’s total to $2.68 billion, the highest weekly net inflow since the first week of December 2024.
Total Bitcoin Spot ETF Net Inflow. Source: SosoValue
On Thursday, BlackRock’s ETF IBIT recorded the largest daily net inflow of $327.32 million, bringing its total cumulative net inflows to $40.96 billion.
Ark Invest and 21Shares’ ETF ARKB followed in second place with a net inflow of $97.02 million, pushing its total historical net inflows to $3.09 billion.
BTC Futures Show Uptick in Demand
The crypto market has witnessed a modest rebound over the past 24 hours, pushing BTC’s price up by 1% over the past day. During the same period, open interest in BTC futures has also risen, signaling a slight uptick in investor demand.
At press time, this is at $65.31 billion, up 1% today. The gradual rise in BTC’s price and open interest signals growing market participation and increasing confidence in the ongoing trend.
This simultaneous uptick suggests that new positions are being opened to support the price movement, often interpreted as a bullish indicator.
Moreover, call volumes have outpaced puts in the options market, reflecting a tilt toward bullish sentiment. As of this writing, the coin’s put-to-call ratio is at 0.74.
When an asset’s put-to-call ratio is below 1, more call options are being purchased than puts, reflecting a bullish sentiment among options traders. This suggests that investors are positioning for a sustained upside in BTC’s price.
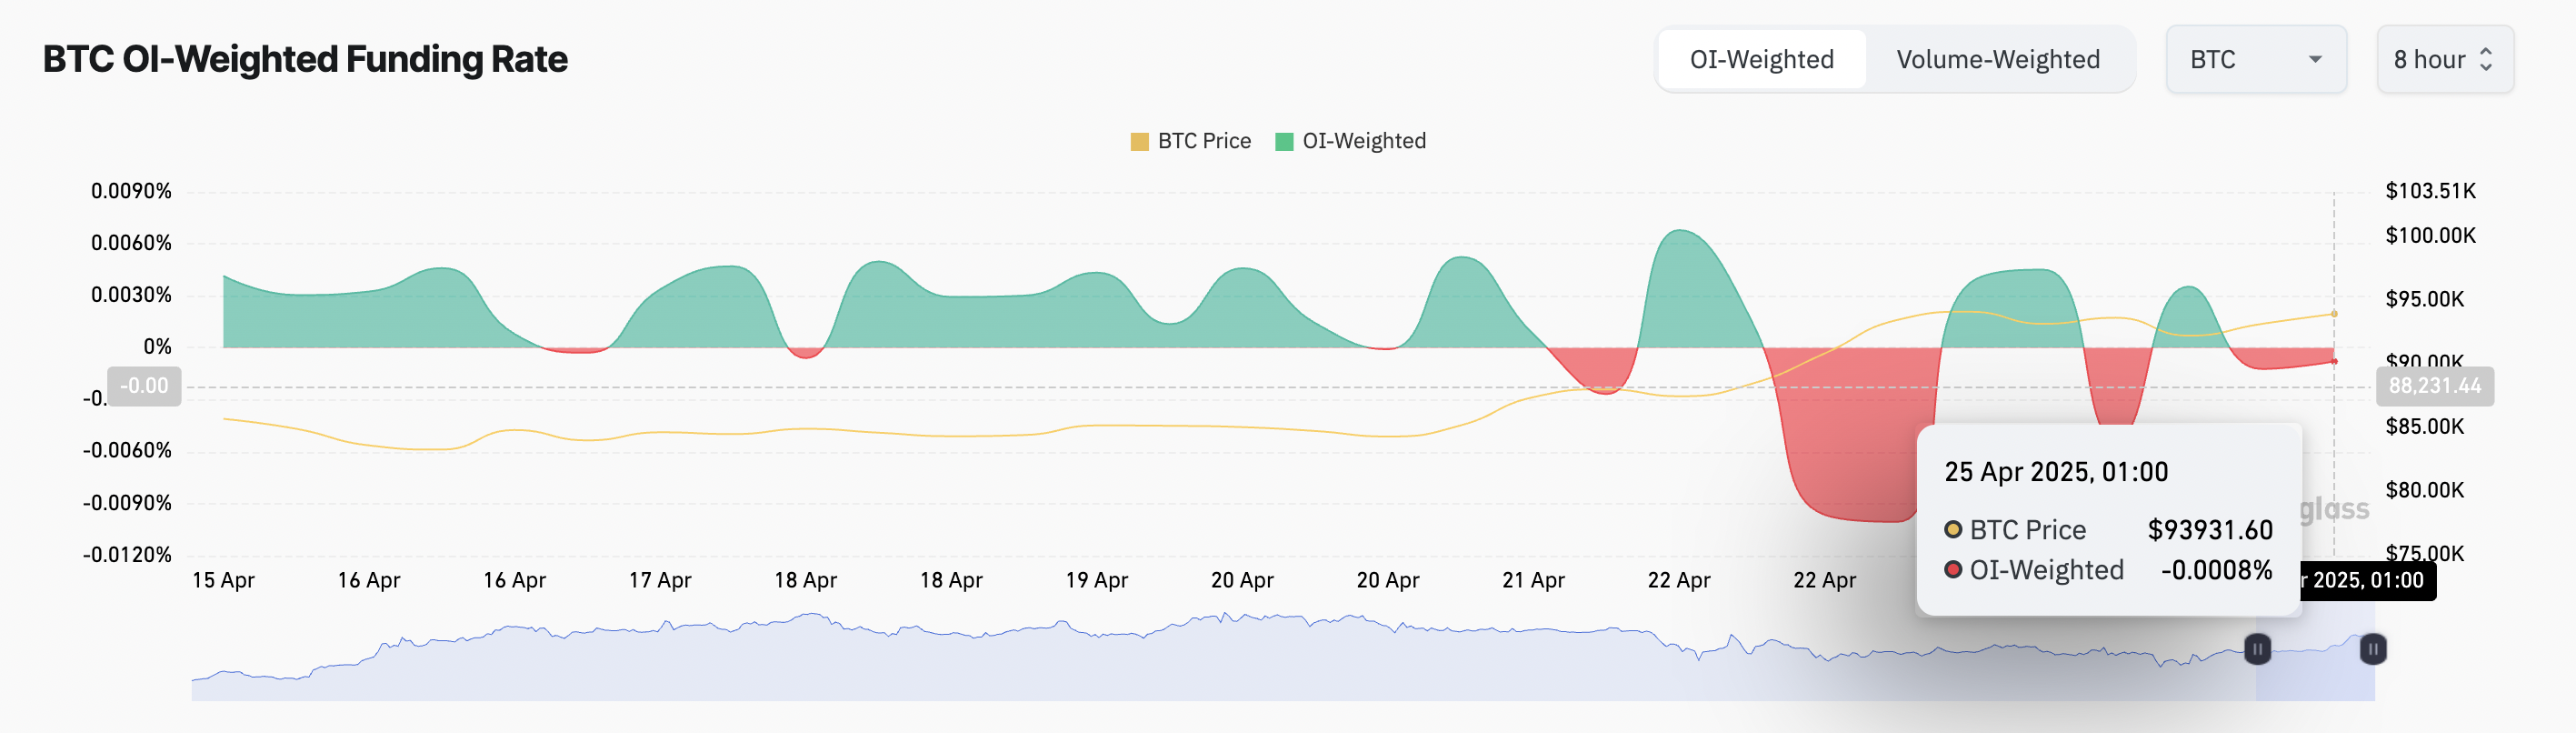
However, despite these positive indicators, BTC’s funding rate remains negative. At press time, the metric is at -0.0008%.
The funding rate is a periodic payment between long and short positions in perpetual futures contracts. It keeps the contract price in line with the spot market. When the funding rate is negative, it indicates bearish sentiment, as more traders are betting on a price decline.
This suggests that some futures traders are still betting on BTC’s short-term downside, even as ETF demand and market metrics show renewed strength.
The XRP price continues to rise this week, aided by numerous bullish Ripple news items, including the growth of RLUSD stablecoin. It rallied by 7% in the last seven days, and has jumped by over 37% from its lowest level in April.
Ripple Labs and community members hope that RLUSD will gain market share from other stablecoins like Tether (USDT) and USD Coin (USDC). This article explores how high the value of XRP would get if RLUSD captured 80% of Tether’s market cap.
XRP Price Would Rise if RLUSD Got 80% of Tether’s Market Cap
A potential bullish catalyst for the XRP price is the growth of Ripple USD into a bigger force in the stablecoin industry. Its stablecoin now has a market cap of $294 million, making it the 20th biggest player in the sector.
It is also a much smaller coin compared to Tether, which has over $146 billion in tokens in circulation. As such, unless something major happens, it is highly unlikely that RLUSD will dethrone USDT.
However, there is a likelihood that stablecoin will continue gaining market share over time. This will accelerate now that Ripple’s legal issues have been resolved, a move that will help it secure more deals with US banks and other financial services.
For RLUSD to gain a 80% market share of Tether, its market cap needs to rise from $293 million today to $116.8 billion. Such a move would make it the second-largest stablecoin, surpassing USD Coin, which is valued at $62 billion.
The XRP price would likely perform well if such a move were to happen, as it would make Ripple a highly profitable company. Tether generated over $13 billion in profits last year, meaning that RLUSD would have generated approximately $10 billion. Some of these funds would be used to burn the XRP token.
Ripple Price Technical Analysis
The most likely XRP forecast is where the coin surges if its stablecoin market cap soars. However, it is somewhat challenging to pinpoint the exact price target. That’s because the Ripple USD’s growth to $116 billion market cap will likely take some time.
The weekly chart presents a bullish outlook for the XRP price. It has surpassed the crucial resistance level at $1.9857, its highest point in 2021. This price was the upper side of the cup-and-handle-like pattern that formed between 2021 and late last year.
XRP price has also received important support at the 50-week moving average. Therefore, the initial target will be the year-to-date high of $3.4, which is about 55% higher than the current level.
The Fibonacci extension can help you identify the next key level. By joining last year’s low of $0.288 and the all-time high, the extension brings the Ripple price target to $4.7187, up by 115% from the current level. Such a move would push its market cap to over $400 billion. It is also possible that the coin would surge to $17, where its market cap would get to $1 trillion if the RLUSD stablecoin had such a growth.
XRP Price Chart
The value of XRP will become invalid if the price drops below the psychological level at $1.5. Such a drop will increase the likelihood of it falling below $1.
The live price of the MANA crypto token is [liveprice sym=”Decentraland”].
MANA price could reach a maximum of $0.33 to $1.10 in 2025.
Decentraland price with a potential surge could go as high as $5.25 by 2030.
Decentraland is a leading community-driven virtual world powered by the Ethereum blockchain, where users can explore, connect, and build using its native ERC-20 token, MANA. Known as one of the top VR metaverse platforms, it continues to grow with regular ecosystem upgrades, strong development activity.
If you’re curious about Decentraland’s future and wondering whether MANA is a good investment, this MANA price prediction 2025–2030 will walk you through its potential growth and long-term outlook
As per the formulated price prediction, the MANA crypto price could hit a potential high of $1.05 in 2025.
This could be possible if the project seeks assistance from developments and collaborations. In contrast, factors like a prolonged bear run could spiral the price down to $0.42.
Year
Potential Low
Potential Average
Potential High
2025
$0.42
$0.73
$1.05
MANA Price Prediction 2025
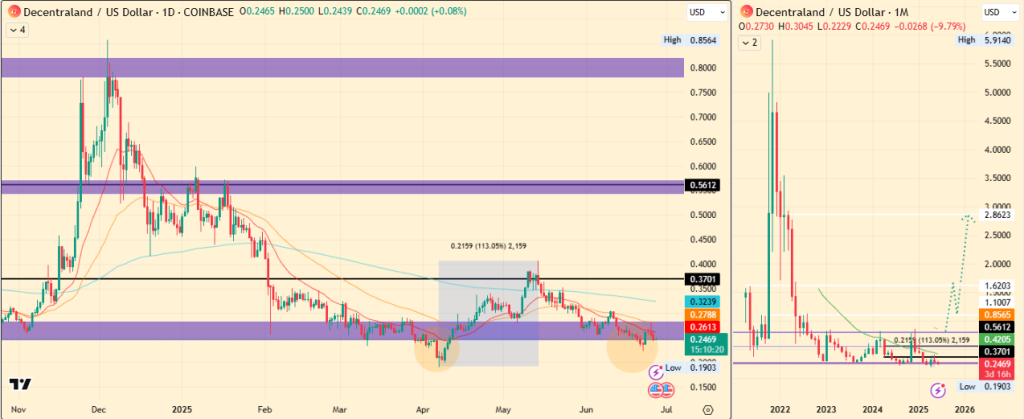
Decentraland’s price has faced significant challenges, plummeting to $0.1903 on April 6, 2025. However, it managed to recover, doubling to $0.3935 by mid-May. Unfortunately, the rest of May saw a decline that has extended to entire June, down almost 38% from the $0.40 mid-May peak.
In June, it has continued to trade below a bearish cross between the 20-day and 50-day EMA bands and bleeding slowly from the support zone.
If this support is breached again, a similar fall that happened in the first week of April could be mimicked, which is raising concerns. As bears return in power, it could lead to a drop in MANA back to the $0.1903 low.
On the other hand, if the ongoing witnessed short-term price bounces back from this support, then in such a case reaching $0.5612 by July is within a possibility. A more ambitious target of $1.10 could also be on the horizon by the end of 2025, provided a strong bullish momentum returns, like the surge seen in Q4 2024.
Still, market participants are likely wondering, “What does the future hold for the MANA price?”
To answer this, examining its multi-year chart is crucial. Since the FTX crash in 2021, MANA has fallen from a high of over $5.91. This long-term activity illustrates its range during both bull and bear markets, which now appears to be a consolidation phase compared to its 2021 peak.
In 2025, MANA is at its lowest point, down 95% from its all-time high. If a revival occurs and MANA manages to clear the $1.10 mark by the end of 2025, it could signal the beginning of a true bullish era for this cryptocurrency.
This table, based on historical movements, shows Decentraland price to reach $5.15 by 2030 based on compounding market cap each year. This table provides a framework for understanding the potential MANA price movements. Yet, the actual price will depend on a combination of market dynamics, investor behavior, and external factors influencing the cryptocurrency landscape.
Market Analysis
Firm Name
2025
2026
2030
Coincodex
$0.37
$0.35
$0.30
priceprediction.net
$0.58
$0.89
$4.19
DigitalCoinPrice
$0.33
$0.61
$3.32
*The targets mentioned above are the average targets set by the respective firms.
Supply and Demand: A spike in supply and demand can help surge the price of this coin to new highs.
Inflation of fiat currencies: Hyperinflation could drive people and governments towards Cryptocurrencies as an alternative.
Governments: Regulations by the government and the Central Bank Digital Currencies (CBDCs) could impact the crypto industry greatly.
Historical Market Analysis
Back to levels under $1, the MANA price trend shows massive upside potential in the next bull market.
CoinPedia has dedicated a team of expert analysts to cover the possible crypto price prediction and sum it all up in one place, just for you!
[article_inside_subscriber_shortcode title=”Never Miss a Beat in the Crypto World!” description=”Stay ahead with breaking news, expert analysis, and real-time updates on the latest trends in Bitcoin, altcoins, DeFi, NFTs, and more.” category_name=”Price Prediction” category_id=”6″]
FAQs
Can Decentraland’s MANA be halved?
No, MANA can neither be halved nor mined.
What will be the potential high of MANA’s price by the end of 2030?
According to our Decentraland price prediction, MANA price could soar as high as $5.15 by the end of 2030.
Is Decentraland a good investment for the long term?
Yes, MANA is a profitable investment in the long term, factoring in the future of the metaverse.
Will the MANA price hit $10 by the end of 2025?
The altcoin could hit a maximum of $1.05 by the end of 2025.
How to buy Decentraland’s MANA?
The digital asset is available for trade across leading cryptocurrency exchange firms such as Coinbase Pro, Binance, Okex, and Huobi Global.
MANA
BINANCE
The post Decentraland Price Prediction 2025, 2026 – 2030: Will MANA Price Hit $1? appeared first on Coinpedia Fintech News
Story Highlights The live price of the MANA crypto token is [liveprice sym=”Decentraland”]. MANA price could reach a maximum of $0.33 to $1.10 in 2025. Decentraland price with a potential surge could go as high as $5.25 by 2030. Decentraland is a leading community-driven virtual world powered by the Ethereum blockchain, where users can explore, …