The cryptocurrency market has kicked off the weekend on a positive note. The market cap of the business has climbed by 2.74%, reaching $2.75 trillion. In the meantime, daily trading volumes cooled off, dropping 14.82% to $76 billion. Talking about, market sentiments, investors remain cautious as the Fear & Greed Index holds steady at 22.
Bitcoin Price Holds $84k
Bitcoin price today holds firm above the $84k level, with a 24-hour price spike of 2.96%, this has come despite a 3.79% drop in trading volume, now at $28.4 billion. Coming to its foothold in the industry, its market cap stands tall at $1.67 trillion, with price action ranging between $81,771 and $85,263 in the same period.
Ethereum also showed a healthy uptick, gaining 1.91% in the past 24 hours. Meanwhile, XRP impressed with a 6.37% rise. Solana, however, stole the spotlight among the major altcoins, climbing 7.09% and emerging as today’s top-performing large-cap asset.
HYPE leads the top 100 altcoins with an impressive 12.08% jump, followed by ATOM up 10.92%, and KAS up 9.72%. On the flip side, PI saw the sharpest decline, dropping 15.08%, while TIA and TRX recorded minor losses of 1.54% and 1.47% respectively.
Stay tuned for every day updates from the world of cryptos!
FAQs
How much does 1 BTC cost today?
At press time, Bitcoin is priced at $84,255.41.
Which tokens have surged the highest today?
HYPE, ATOM, and KAS are today’s top gainers with 12.08%, 10.92%, and 9.72% respective gains.
How has Solana (SOL) performed today?
Solana price has risen 7.09% in the past 24 hours, leading the altcoin pack.
It’s a sentence that hits hard: “I wish I bought Bitcoin at $1” Millions missed it. Some didn’t believe in it. Others just didn’t know. But now, after former President Trump’s public comments about Bitcoin becoming “the future of financial security,” that sentiment is echoing louder than ever. The world is watching, but smart investors are asking a different question: What comes next?
That’s why in light of the Trump Bitcoin comments, analysts and investors alike are highlighting a new opportunity that feels eerily familiar: Bitcoin Solaris (BTC-S). If you missed Bitcoin at $1, this could be your second shot.
Why Bitcoin Solaris Is Being Called the Next Big Thing
Bitcoin Solaris is not a meme coin or a copycat—it’s a ground-up, engineered blockchain built to solve the same challenges Bitcoin once faced. But instead of solving them slowly over a decade, BTC-S is coming out of the gate with a full arsenal of upgrades and innovations.
Dual-layer blockchain (PoW for base layer security, DPoS for speed and scalability)
10,000 transactions per second, 2-second finality
Mobile-first mining through any device: phones, laptops, browsers
Built-in wallet, one-click mining, and zero tech knowledge required
Energy efficiency that uses 99.95% less power than traditional Bitcoin mining
More importantly, Bitcoin Solaris is built for the people who missed Bitcoin the first time. Its mobile-friendly approach means everyone, anywhere can mine and earn without the complexity.
A detailed review by CryptoChester explains why BTC-S is gaining massive attention across the crypto world. Meanwhile, community excitement is growing rapidly on platforms like Telegram and X.
Phase 4 Presale: Limited Time, Maximum Potential
One of the biggest signals of BTC-S’s momentum? Its presale—currently in Phase 4—is exploding.
Current Price: $4
Next Phase: $5
Launch Price: $20
Bonus: 12%
This presale runs for only 90 days, and launch is set for July 31, 2025. Already, over $1,000,000 has been raised, with 8,900+ investors jumping in. With a potential 1,900% return before the coin even hits exchanges, this is being labeled one of the most explosive and time-sensitive launches of 2025.
The Solaris Nova App—the heart of BTC-S mining—isn’t available to the public just yet. But some early community members have been granted beta access, giving them a head start on testing mobile mining, wallet integration, and user experience.
This limited access is creating buzz—and opportunity. While the official app isn’t live, there may still be room for new users to join the inner circle before the full rollout.
2027 and beyond: DEX launch, enterprise adoption, quantum security, AI tools
Every step is tied to expanding utility and value, not hype.
Conclusion: A Second Chance Doesn’t Come Twice
So yes, you may have missed Bitcoin at $1. But in the wake of the Trump Bitcoin comments, Bitcoin Solaris is being recognized as a similar opportunity—except it’s more scalable, more inclusive, and still just $4.
This isn’t about regret. It’s about not making the same mistake twice.
The post Missed Bitcoin at $1? Trump Bitcoin Comments Highlight Bitcoin Solaris as Similar Opportunity appeared first on Coinpedia Fintech News
It’s a sentence that hits hard: “I wish I bought Bitcoin at $1” Millions missed it. Some didn’t believe in it. Others just didn’t know. But now, after former President Trump’s public comments about Bitcoin becoming “the future of financial security,” that sentiment is echoing louder than ever. The world is watching, but smart investors …
US-based Bitcoin exchange-traded funds (ETFs) experienced their largest single-day net inflow in nearly two months. As per the data, this is the highest daily inflow since January 30, when the funds attracted $588.1 million shortly after Bitcoin price reached its all-time high.
ARK and Fidelity funds show strong Bitcoin ETF performance
The strong inflow on April 21 saw $381.3 million entering the funds. It was widely distributed across multiple ETF providers, with ARK 21Shares Bitcoin ETF (ARKB) capturing the largest share at $116.1 million. Fidelity Wise Origin Bitcoin Fund (FBTC) followed with the second-highest inflow at $87.6 million. The data comes as Bitcoin price has reclaimed the $88,000 level.
Grayscale, which had previously experienced substantial outflows after converting its Bitcoin trust to an ETF, showed signs of stabilization with its Bitcoin Trust (GBTC) and Bitcoin Mini Trust ETF (BTC) recording combined inflows of $69.1 million.
BlackRock’s iShares Bitcoin Trust ETF (IBIT), which maintains the largest assets under management among the Bitcoin ETFs, attracted $41.6 million, approximately half of what it had received before the weekend trading break on April 17. Other funds including HODL and EZBC also contributed to the day’s positive performance with inflows of $11.7 million and $10.1 million respectively. The positive ETF inflow comes amidst the expectation of the first ever XRP ETF going live.
United States experience continued crypto outflow
While US Bitcoin ETFs saw strong performance on April 21, overall digital asset investment data for the week shows notable geographic variations in investor behavior. According to CoinShares’ weekly report, the overall digital asset investment sector showed modest total inflows of $6 million for the week.
The United States continued to experience net outflows totaling $71 million for the week despite the strong single-day performance on April 21. This suggests that the substantial inflow day was an exception to the generally cautious US investor stance.
Funds Flow by country: CoinShares
In contrast, European markets displayed more positive sentiment toward digital asset investments. Switzerland led with inflows of $43.7 million, followed by Germany with $22.3 million. Canada also contributed positively with $9.4 million in net inflows during the same period.
The CoinShares report highlighted that broader market sentiment fluctuated throughout the week, with stronger-than-expected US retail sales figures that caused significant outflows of $146 million mid-week.
Bitcoin products specifically ended the week with minor outflows of $6 million despite the substantial daily inflow seen in the ETF data. Additionally, short Bitcoin investment products recorded outflows of $1.2 million which was their seventh consecutive week of outflows. These products have now seen investors withdraw approximately 40% of their total assets under management over this period.
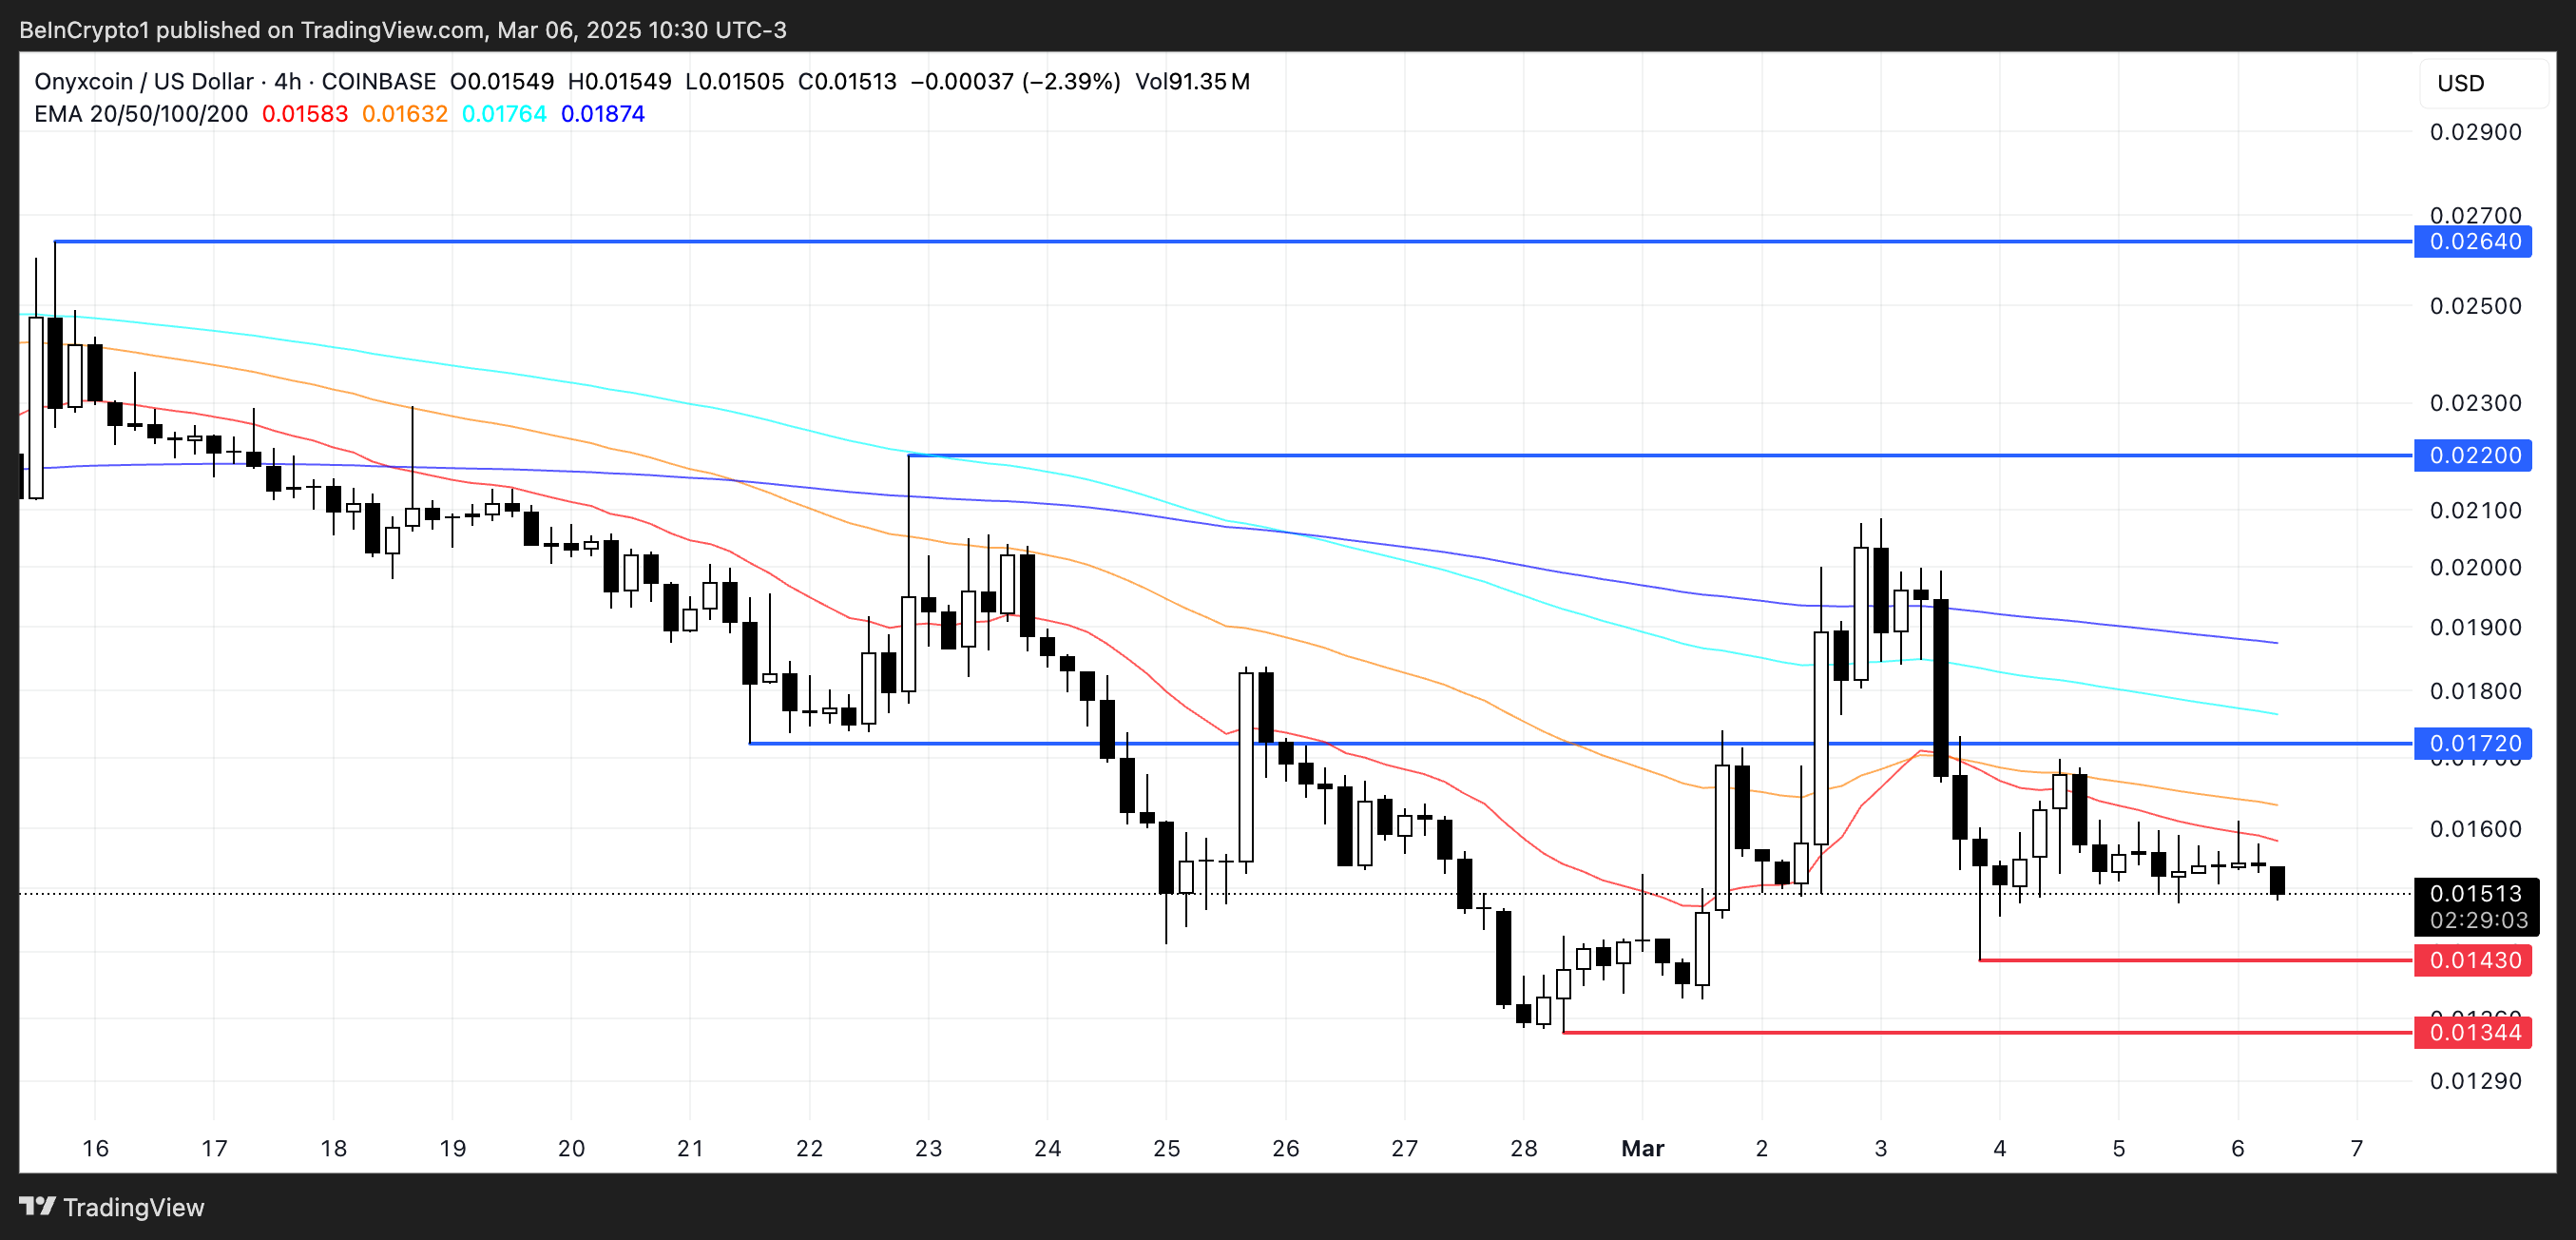
Onyxcoin (XCN) lost over 50% in February after a massive rally of nearly 2,000% between January 13 and January 26. Despite the ongoing decline, its recent indicators show mixed signals. RSI has stayed neutral for the past nine days, and ADX is pointing to a weakening downtrend.
XCN is currently trading between resistance at $0.017 and support at $0.0143, with EMA lines still reflecting a bearish trend. Whether the price moves higher or lower will depend on whether momentum returns or if selling pressure continues to push XCN toward lower support levels.
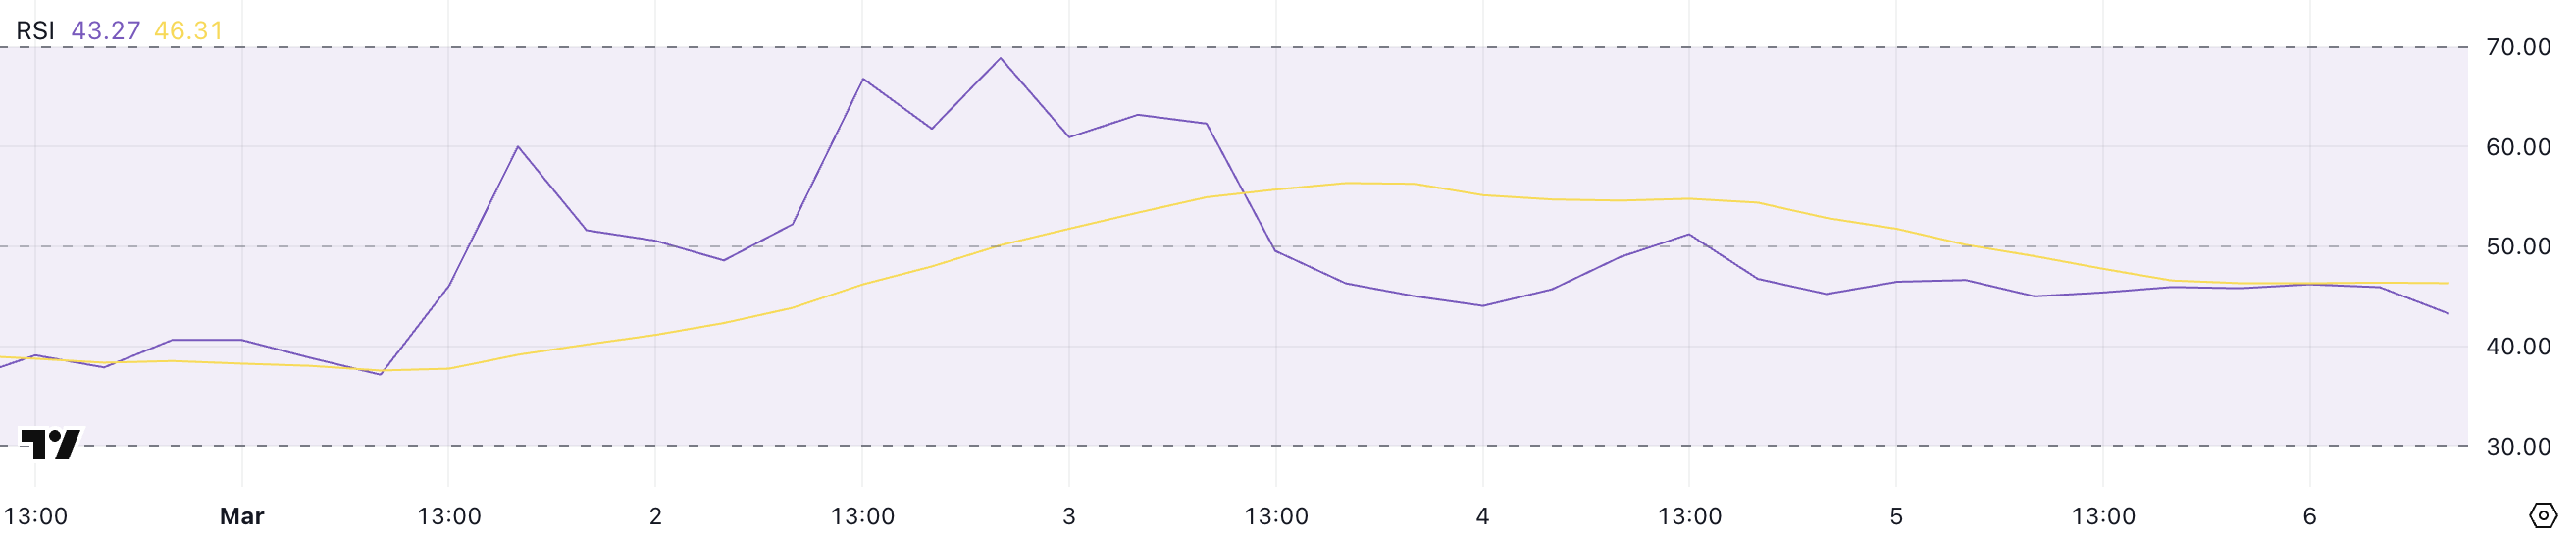
XCN RSI Has Been Neutral For 9 Days
Onyxcoin has an RSI of 43.2, down from its recent high of 68.9 on March 2.
Readings above 70 indicate overbought conditions, suggesting a potential pullback, while readings below 30 signal oversold conditions, which could precede a rebound.
With XCN’s RSI at 43.2, the asset remains in neutral territory, where it has been since February 25.
A move above 50 could indicate growing bullish momentum, while a drop toward 30 may signal increasing selling pressure.
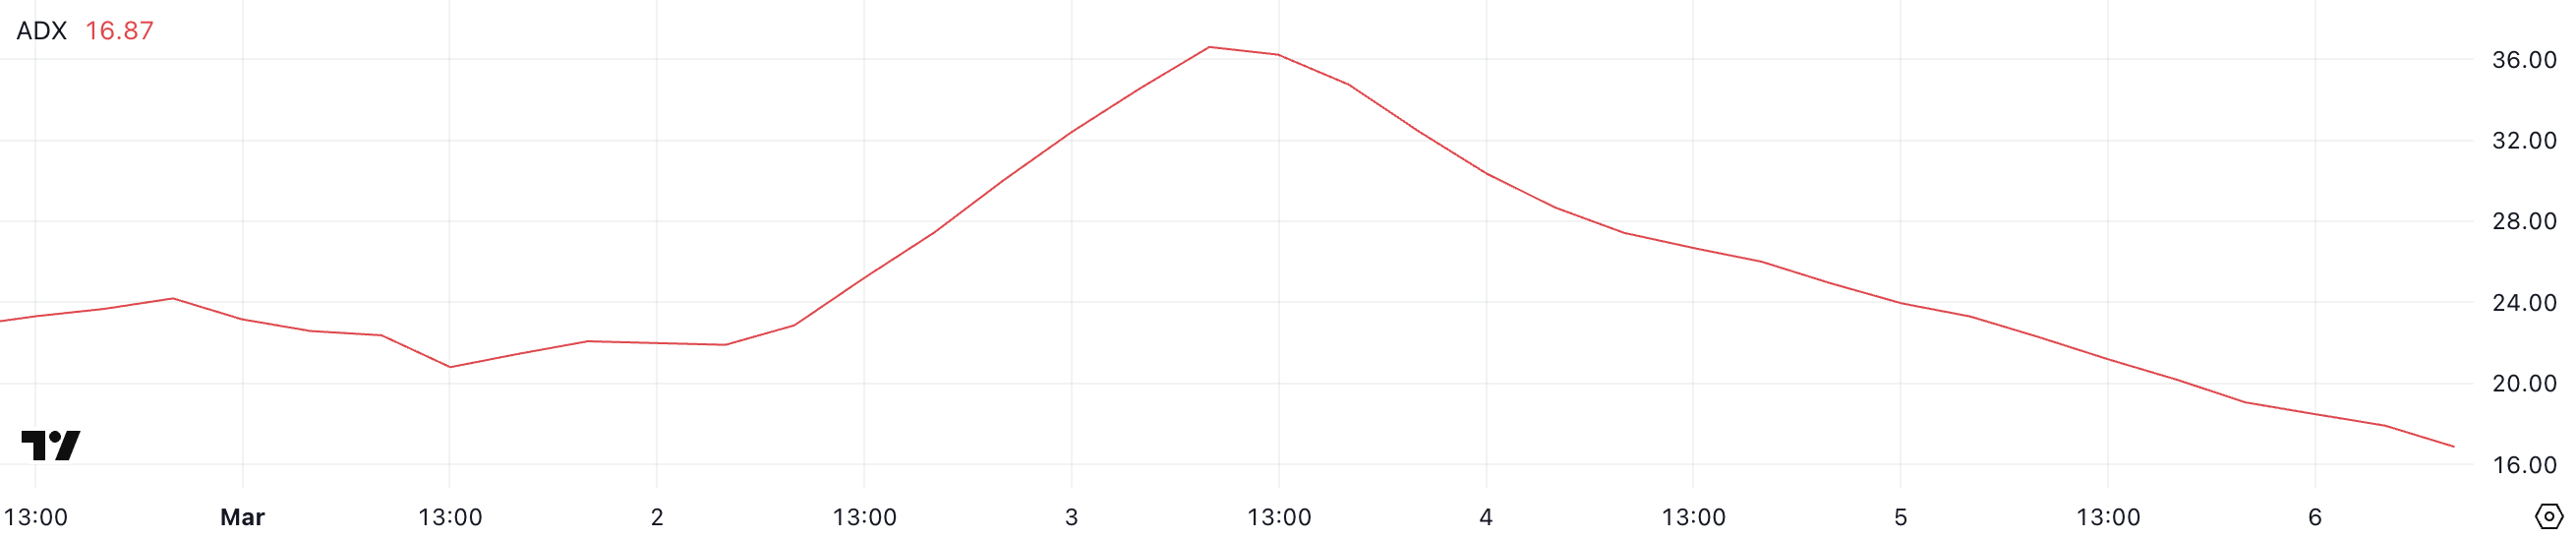
Onyxcoin ADX Shows the Downtrend Is Losing Steam
XCN’s ADX is 16.8, down from 36.6 three days ago, indicating a steady decline in trend strength. This drop suggests weakening momentum, aligning with XCN’s recent downtrend over the past few days.
The Average Directional Index (ADX) measures the strength of a trend on a scale from 0 to 100.
Readings above 25 typically indicate a strong trend, while values below 20 suggest weak or nonexistent trend momentum. With XCN’s ADX at 16.8, the current downtrend lacks strong conviction, meaning further downside may be limited unless momentum picks up again.
After a historical surge in January, when XCN was one of the best-performing altcoins in the market, Onyxcoin’s price is now trading between resistance at $0.017 and support at $0.0143. Its EMA lines show a bearish trend as short-term EMAs remain below long-term ones.
If the ongoing downtrend continues, XCN could test the $0.0143 support level, and a break below that could push the price further down to $0.0134.
However, ADX indicates that the downtrend is weakening, which could open the door for a reversal.
If buying momentum returns, Onyxcoin could test resistance at $0.017, and a breakout above that level could send the price toward $0.022. A stronger recovery, similar to its momentum in January, could push XCN as high as $0.0264.