U.S. Senator Tim Scott (R-S.C.) has introduced new legislation aimed at addressing the growing issue of debanking practices in the country. The Financial Integrity and Regulation Management Act, or FIRM Act, seeks to eliminate the use of reputational risk as a metric for regulating financial institutions.
This move is part of Tim Scott’s ongoing efforts to curb the use of federal banking agencies to push political agendas and restrict access to banking services.
Tim Scott Introduces Bill To End Debanking Practices
The FIRM Act aims to address concerns over the role of reputational risk in the regulation of financial institutions. Reputational risk has been used by federal banking agencies to assess the safety and soundness of financial institutions. The new legislation will eliminate all references to reputational risk as a factor in determining the supervisory ratings of these institutions.
Senator Tim Scott’s bill would also prevent federal banking agencies from creating new rules or guidance based on reputational risk. Additionally, it mandates that these agencies report to Congress on their progress in eliminating reputational risk as a measure for supervision.
As part of this reform effort, Tim Scott expressed concerns about how reputational risk has been used to target certain businesses and individuals, particularly those involved in politically sensitive industries. The legislation is positioned as a way to stop federal regulators from abusing their authority for political purposes.
This Is A Developing News, Please Check Back For More
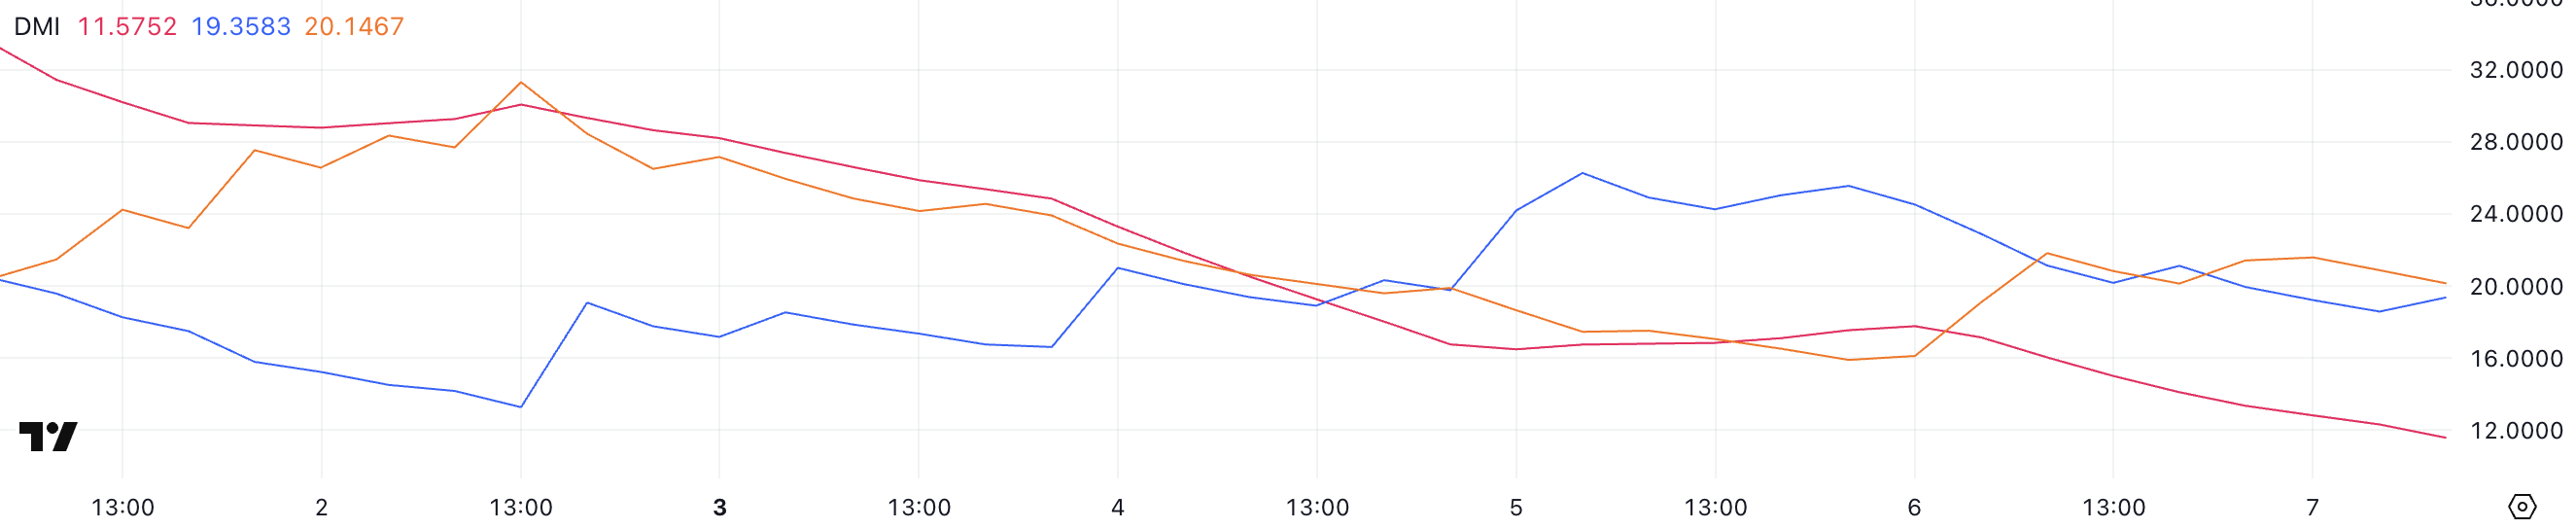
Pi Network (PI) has been consolidating after hitting new highs in late February, with technical indicators showing mixed signals. The DMI chart suggests that sellers are attempting to maintain control, as the +DI has dropped while the -DI is rising, signaling increasing bearish momentum.
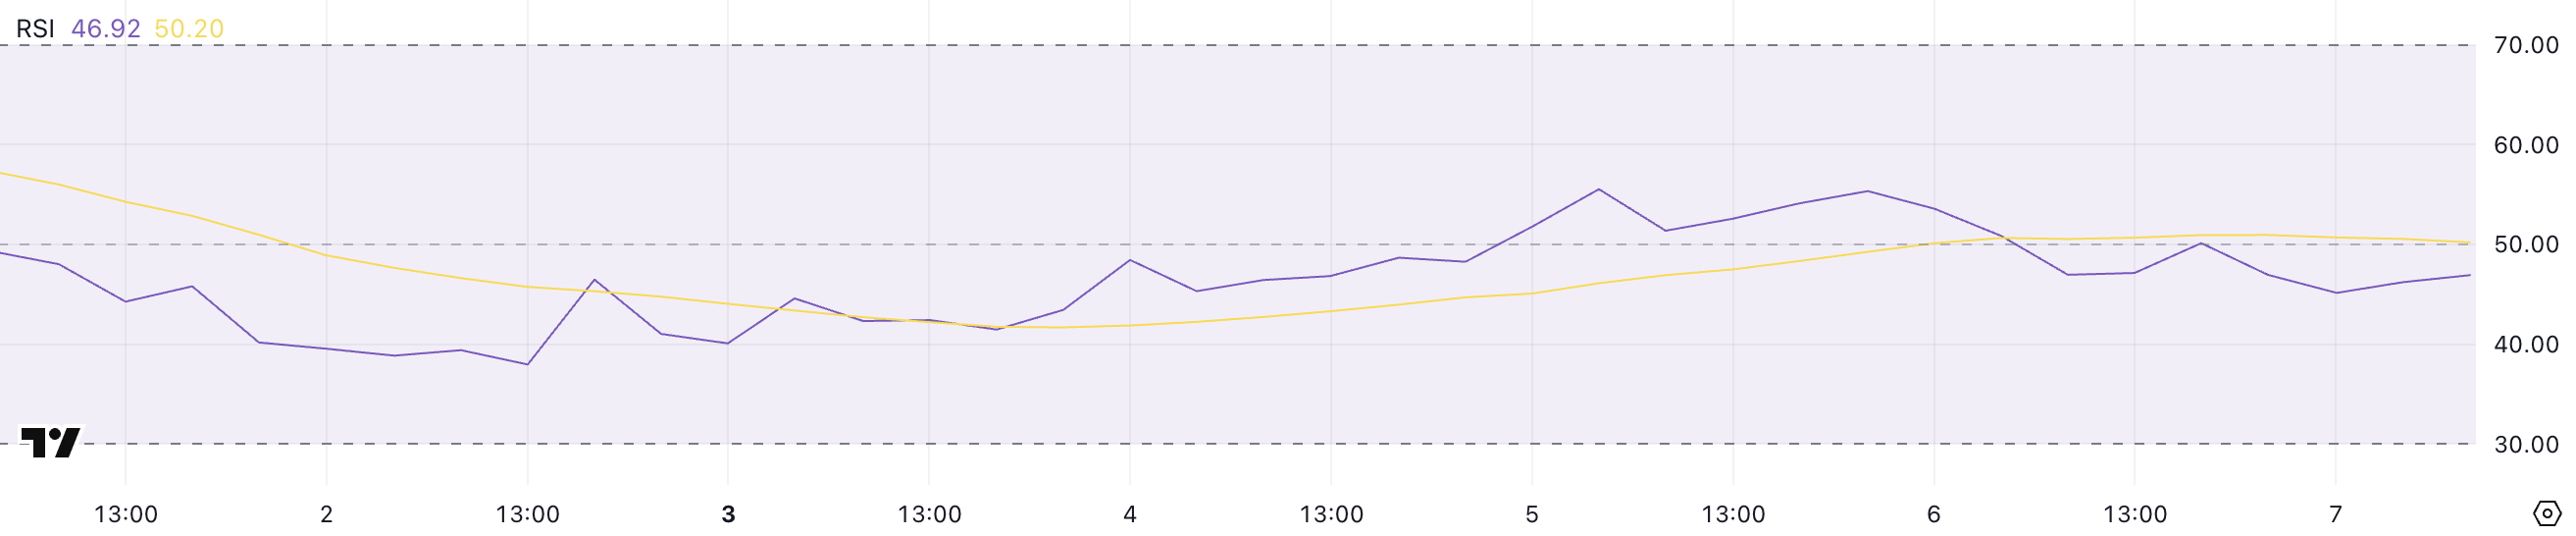
Meanwhile, the RSI remains neutral, fluctuating between 45 and 55, indicating a lack of strong directional movement. If a strong uptrend emerges, PI could break above $2 and potentially test $3, but downside risks remain, especially with the upcoming unlock of 188 million tokens this month.
Pi Network DMI Shows Sellers Are Trying To Keep Control
Pi Network’s DMI chart shows that its ADX has dropped to 11.5, down from 17.7 the previous day.
The Average Directional Index (ADX) measures trend strength on a scale from 0 to 100, with values below 20 indicating a weak trend and readings above 25 suggesting a strong trend.
A declining ADX suggests that the current trend, whether bullish or bearish, is losing momentum and is less likely to continue in the short term.
At the same time, PI +DI has fallen to 19.3 from 24.5, while -DI has risen to 20.1 from 16.1. This shift indicates that bearish momentum is increasing as selling pressure overtakes buying pressure.
For a bullish reversal, +DI would need to reclaim dominance over -DI alongside an ADX increase, confirming a stronger trend direction.
PI RSI Has Been Neutral For 8 Days
Pi Network’s RSI is currently at 46.9, maintaining a neutral stance since February 27 and fluctuating between 45 and 55 for the past three days.
The Relative Strength Index (RSI) is a momentum indicator that measures the speed and magnitude of price movements on a scale from 0 to 100.
Readings above 70 indicate overbought conditions, suggesting a potential pullback, while readings below 30 signal oversold conditions, hinting at a possible rebound. A neutral RSI between 45 and 55 typically reflects a lack of strong momentum in either direction.
With PI RSI sitting at 46.9, the market appears indecisive, lacking clear bullish or bearish momentum. This suggests that Pi Network’s price may remain range-bound unless a significant shift in buying or selling pressure occurs.
For a stronger bullish outlook, the RSI would need to break above 55, signaling increasing buying interest, while a drop below 45 could indicate growing bearish momentum, potentially leading to further price declines.
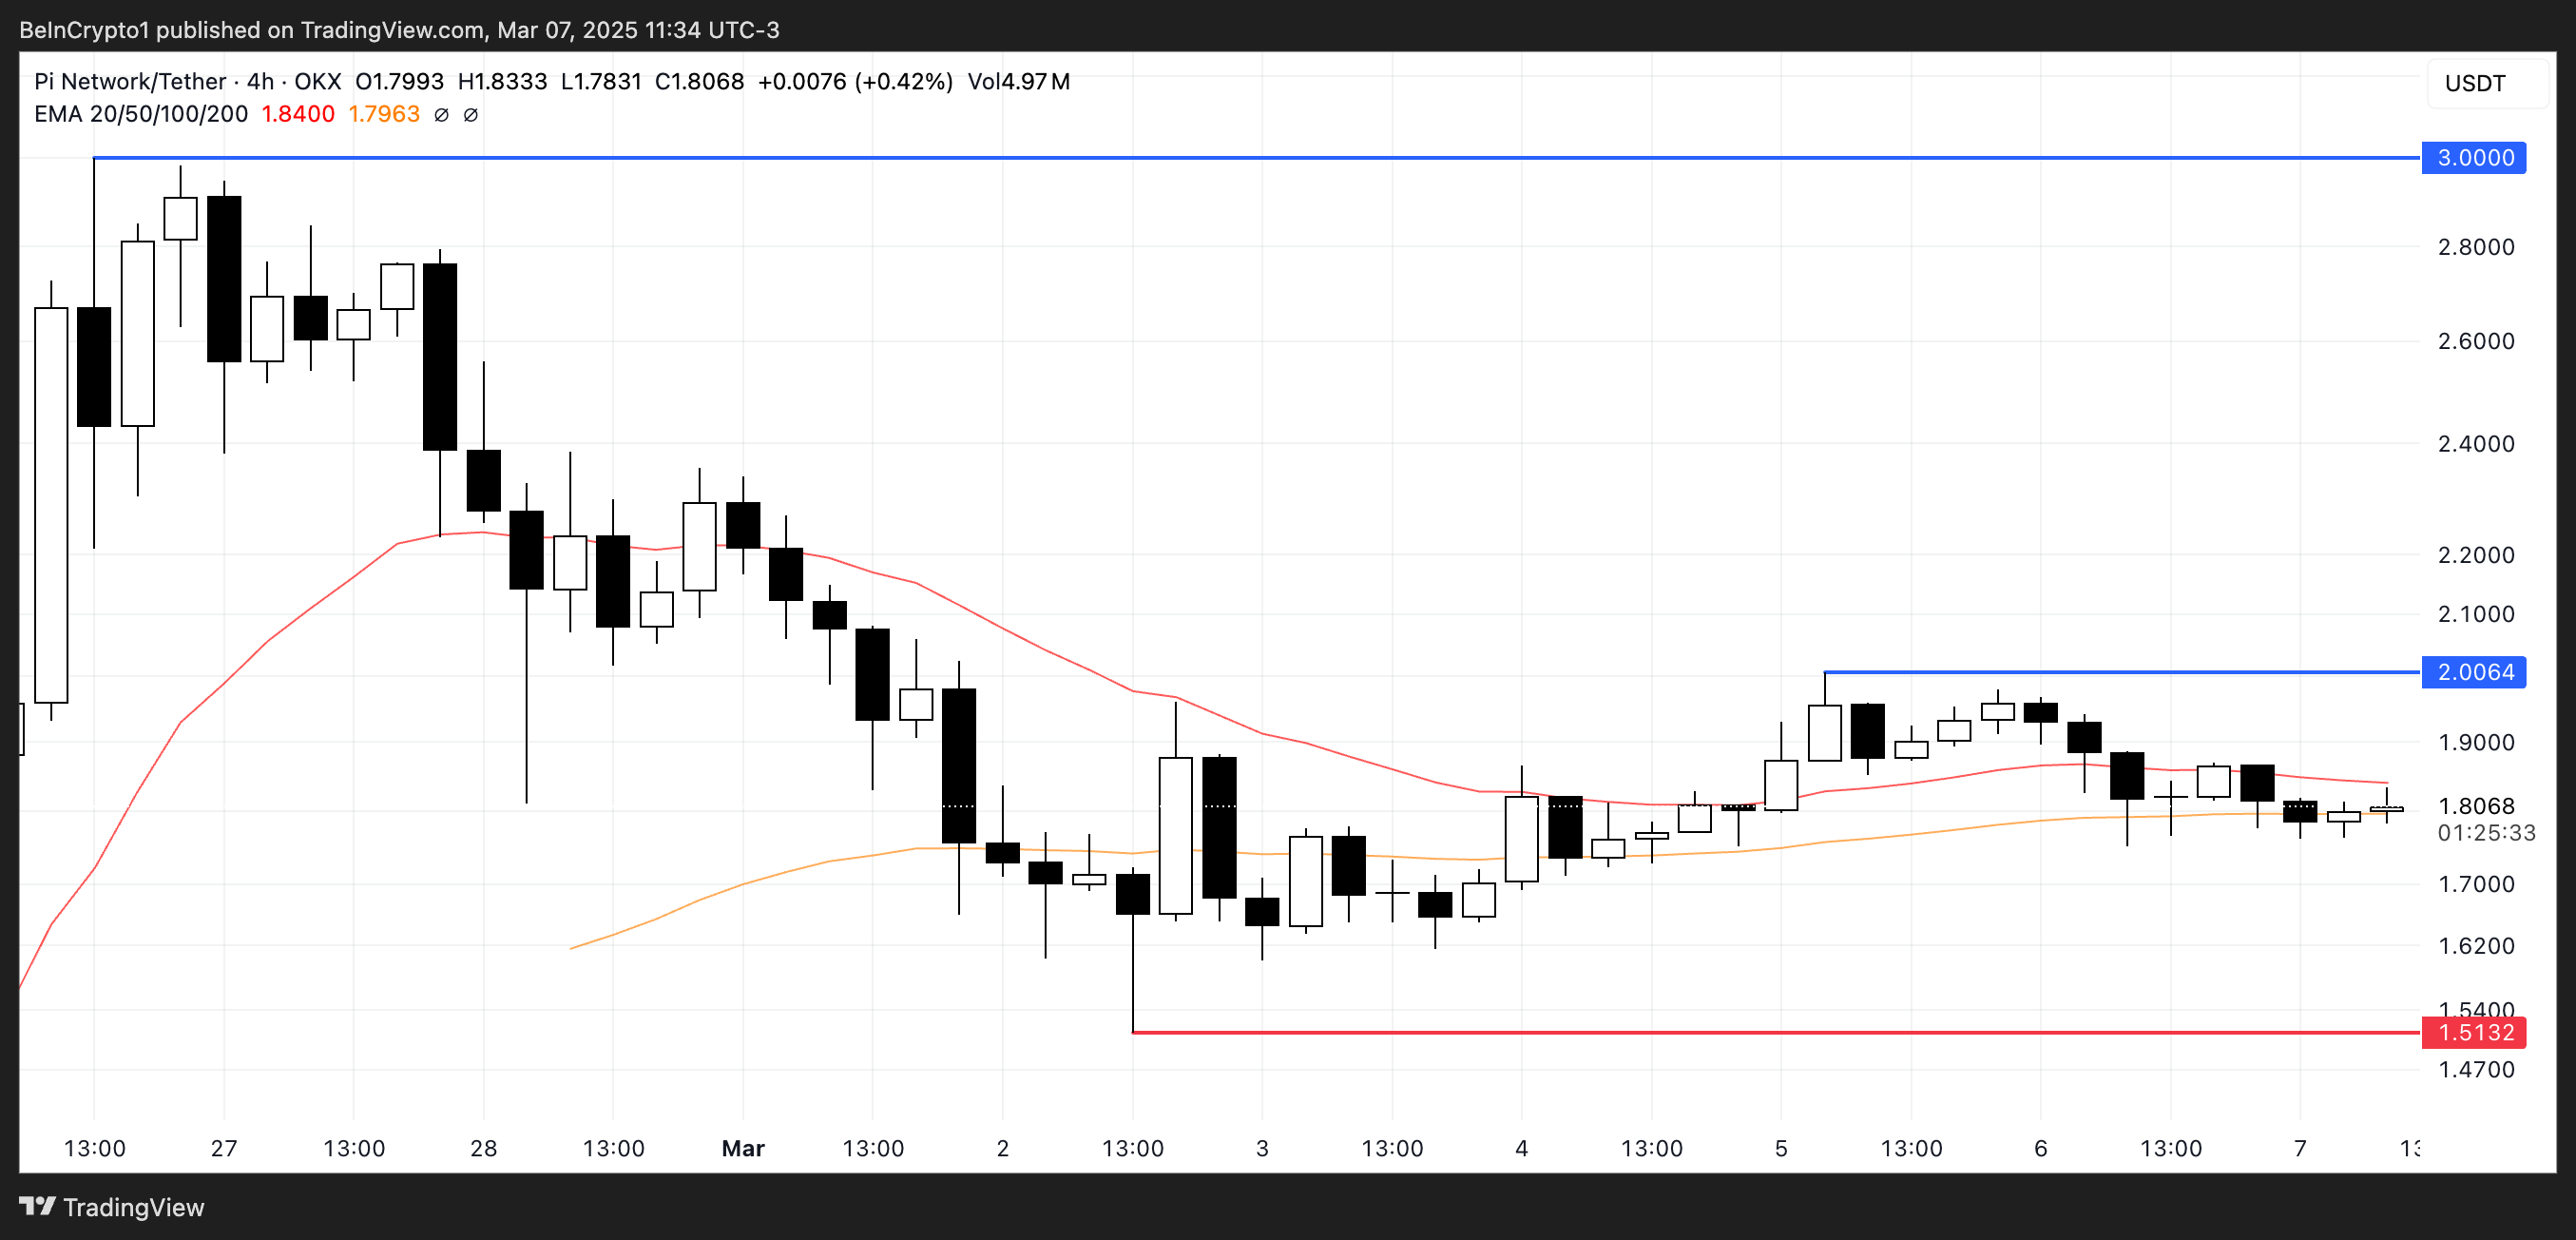
Consolidation periods often indicate a temporary pause in price movement as traders assess the next direction, with the potential for either a continuation of the previous trend or a reversal.
If buying pressure returns and Pi Network resumes its uptrend, it could first test resistance around $2. A breakout above this level, combined with strong momentum, could push Pi toward $3 and even higher, marking new all-time highs.
However, if the uptrend fails to materialize and selling pressure increases, PI price could enter a corrective phase. In this scenario, the price could decline toward $1.51. Its next price movements could be driven by its 188 million token unlock, which will take place this month.
Cardano price has moved sideways this month, but could be ripe for a strong bullish breakout if Bitcoin rises to $100k as Arthur Hayes predicts. ADA token was trading at $0.640 on Tuesday, a consolidation that may be calm before the storm.
Cardano Price Could Benefit if Bitcoin Hits Arthur Hayes’ Prediction
Arthur Hayes, the founder of BitMex, has come up with a highly bullish Bitcoin price prediction. In an X post this week, he predicted that the coin would eventually surge to $100K in the near term. Such a move would imply a 13% surge from the current level.
Arthur Hayes Bitcoin Price Prediction
Technicals suggest that this prediction is possible as BTC price has formed a double-bottom pattern at $76,485. This is one of the most bullish patterns in technical analysis. A bullish breakout is confirmed once the coin rises above the neckline, which is at $88,415.
A clear breakout above that level will raise the odds of Bitcoin price soaring above $90,000, followed by the psychological level at $100,000. Robert Kiyosaki believes that the Bitcoin price may surge to $180k this year.
Bitcoin Price Chart
Bitcoin has another catalyst: its role as a safe haven. With gold price reaching a record high, there are signs that investors are moving to BTC, which has similar characteristics. Spot Bitcoin ETFs have had inflows in the last two days as the stock market crashed.
Therefore, a Bitcoin price recovery would benefit other altcoins like Cardano, Solana, Pepe, and Hedera Hashgraph. Historically, these assets have a close correlation with Bitcoin.
ADA Price Analysis: Forms a Bullish Pattern
ADA price has been in a downtrend after peaking at $1.322 in November last year. It bottomed to a low of $0.512, its lowest swing this month.
While Cardano remains below the 50-day and 200-day EMAs, it has formed a rare and highly bullish reversal sign. It has formed a falling wedge, which is characterized by two downtrending and converging trendlines.
ADA price has also formed a small bullish pennant. This pattern features a flagpole-like shape and a symmetrical triangle. It often leads to more gains, which is triggered when the two lines near their confluence level.
Cardano Price Chart
Therefore, Cardano price will likely have a bullish breakout. If this happens, the next level to watch will be $1, up by 55% from the current level.
The bullish ADA price forecastwill be canceled if the coin crashes below the lower line of the bearish pennant. A drop below that level will bring the support at $0.456 to view. This price is at the highest swing in July last year.
The DeFi ecosystem on the TON network has significantly grown in the recent past bolstered by the Telegram community.
TON price has been consolidating in a symmetrical triangle since early December.
The wider altcoin market, including Toncoin (TON), recorded a mild correction in the past 24 hours. After an impressive rally last week, the wider altcoin market experienced a significant cooling down of the bullish sentiment, hence resulting in $357 million forced liquidations of long traders.
TON price dropped nearly 4 percent in the past 24 hours to trade about $3.09 on Thursday, May 15, during the late North American trading session. As a result, the large-cap altcoin, with a fully diluted valuation of about $15.8 billion and a 24 hour average traded volume of about $229 million, had dropped about 4 percent in the past two weeks.
Toncoin Network Thrives on Telegram Messenger
The TON ecosystem has grown exponentially in the recent past mainly fueled by the vast Telegram community. According to market data from Defillama, the TON network had a total value locked of about $152 million and a stablecoins market cap of around $1.01 billion at the time of this writing.
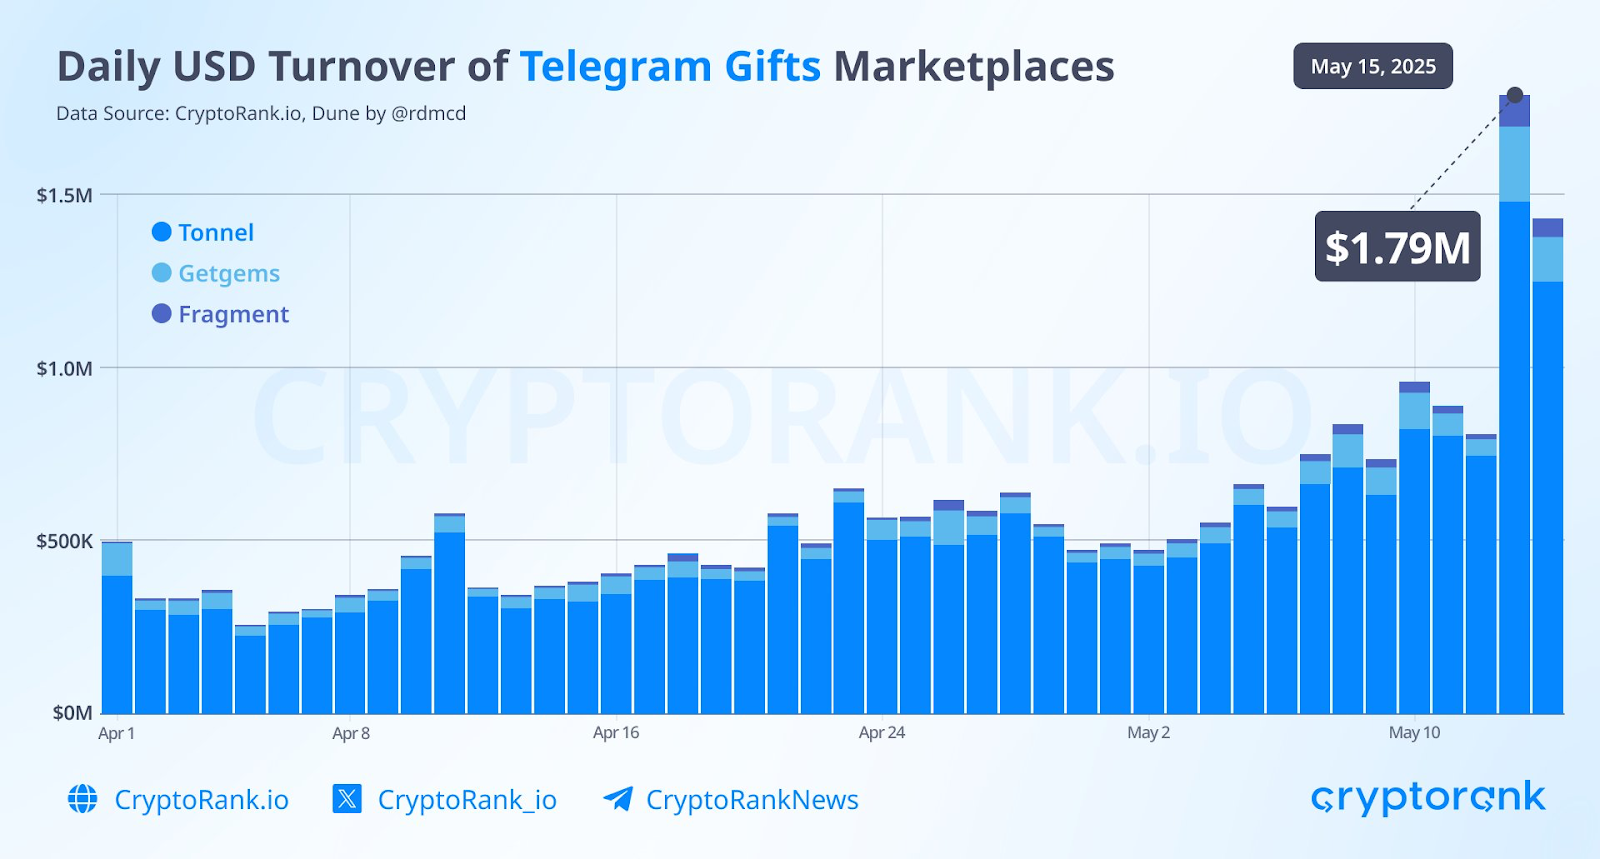
Meanwhile, market data from CryptoRank shows that the Telegram Gifts daily turnover has been growing exponentially since early May, reaching $1.8M two days ago. The majority of Telegram NFT volume came from the Tonnel platform with about $1.2 million, and Fragment with about $220K.
What Next for TON Price
Since hitting its all-time high, about $8.25 on June 15 2024, the TON price has been trapped in a correction mode to date. However, TON price has established a robust support level above $2.5, which previously acted as a resistance level.
In the daily timeframe, TON price has been consolidating in a symmetrical triangular pattern since early March. Crypto analyst Ali Martinez opined that TON price is well positioned for at least a 47 percent pump if a breakout above the upper border occurs in the coming days.
The post Toncoin Price Analysis and Short Term Targets appeared first on Coinpedia Fintech News
The DeFi ecosystem on the TON network has significantly grown in the recent past bolstered by the Telegram community. TON price has been consolidating in a symmetrical triangle since early December. The wider altcoin market, including Toncoin (TON), recorded a mild correction in the past 24 hours. After an impressive rally last week, the wider …