If you’re worried that dietary changes alone might not be enough to keep your bones strong, talk to your healthcare provider. Together you can discuss options for supporting bone health and preventing osteoporosis.
The cryptocurrency market has rebounded slightly this week following President Trump’s Monday announcement of the Israel-Iran ceasefire.
Some assets have since extended their rallies, while others posted more tepid performances, struggling to maintain upward momentum. Amid this mixed market recovery, on-chain data reveals that crypto whales have been quietly accumulating select altcoins, including UNI, WLD, and SAND.
Uniswap (UNI)
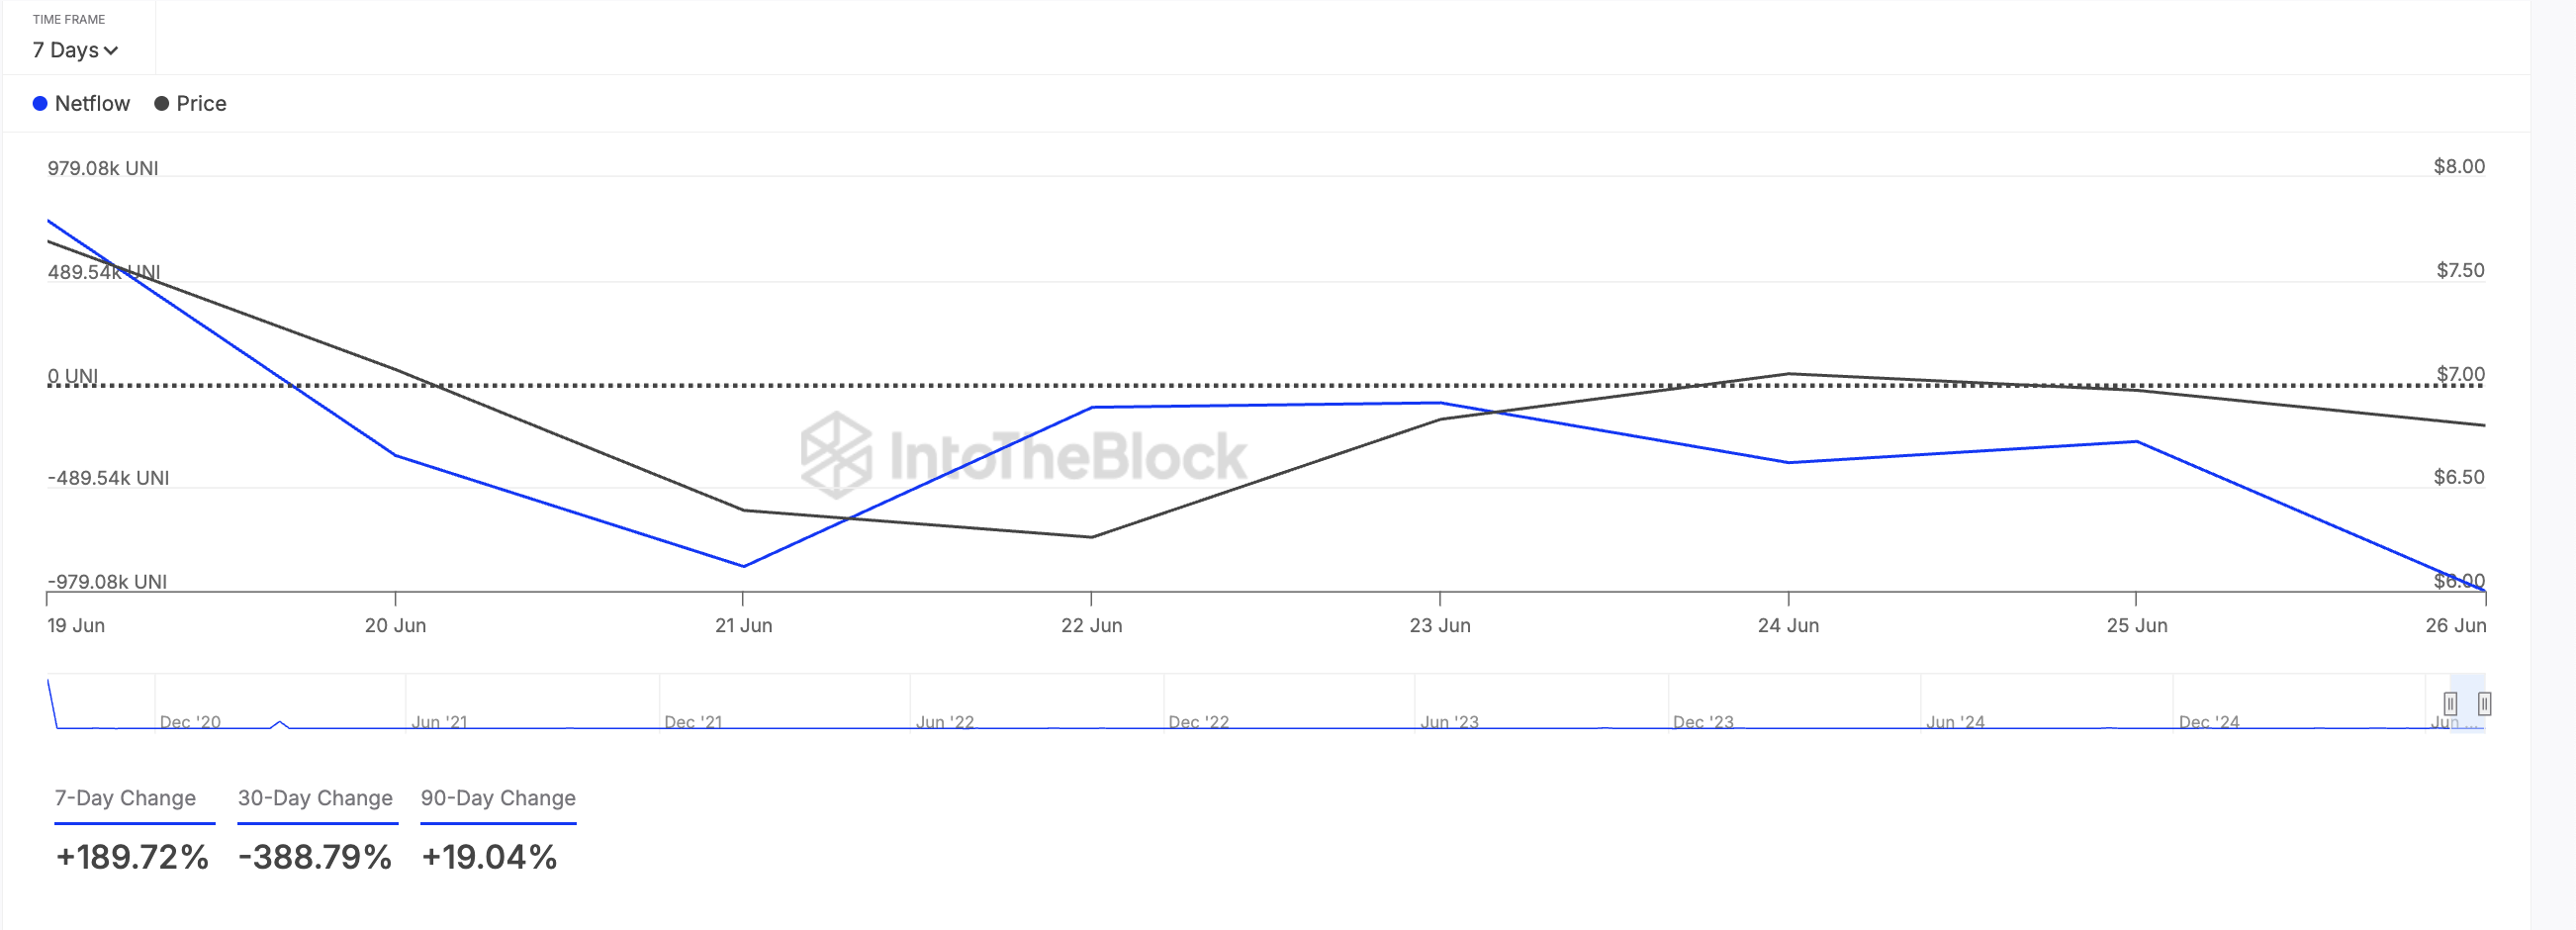
This week, decentralized finance (DeFi) token UNI has received significant whale attention. This is reflected by its large holders’ netflow, up 190% over the past seven days, per IntoTheBlock.
Large holders are investors that hold more than 0.1% of an asset’s circulating supply. Their netflow measures the difference between the amount of tokens that they buy and sell over a specified period. When it surges like this, it signals strong accumulation by whales, suggesting growing confidence or a bullish outlook on the asset.
Moreover, the surge in large holder netflow could prompt retail traders to ramp up their UNI accumulation. If this buying pressure continues, the altcoin could break into the $7 price zone.
On the other hand, if demand falls, the token’s price could dip to $5.91.
Worldcoin (WLD)
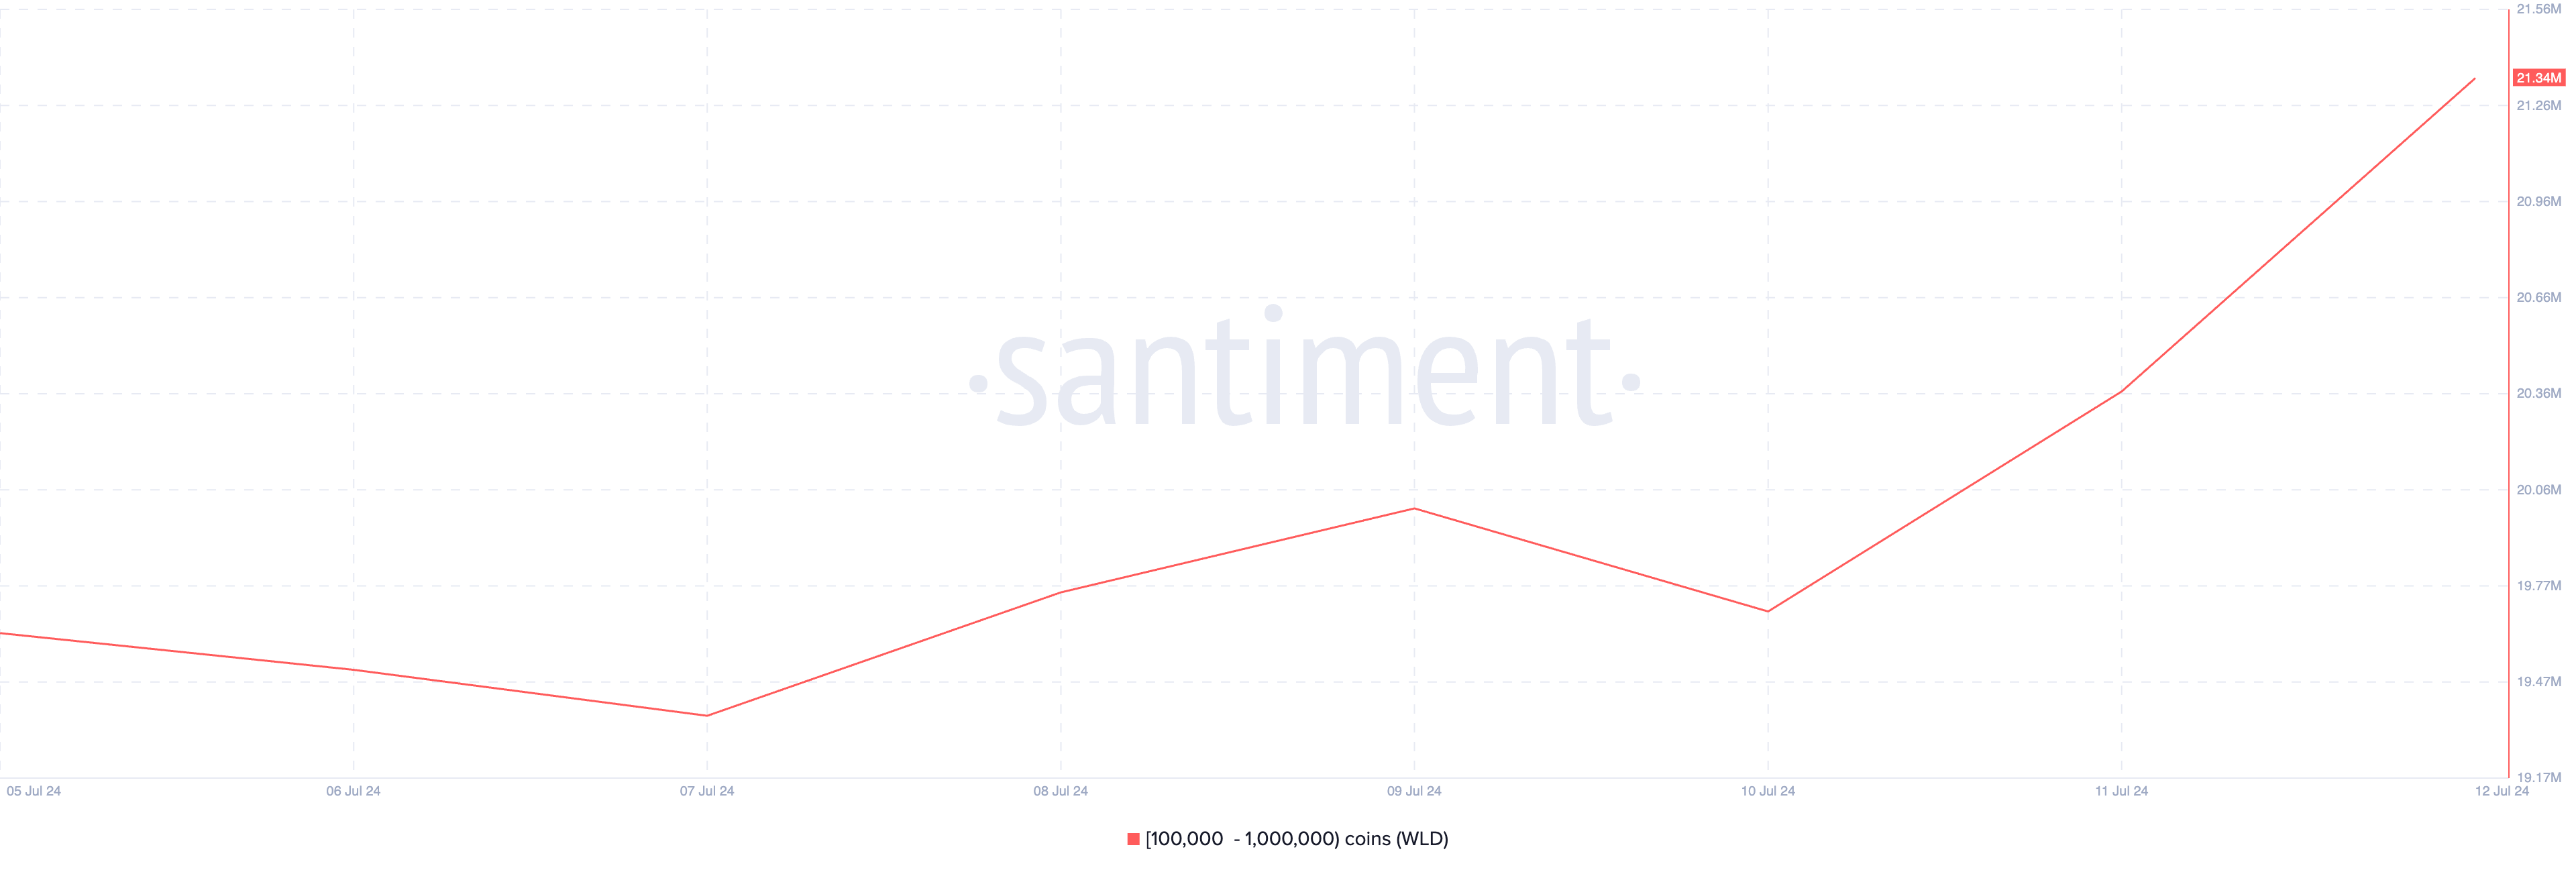
WLD, the token that powers Sam Altman’s Worldcoin, is another altcoin that crypto whales have bought this week. Data from Santiment shows a notable rise in the coin holding of whale wallet addresses that hold between 100,000 and 1 million WLD tokens.
During the week in review, this cohort of WLD holders acquired 1.72 million tokens, which are currently valued at over $3 million.
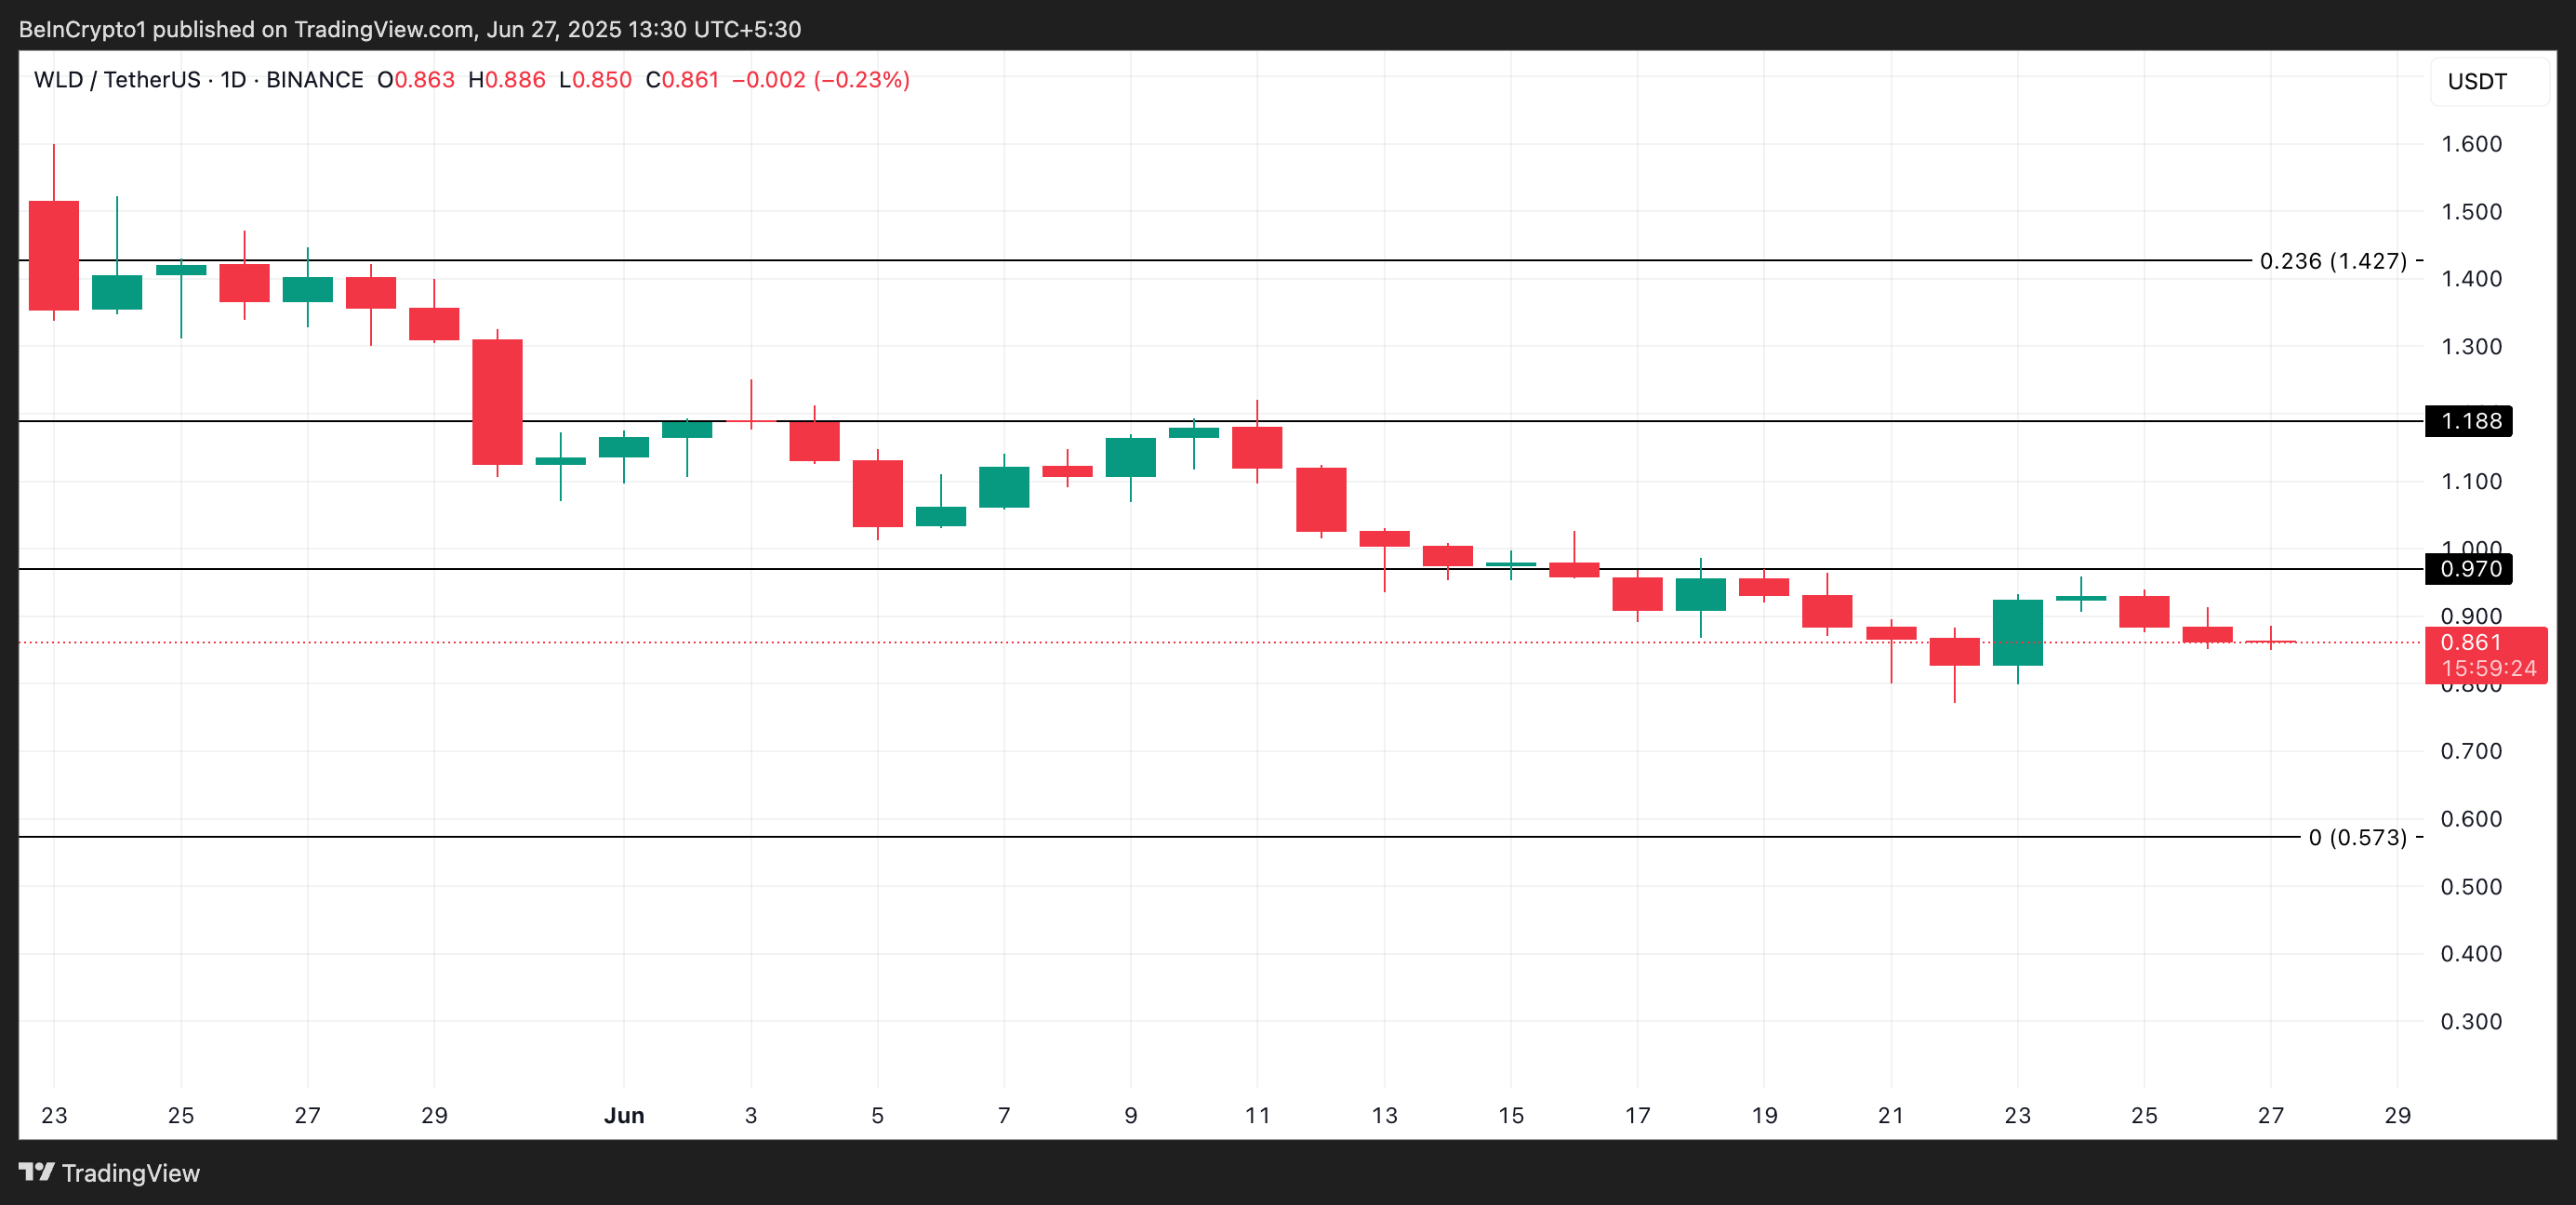
However, if sentiment flips bearish and whales sell for profit, WLD could shed some of its value and plunge toward $0.57.
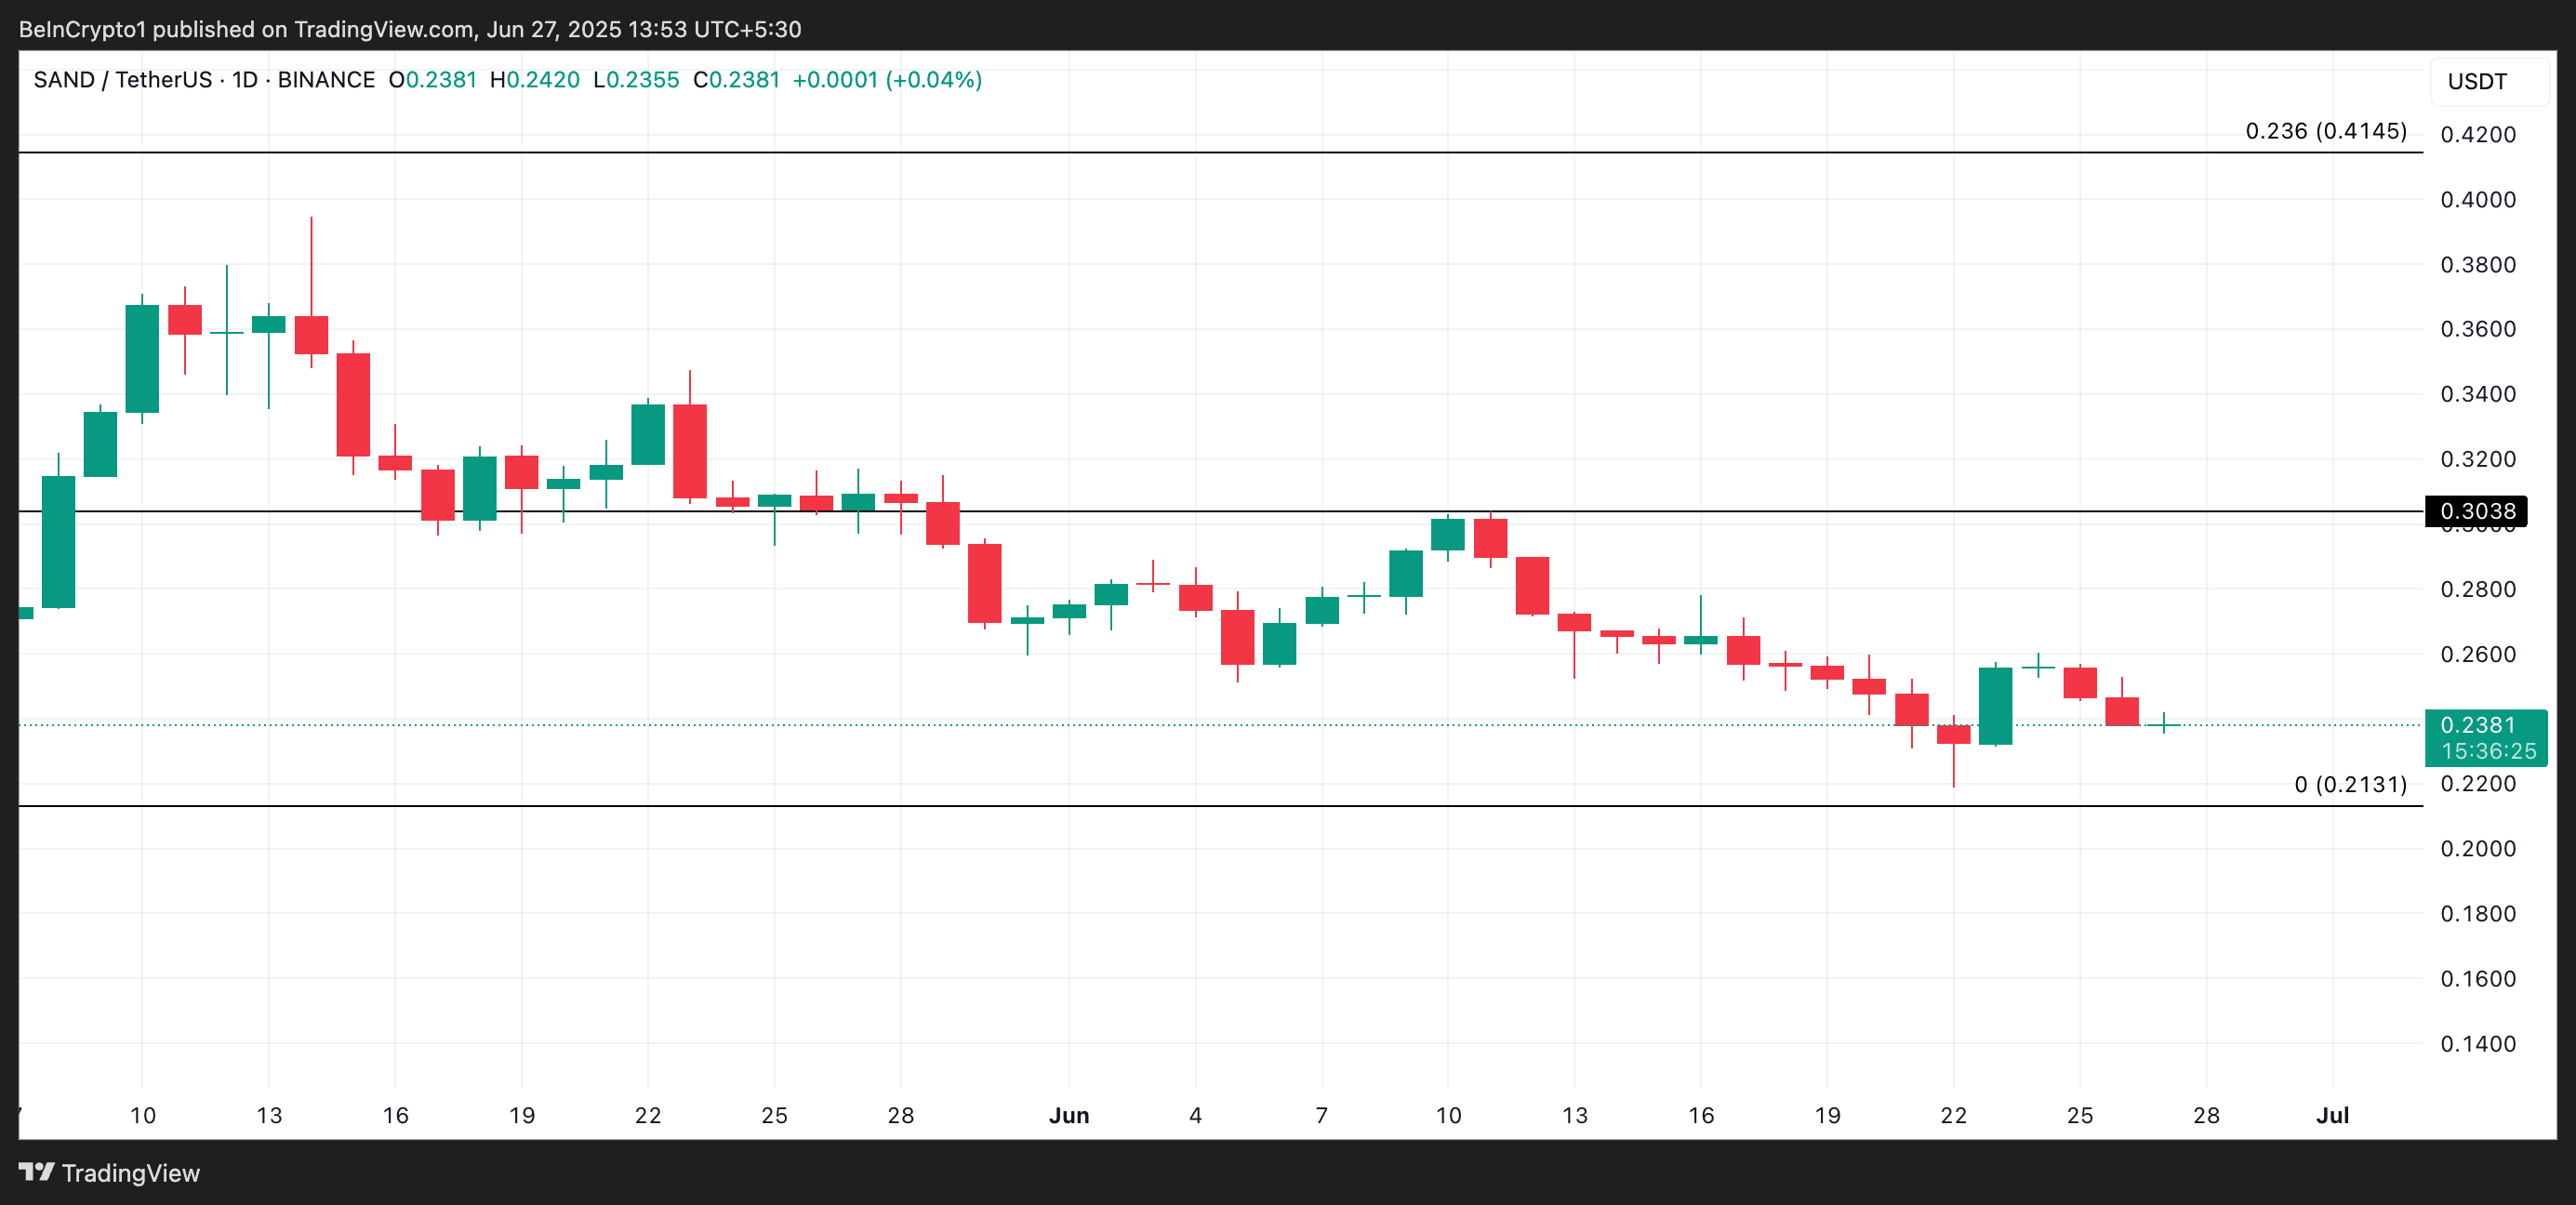
The SandBox (SAND)
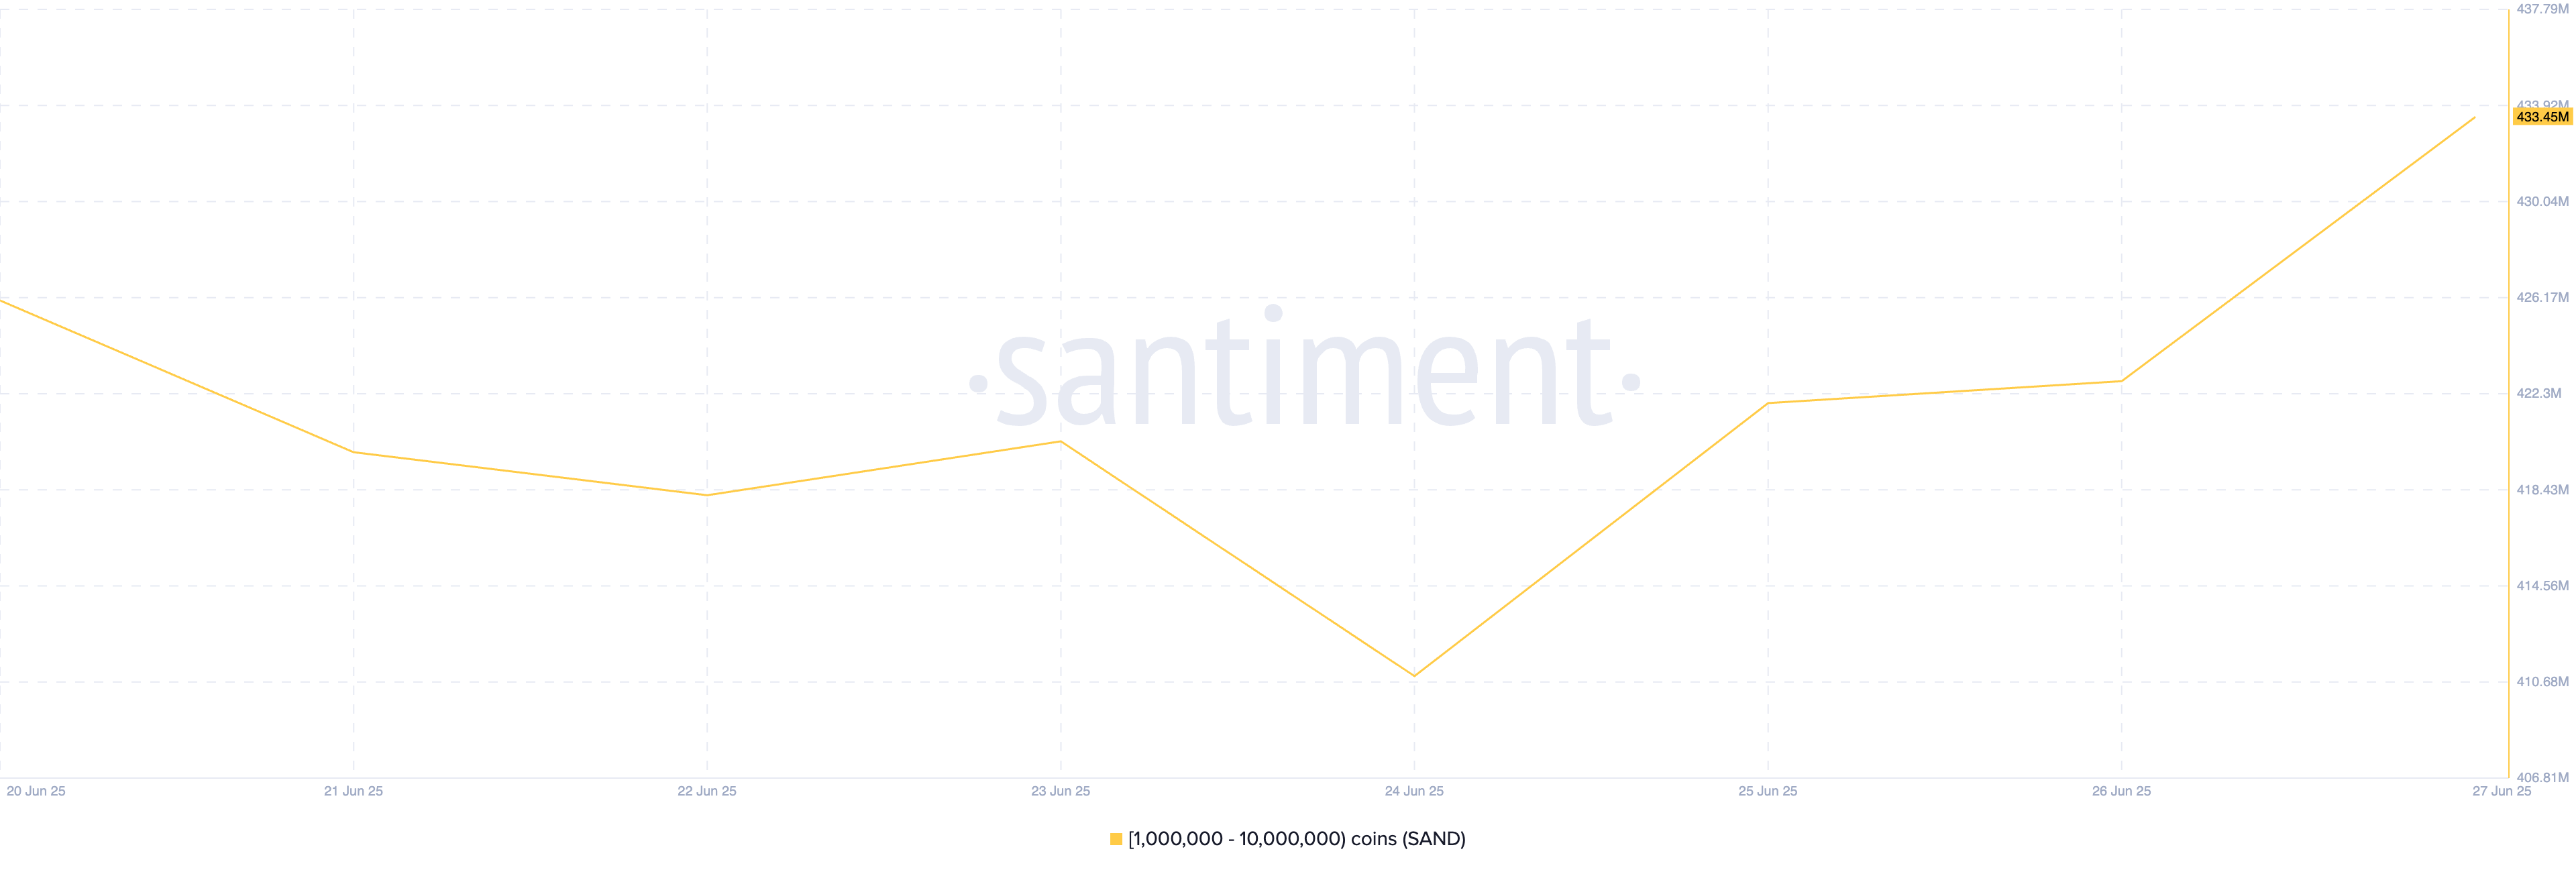
Metaverse-based token SAND is another asset that has seen a surge in crypto whale activity this week. According to data from Santiment, large investors holding between 1 million and 10 million tokens have accumulated 7.45 million SAND over the past week.
This significant uptick in whale accumulation suggests growing confidence in SAND’s long-term potential.
If this buying trend extends to retail traders, it could further strengthen the token’s bullish momentum in the coming weeks and push its price toward $0.30.
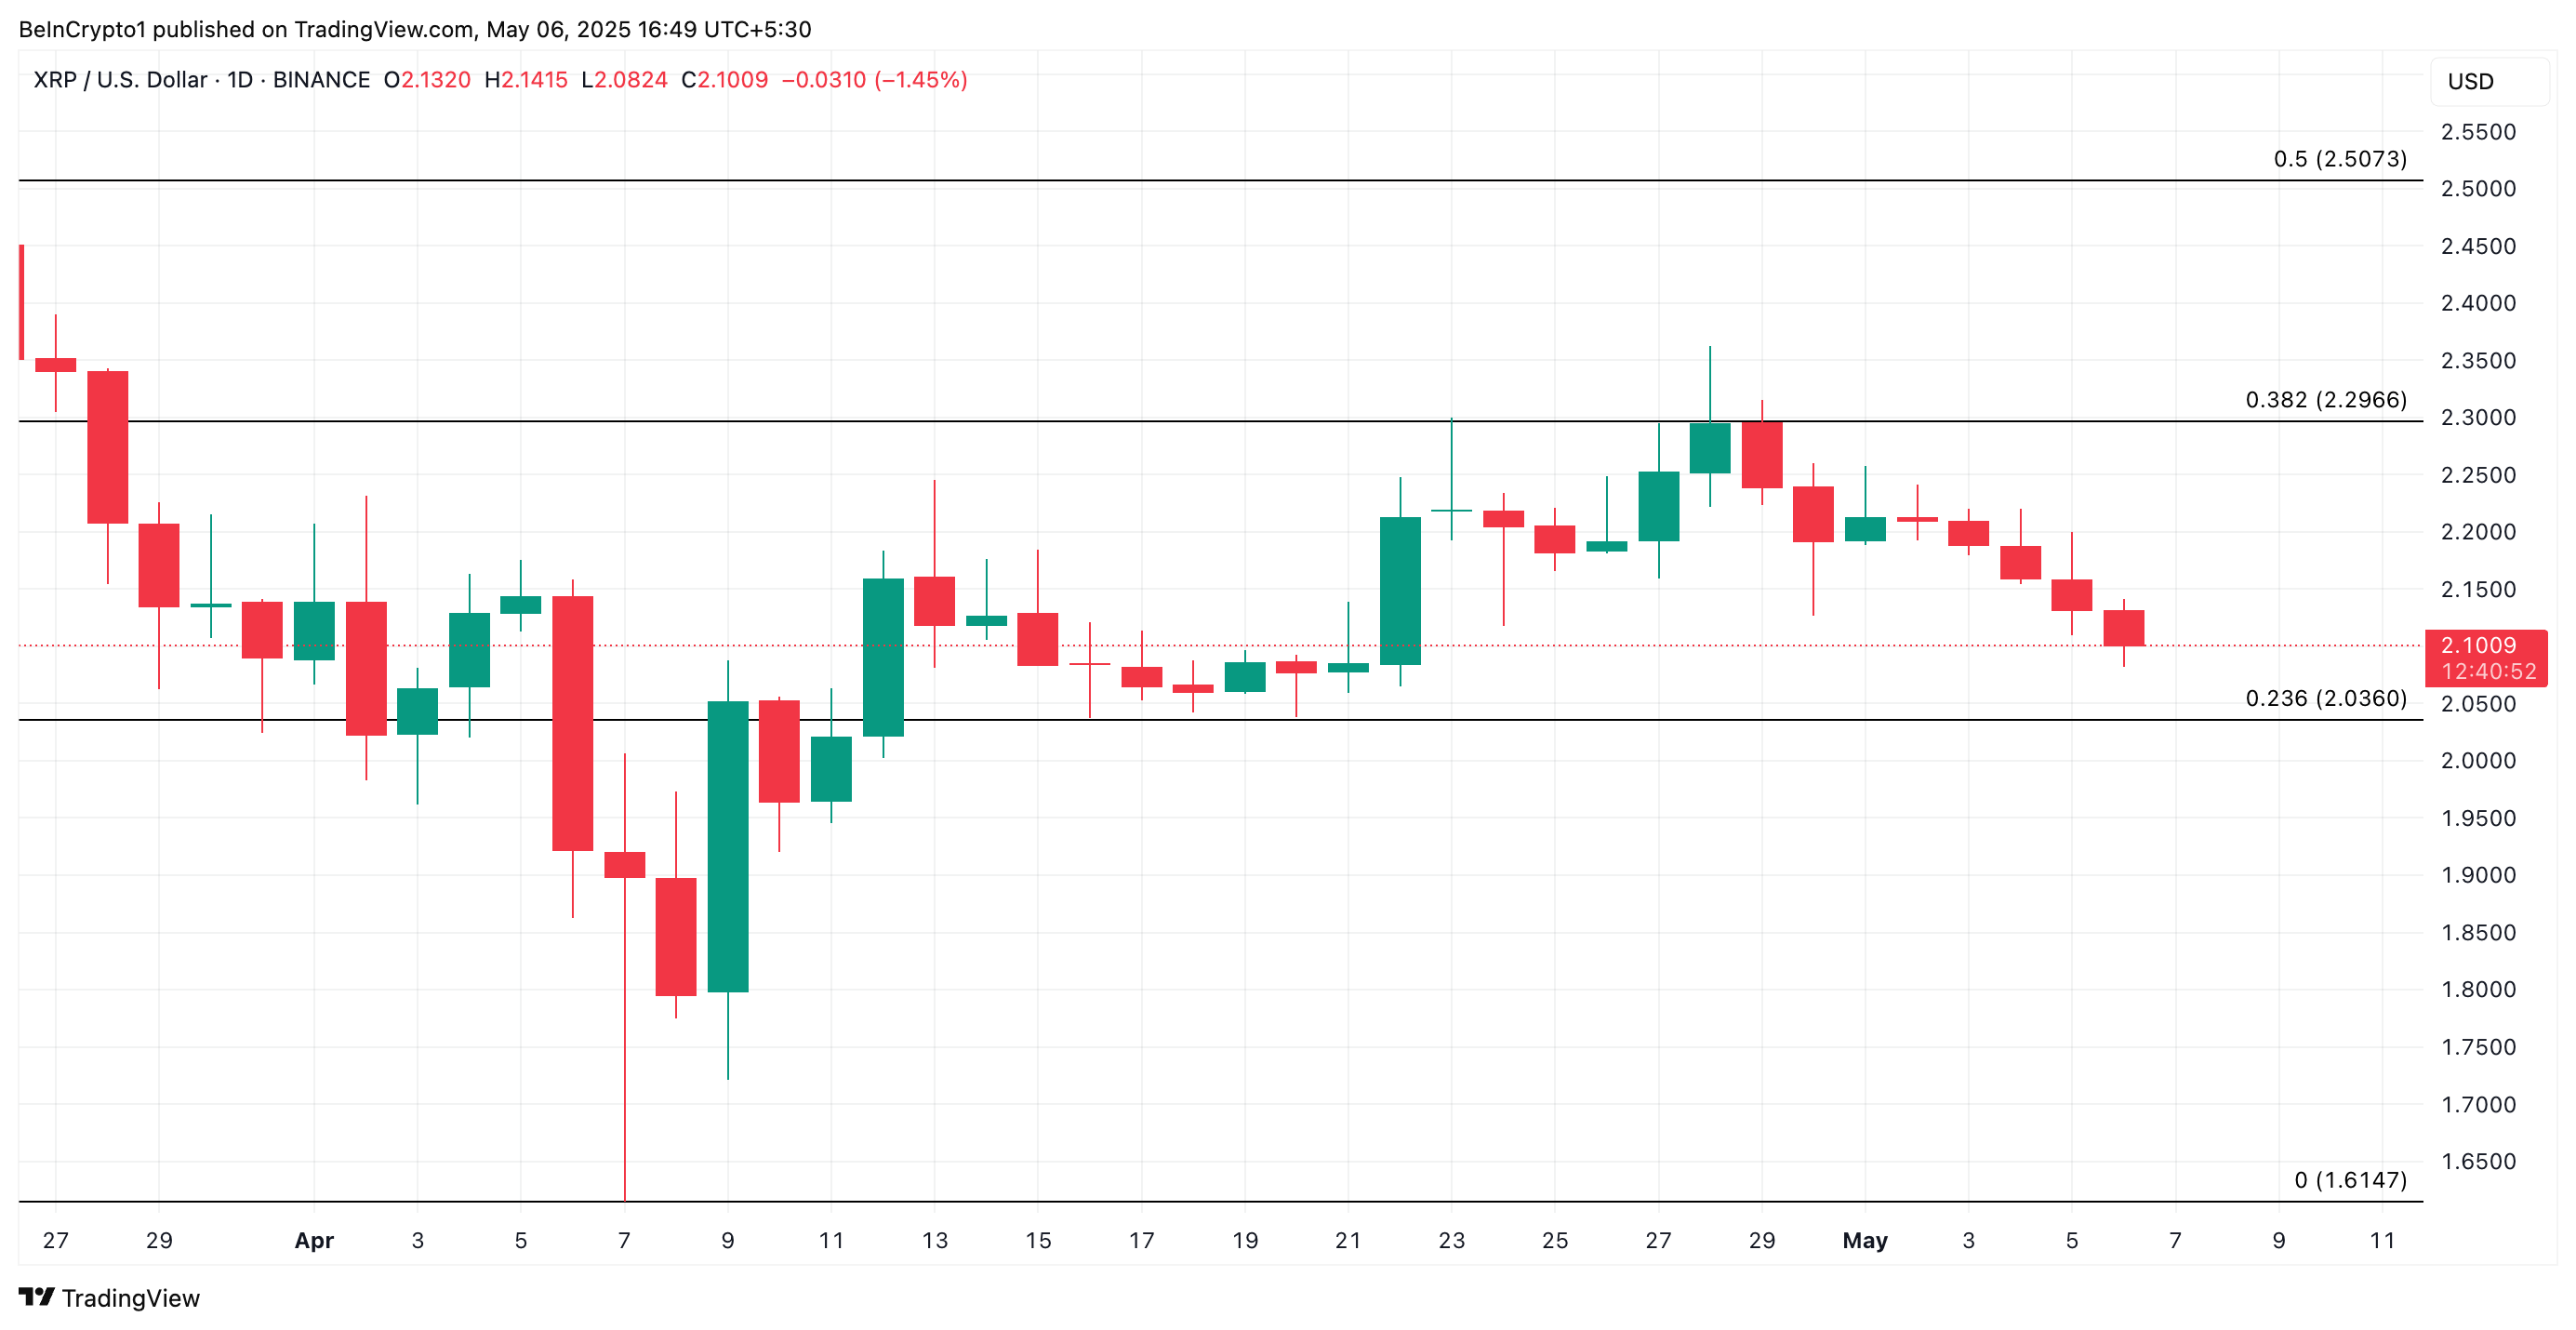
XRP’s price has declined significantly over the past week. The token currently trades at a seven-day low of $2.09, and key indicators suggest that the downtrend may continue in the near term.
Market data shows a steady rise in the demand for short positions. This trend reveals growing trader confidence in further downside movement, with short sellers increasing their exposure in anticipation of the XRP token’s continued weakness.
XRP Faces Prolonged Sell Pressure
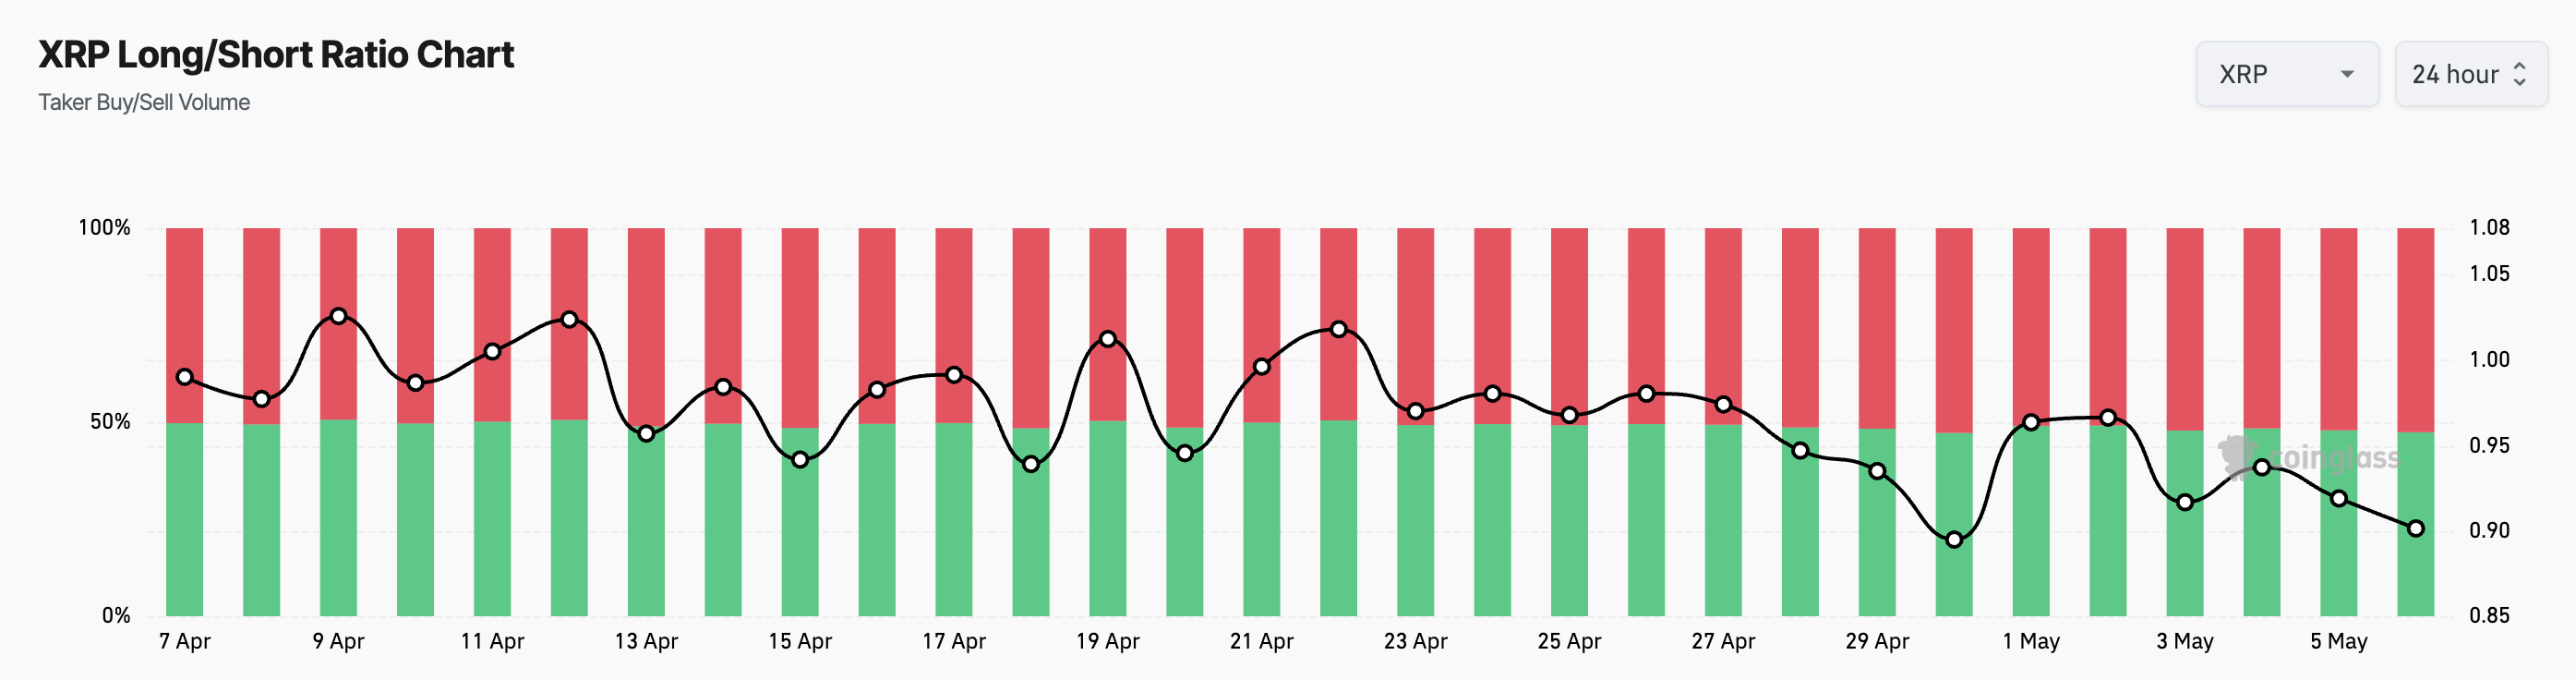
XRP’s long/short ratio reflects the bearish bias dominating its futures market. At press time, the ratio stands at 0.98, indicating more traders are betting against the altcoin.
This ratio compares the number of long and short positions in a market. When an asset’s long/short ratio is above 1, there are more long than short positions, indicating that traders are predominantly betting on a price increase.
Conversely, as seen with XRP, a ratio below one indicates that most traders are positioning for a price drop. This reflects heightened bearish sentiment and growing expectations of continued downside movements.
According to Coinglass, XRP last recorded a long/short ratio above one on April 22. This means it has been over two weeks since bullish positions outnumbered bearish ones in the XRP futures market. The extended period of bearish dominance suggests that market participants have grown increasingly pessimistic about XRP’s short-term prospects.
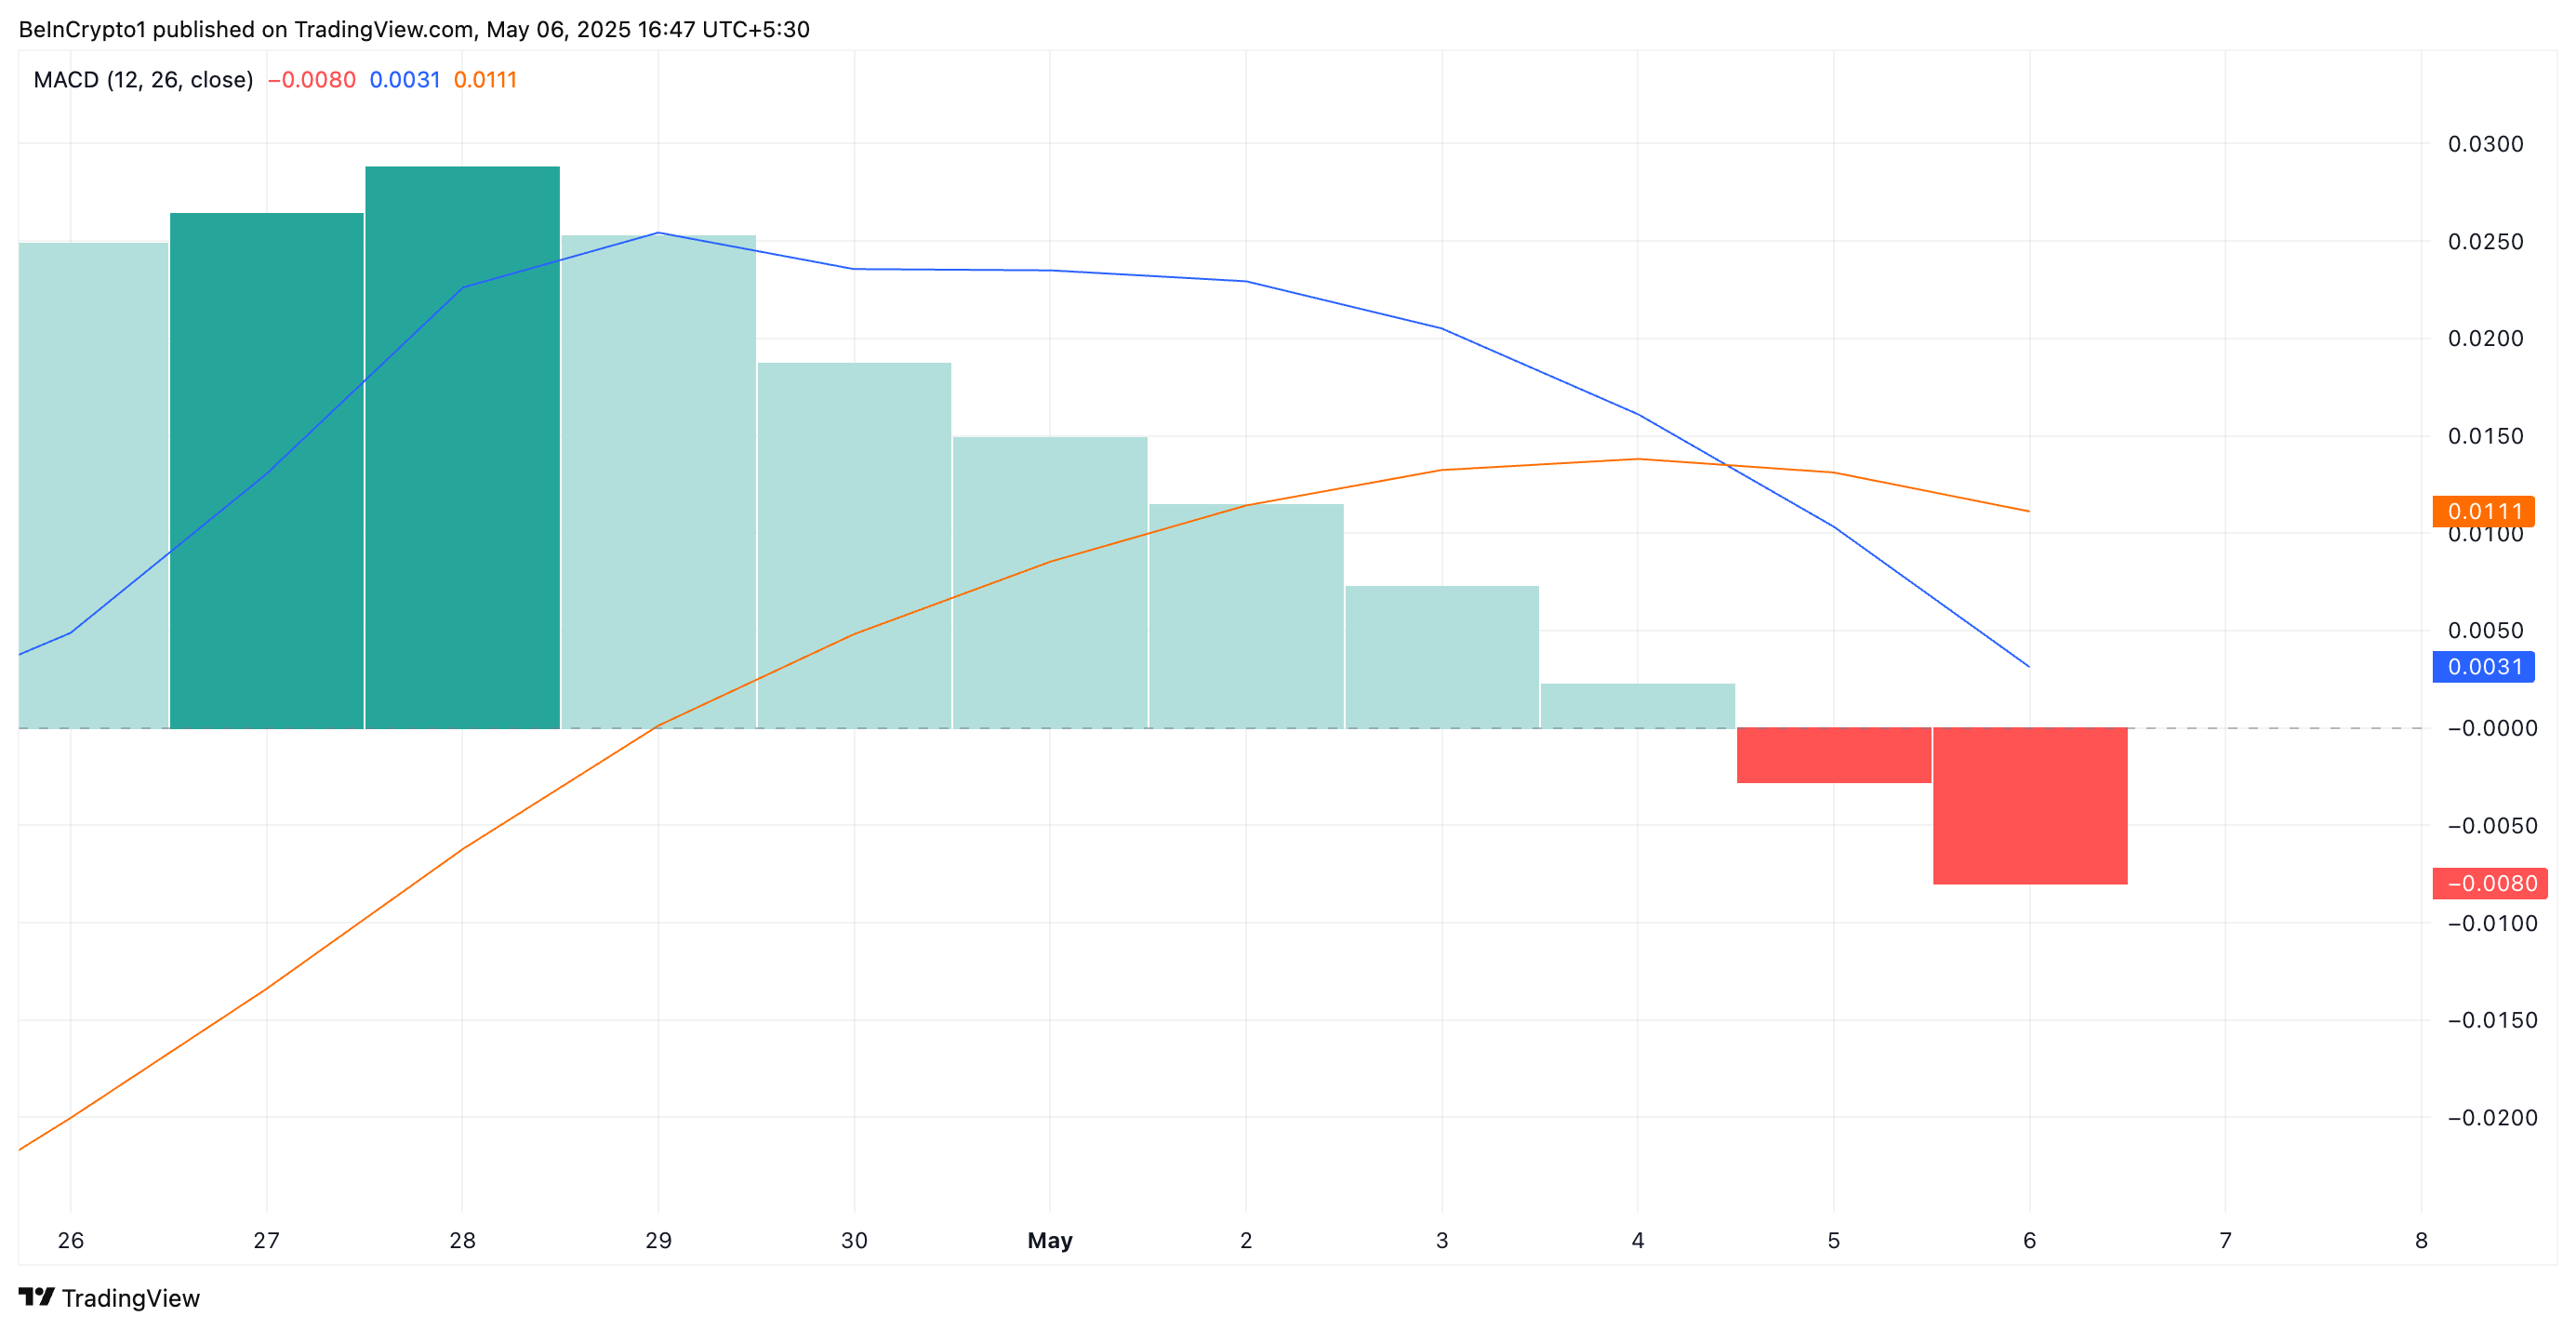
On the daily chart, the newly formed “death cross” by XRP’s Moving Average Convergence Divergence (MACD) indicator supports this bearish outlook. Readings from the XRP/USD one-day chart have revealed that XRP’s MACD line (blue) closed below its signal line (orange) on Monday, forming a death cross.
This pattern is a notable marker of a sustained downtrend and is widely viewed by traders as a sign of weakening price strength. Hence, XRP risks plummeting further.
XRP Holds Key Support at $2.09 — But for How Long?
XRP currently trades at $2.10, resting above the support formed at $2.03. If selloffs strengthen, the support floor could weaken, making way for a price decline toward $1.61.
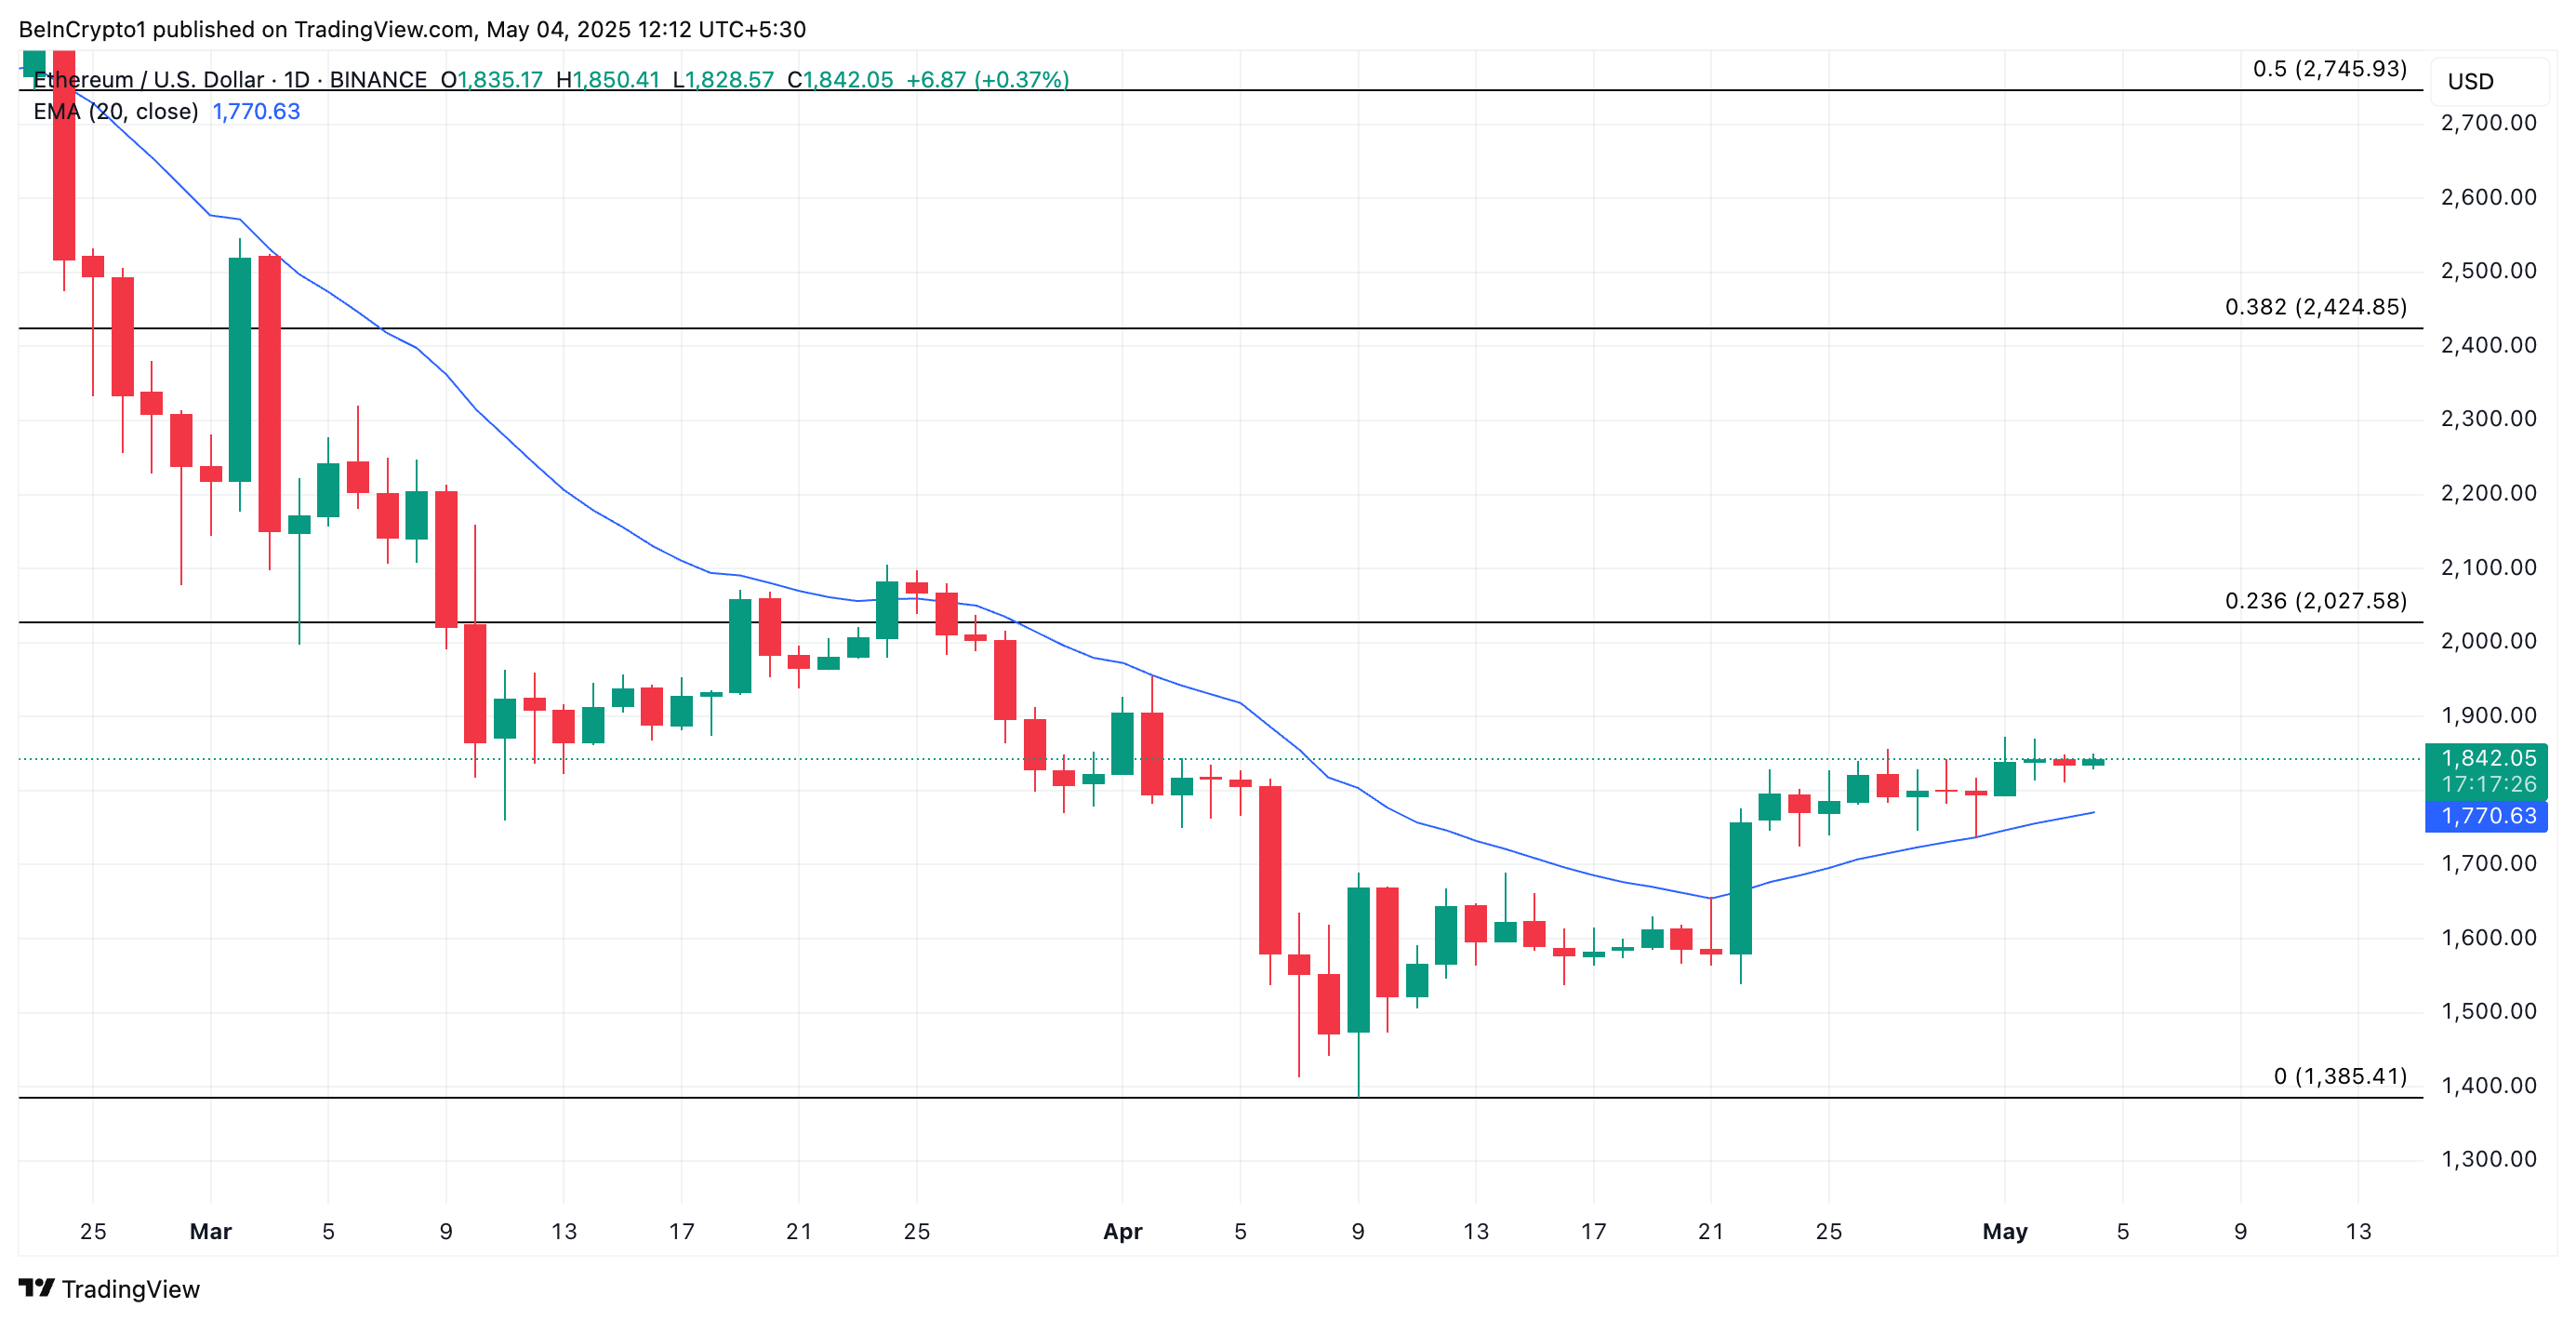
The leading altcoin ETH has bucked the broader market downturn over the past 24 hours, posting modest gains of around 1%. At press time, the coin trades at $1,842.
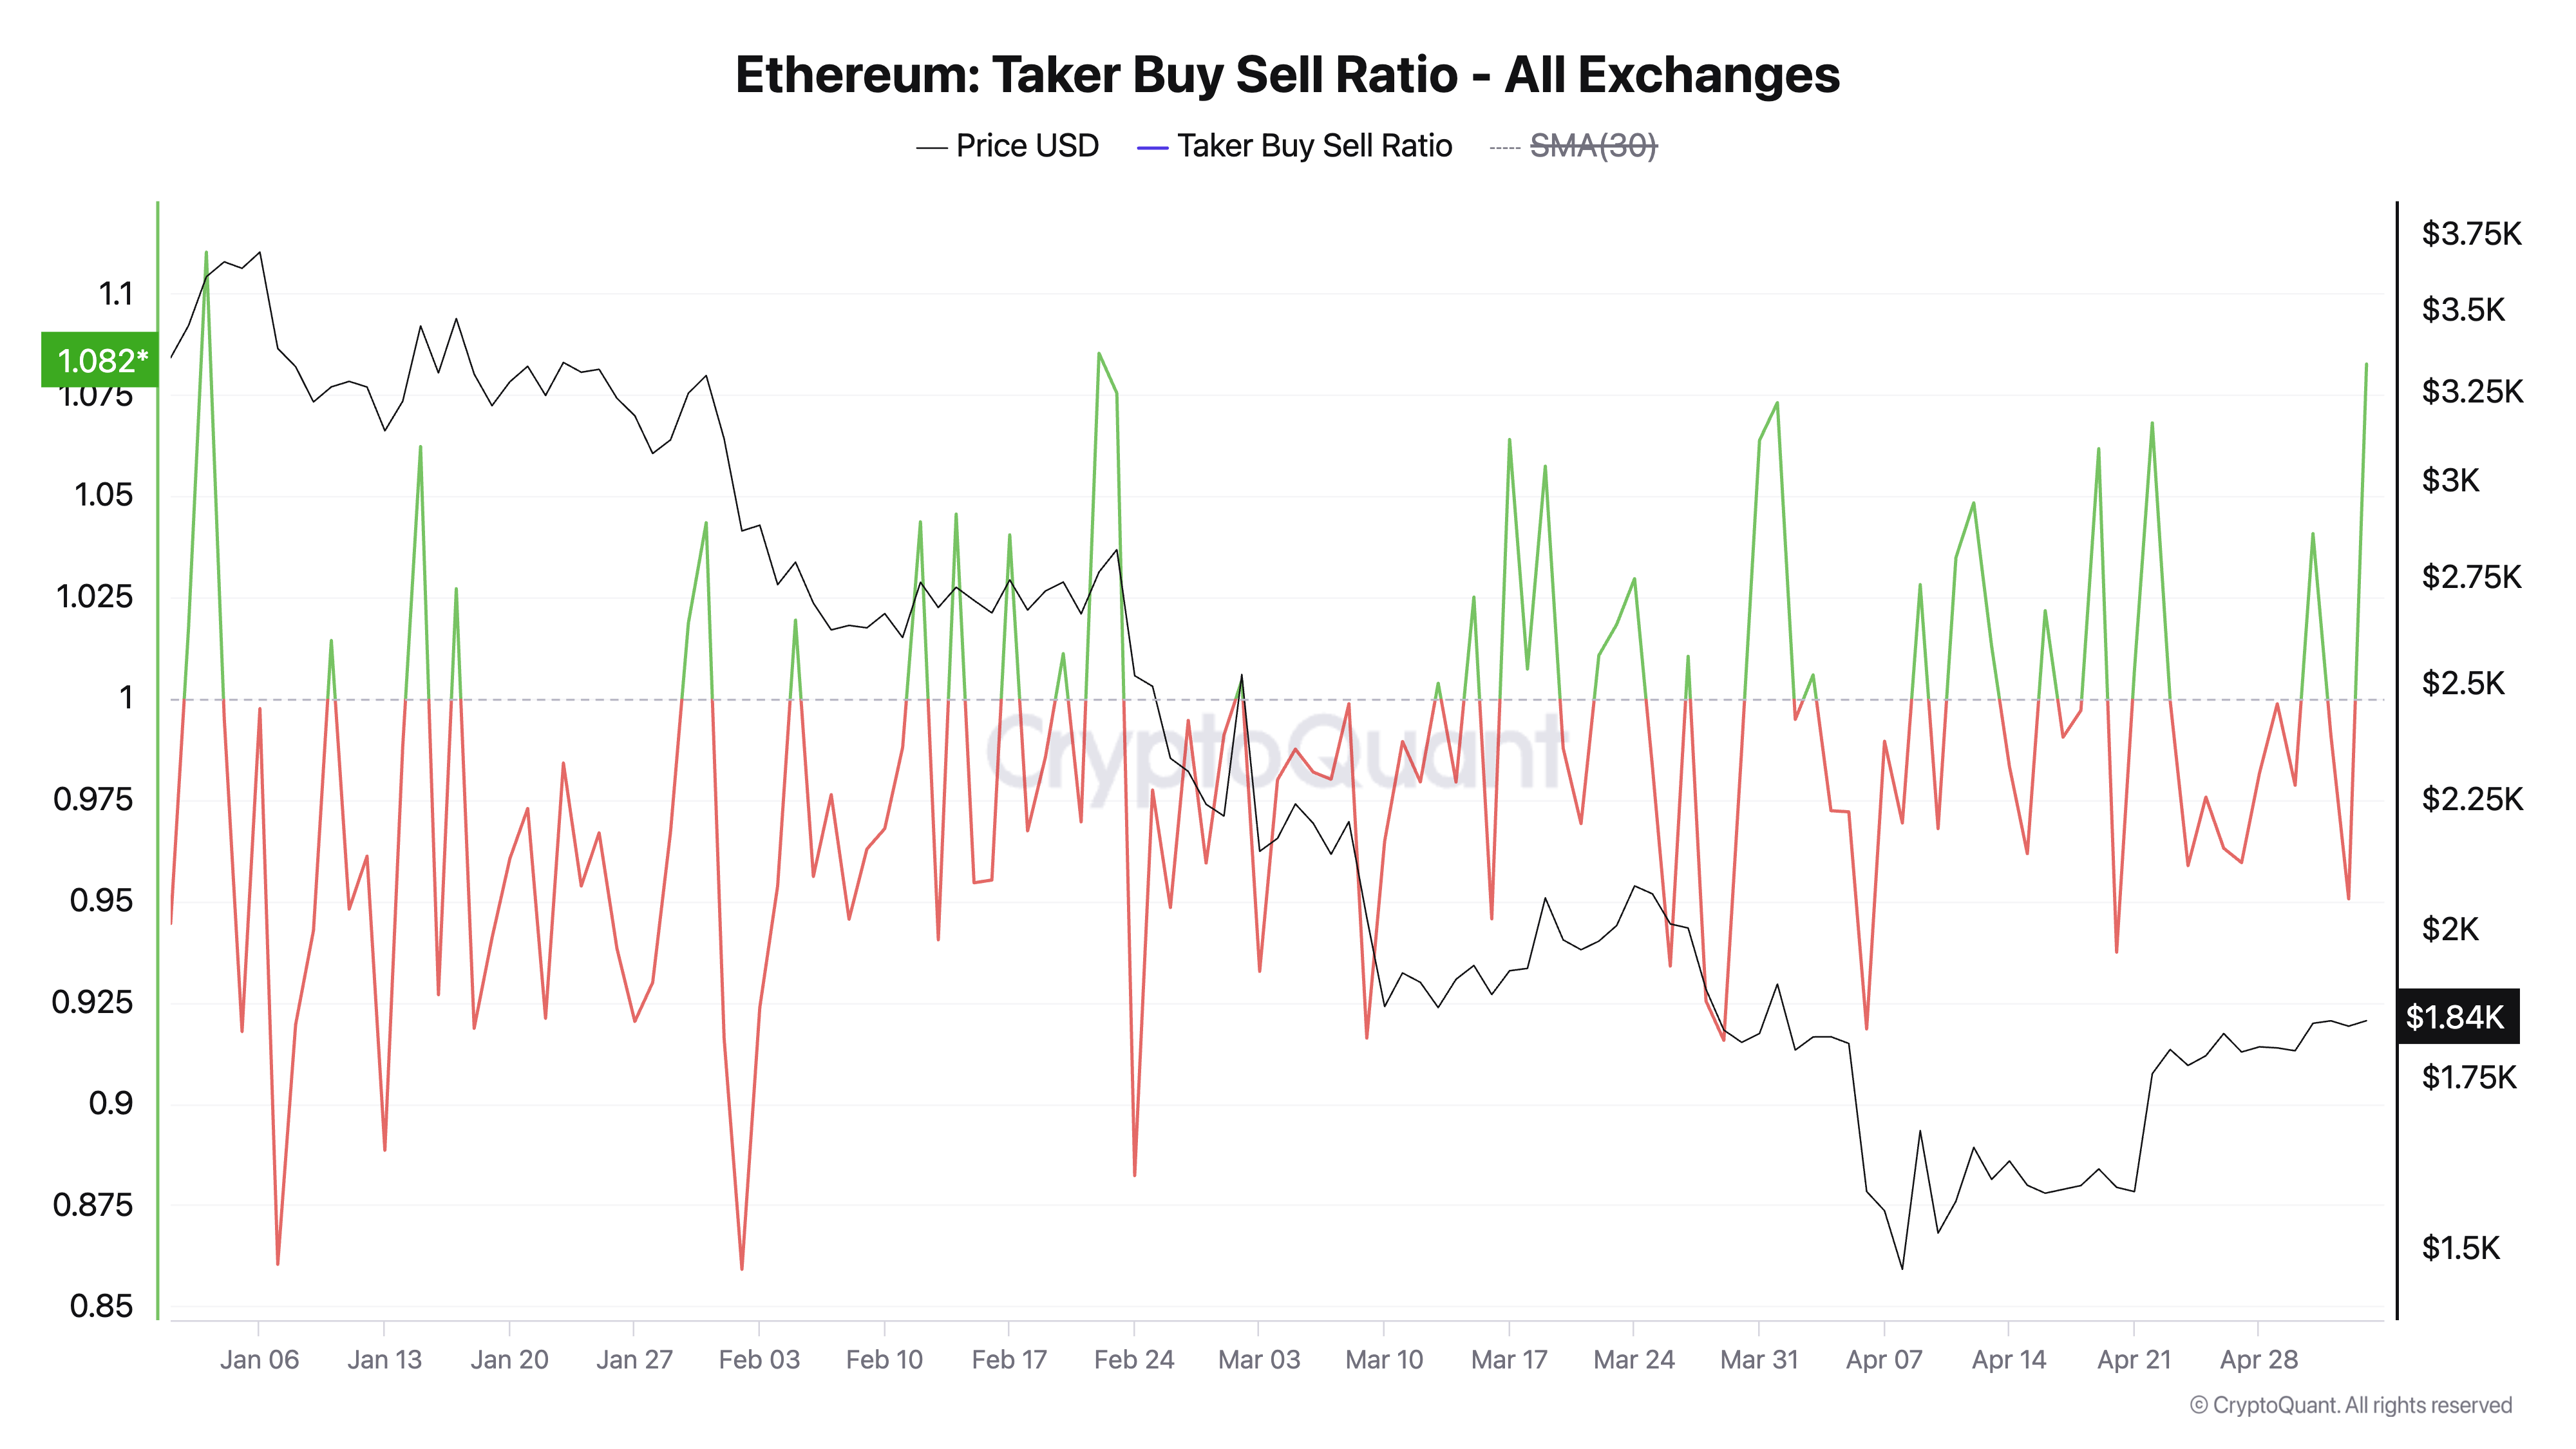
This comes as a key momentum metric — the taker buy-sell ratio—surges to its highest level in 30 days, signaling renewed bullish pressure in the asset’s futures market.
Traders Eye ETH Upside as Buy Pressure and Build
According to CryptoQuant, ETH’s taker-buy-sell ratio is currently at 1.08, marking its highest value since early April.
This metric measures the ratio between the buy and sell volumes in ETH’s futures market. A value above 1 suggests that more traders are aggressively buying ETH contracts than selling, while values below 1 indicate dominant sell pressure.
At 1.08, ETH’s taker buy-sell ratio clearly tilts in favor of buyers, reflecting increasing confidence among traders that prices may continue rising.
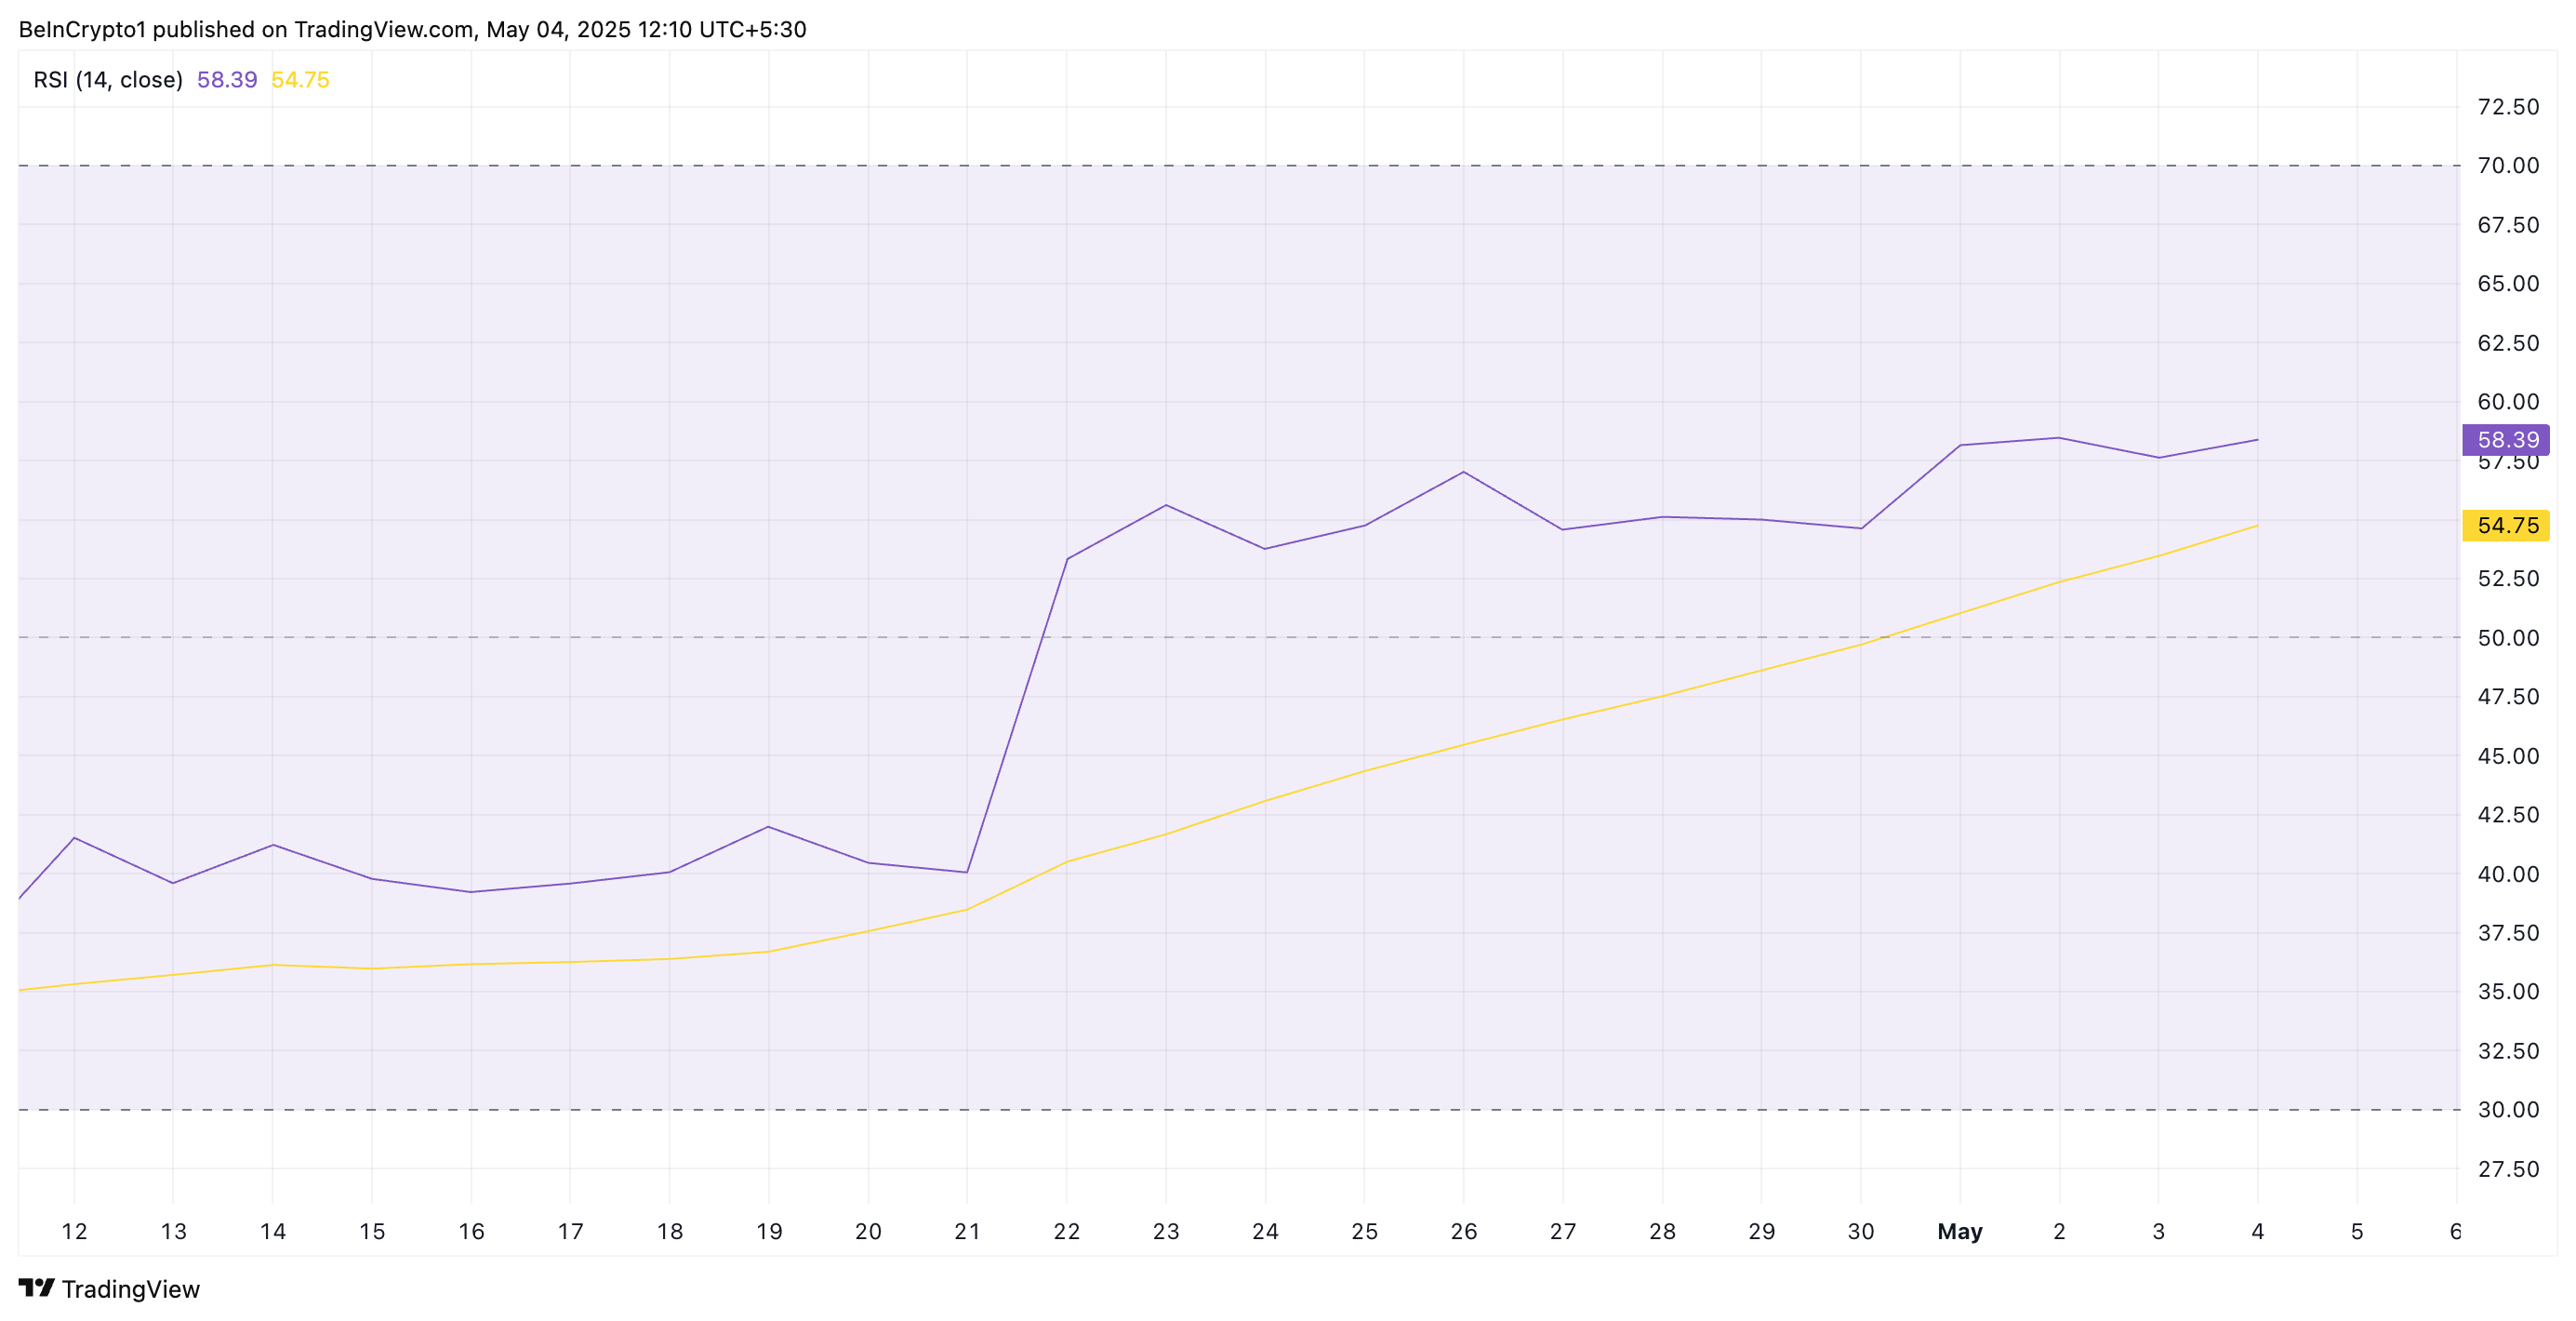
Moreover, the altcoin’s Relative Strength Index (RSI) continues to trend upward, supporting this bullish narrative. At press time, it is at 58.39 and climbing.
The RSI indicator measures an asset’s overbought and oversold market conditions. It ranges between 0 and 100, with values above 70 indicating that the asset is overbought and due for a decline. Conversely, values under 30 signal that the asset is oversold and could witness a rebound.
ETH’s RSI reading confirms the strengthening bullish bias toward the altcoin, reinforcing the view that it could be primed for further upside.
ETH Builds Strength Above Short-Term Support
At its current price, ETH rests above its 20-day exponential moving average (EMA), which forms dynamic support below its price at $1,770.
The 20-day EMA measures an asset’s average price over the past 20 trading days, giving weight to recent prices. When an asset trades above this key moving average, it signals short-term bullish momentum. This indicates that recent prices are trending higher than the average over the past 20 days. Traders often view this as a sign of underlying strength or an early uptrend.
Therefore, ETH could maintain its rally toward $2,027 if buying pressure gains momentum.