Let’s look at some popular photography trends for 2022 and how you can apply them to your unique photography style!
New Photography Trends for 2023

Dig Deeper, Invest Smarter

Let’s look at some popular photography trends for 2022 and how you can apply them to your unique photography style!

Virtuals Protocol (VIRTUAL) is down 15% in the last 24 hours after rallying an impressive 200% over the past 30 days. This pullback comes as the token tests a key resistance level around $1.53, while trend indicators show signs of weakening momentum.
At the same time, Smart Money wallets have increased their holdings by 14.4% in the last week and have held steady since May 2—suggesting confidence in the longer-term outlook. VIRTUAL stands at a technical and psychological crossroads. Traders are watching closely to see whether it can build toward a breakout above $2 or slide back to support at $1.19.
The number of VIRTUAL tokens held by Smart Money wallets on Ethereum has increased by 14.4% over the past week, rising sharply from 16.49 million to 18.57 million on May 2, and remaining steady around 18.54 million since then.
Despite its recent price pullback, this growth signals that some of the most sophisticated on-chain participants have been accumulating exposure to VIRTUAL.
The sharp rise followed by stability suggests Smart Money wallets may be holding in anticipation of further upside, especially after the token posted a 209% gain in the last 30 days, making it one of the best-performing altcoins in the market.

The recent 15% dip in the last 24 hours hasn’t yet triggered widespread selling among these wallets, which may reflect patience rather than panic.
This holding pattern could signal confidence in continuing the broader uptrend or at least a strategic pause before reallocating.
While not guaranteeing future gains, steady Smart Money holdings in the face of short-term volatility are often a positive signal for longer-term momentum.
VIRTUAL’s BBTrend has sharply declined to 6.76, down from 31.91 just two days ago, marking a significant weakening in upward momentum.
The BBTrend (Bollinger Band Trend) is a volatility-based indicator that measures the strength and direction of a trend by analyzing the expansion and contraction of Bollinger Bands.
Values above zero suggest a bullish trend, with higher readings indicating stronger momentum. Since April 24, VIRTUAL’s BBTrend has stayed in positive territory—signaling consistent bullish behavior for nearly two weeks.
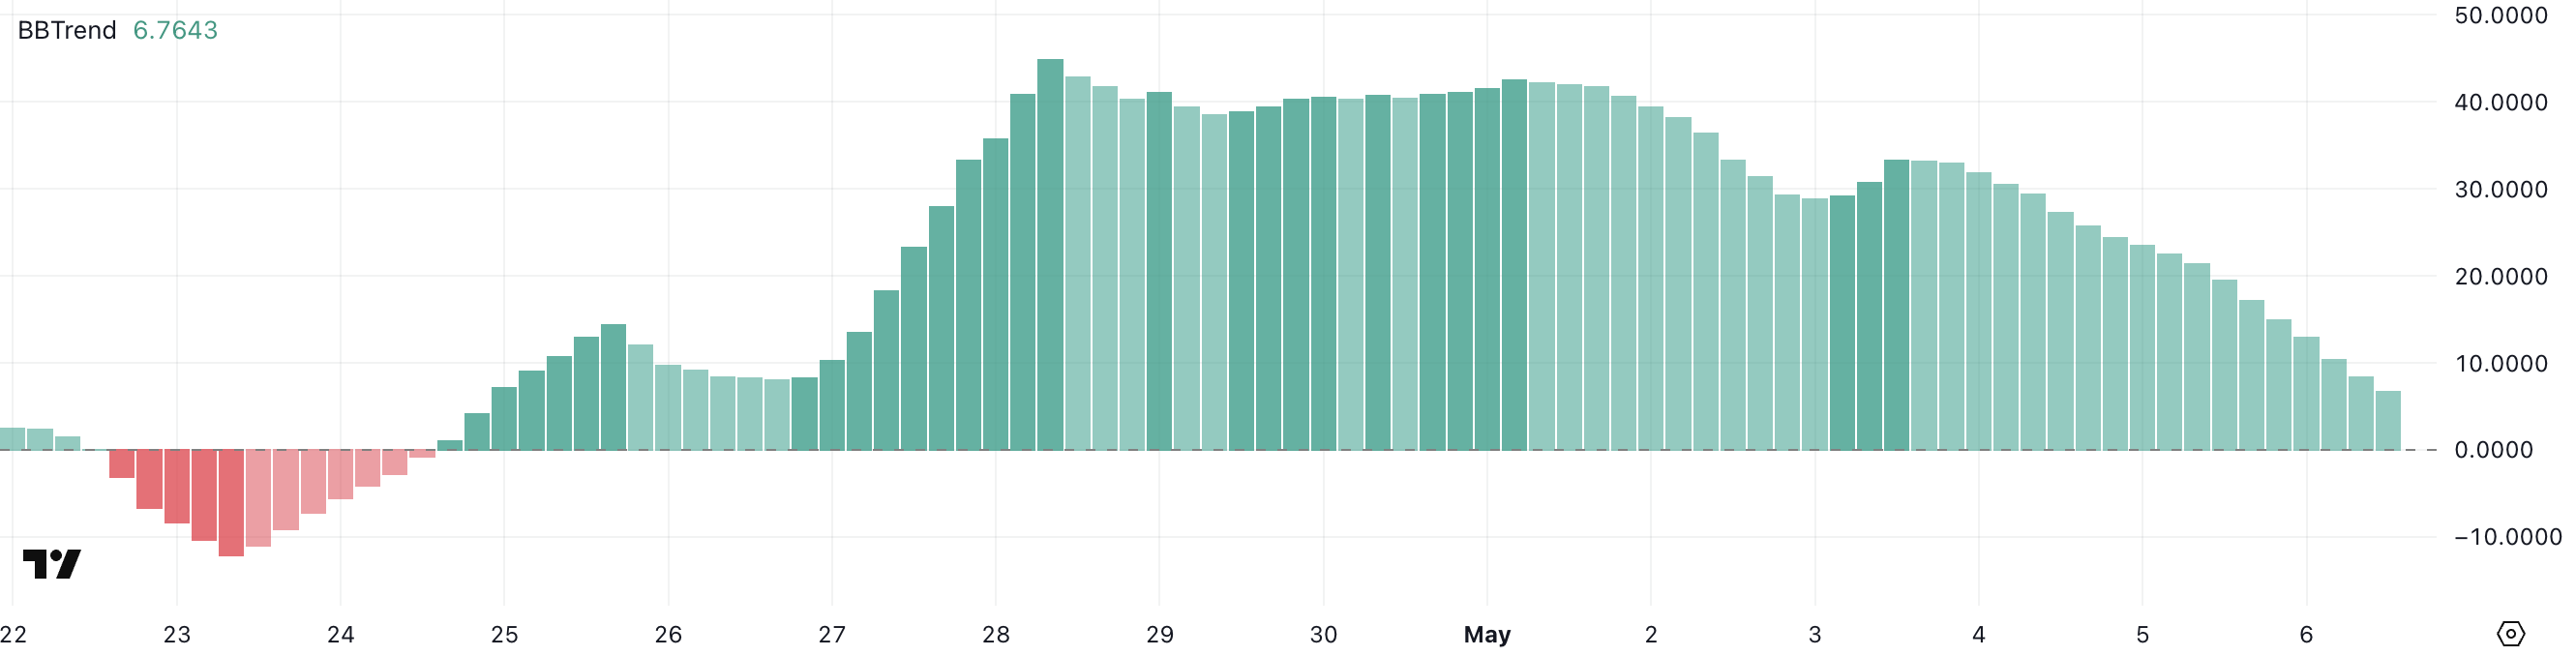
The current reading of 6.76 still reflects a positive trend, but the steep drop shows that momentum is cooling off. While this doesn’t necessarily signal an imminent reversal, it suggests that the explosive pace seen in recent days is slowing.
After a 193% surge in the past month, this deceleration may point to a period of consolidation or reduced buying interest.
Traders should watch whether the BBTrend continues to decline or stabilizes—either could shape whether VIRTUAL regains strength or dips further.
VIRTUAL is currently trading just below a key resistance level around $1.53. If buying momentum returns—particularly with renewed interest in crypto AI agents—VIRTUAL could test $1.89 in the near term.
A successful breakout there would pave the way for a possible move above the $2 mark, a level it hasn’t reached since January 30.
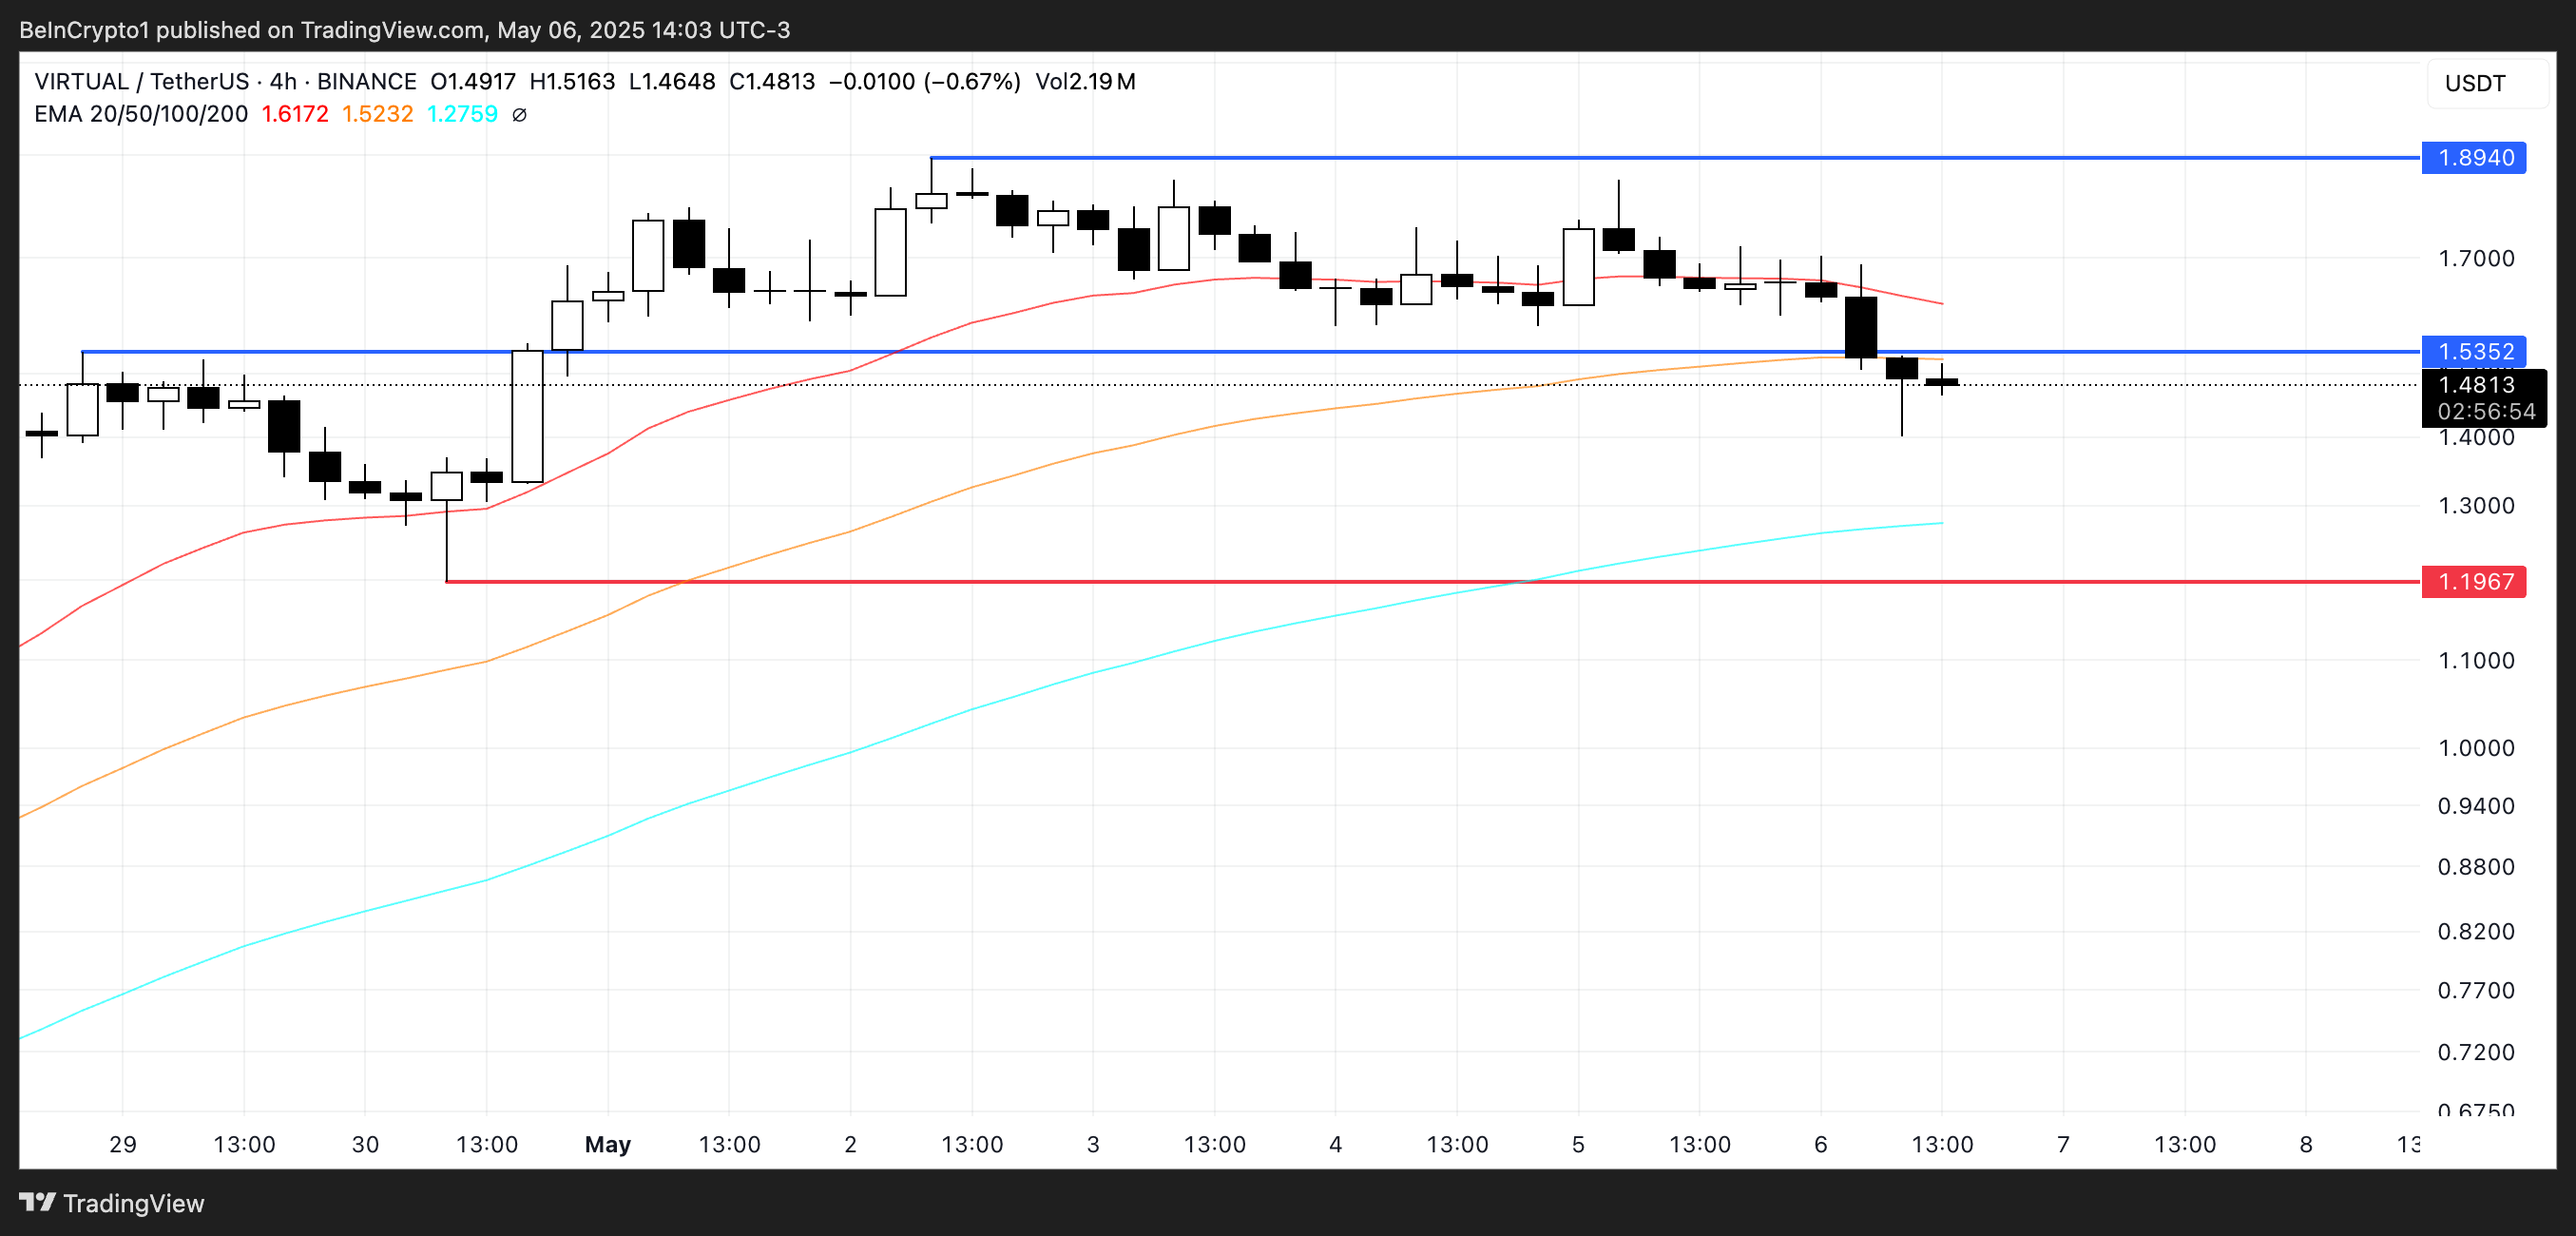
However, failure to reclaim $1.53 could lead to a pullback, especially given the recent cooling in trend strength.
In that case, the next key support level lies at $1.19.
The post Virtuals Protocol (VIRTUAL) Dips 15% But Smart Money Wallets Continue to Buy appeared first on BeInCrypto.

Ethereum (ETH) has been showing signs of renewed strength, gaining 14% over the past seven days. Despite the recent rally, Ethereum has been trading below the $1,900 mark since April 2, highlighting the importance of key resistance levels ahead.
Whether Ethereum can reclaim higher ground or faces renewed selling pressure will likely depend on its next moves around major support and resistance zones.
Ethereum’s BBTrend currently sits at 8.77, marking a noticeable decline from 11.83 two days ago.
Despite the drop, the indicator has remained positive for the past three days, suggesting that Ethereum has maintained an underlying bullish structure even as momentum cools off.
This shift could signal the early stages of a potential consolidation phase, during which the market takes a breather before deciding on its next major move.
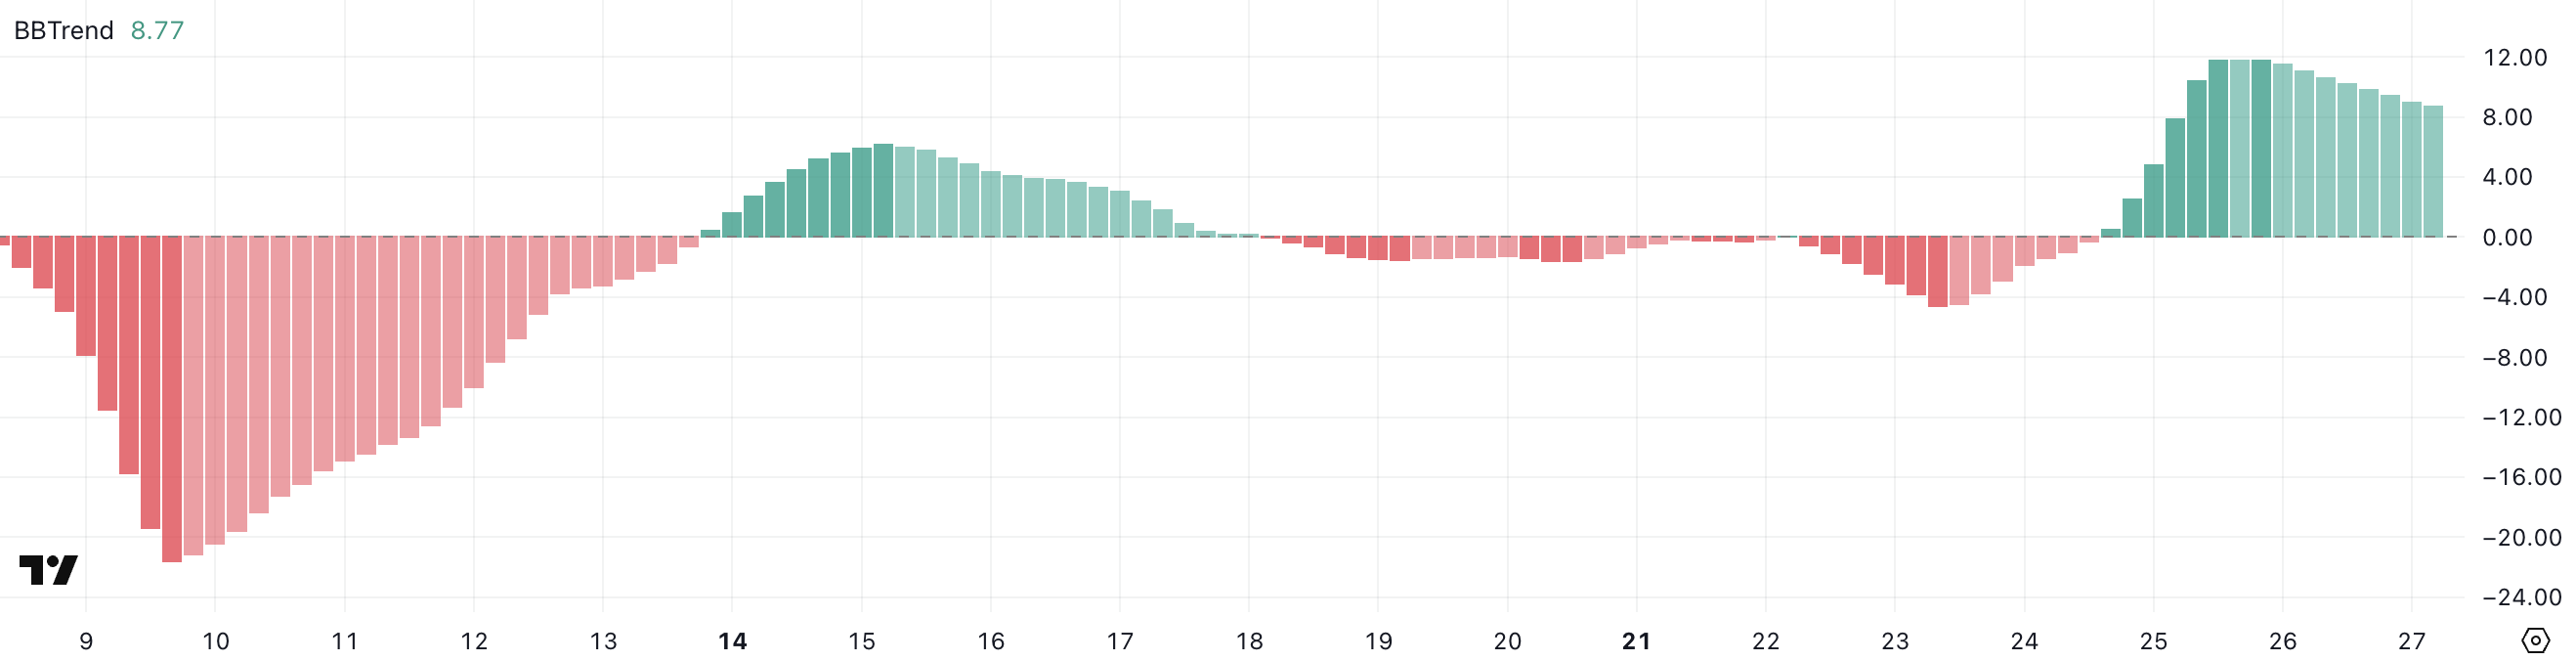
BBTrend, or Bollinger Band Trend, is a technical indicator that measures the strength of a trend by analyzing how price behaves relative to the Bollinger Bands.
When BBTrend values are high and positive, they generally signal a strong uptrend; when they are negative, they point to a downtrend. Ethereum’s BBTrend, now at 8.77, indicates that while the uptrend is still present, its strength is fading.
Buyers failing to reassert control could lead to increased volatility, potential pullbacks, or sideways movement.
The number of Ethereum whales — wallets holding between 1,000 and 10,000 ETH — currently stands at 5,458.
This figure rose slightly from 5,442 on April 21 to 5,457 on April 23, and has remained stable around this level for the past four days.
The recent stabilization suggests a pause in accumulation or distribution activity among large holders, offering a potential signal that the market could be waiting for a catalyst before making its next significant move.

Tracking Ethereum whales is critical because these large holders can have an outsized impact on price movements. When whale numbers rise, it often signals confidence and potential accumulation, which can be bullish for price.
Conversely, a declining whale count might suggest selling pressure ahead.
With the number of Ethereum whales holding steady around 5,458, it could imply a neutral stance among major players — neither aggressively buying nor selling — potentially leading to reduced volatility and range-bound price action until a clearer trend emerges.
Ethereum’s EMA (Exponential Moving Average) lines are currently aligned in a bullish formation, with the short-term EMAs positioned above the long-term ones — a classic sign of upward momentum.
Over the past few days, ETH attempted to break through the resistance zone around $1,828 but was unsuccessful. If Ethereum tests this level again and successfully breaks above it, the next upside targets would be the $1,954 resistance, followed by a potential move to $2,104.
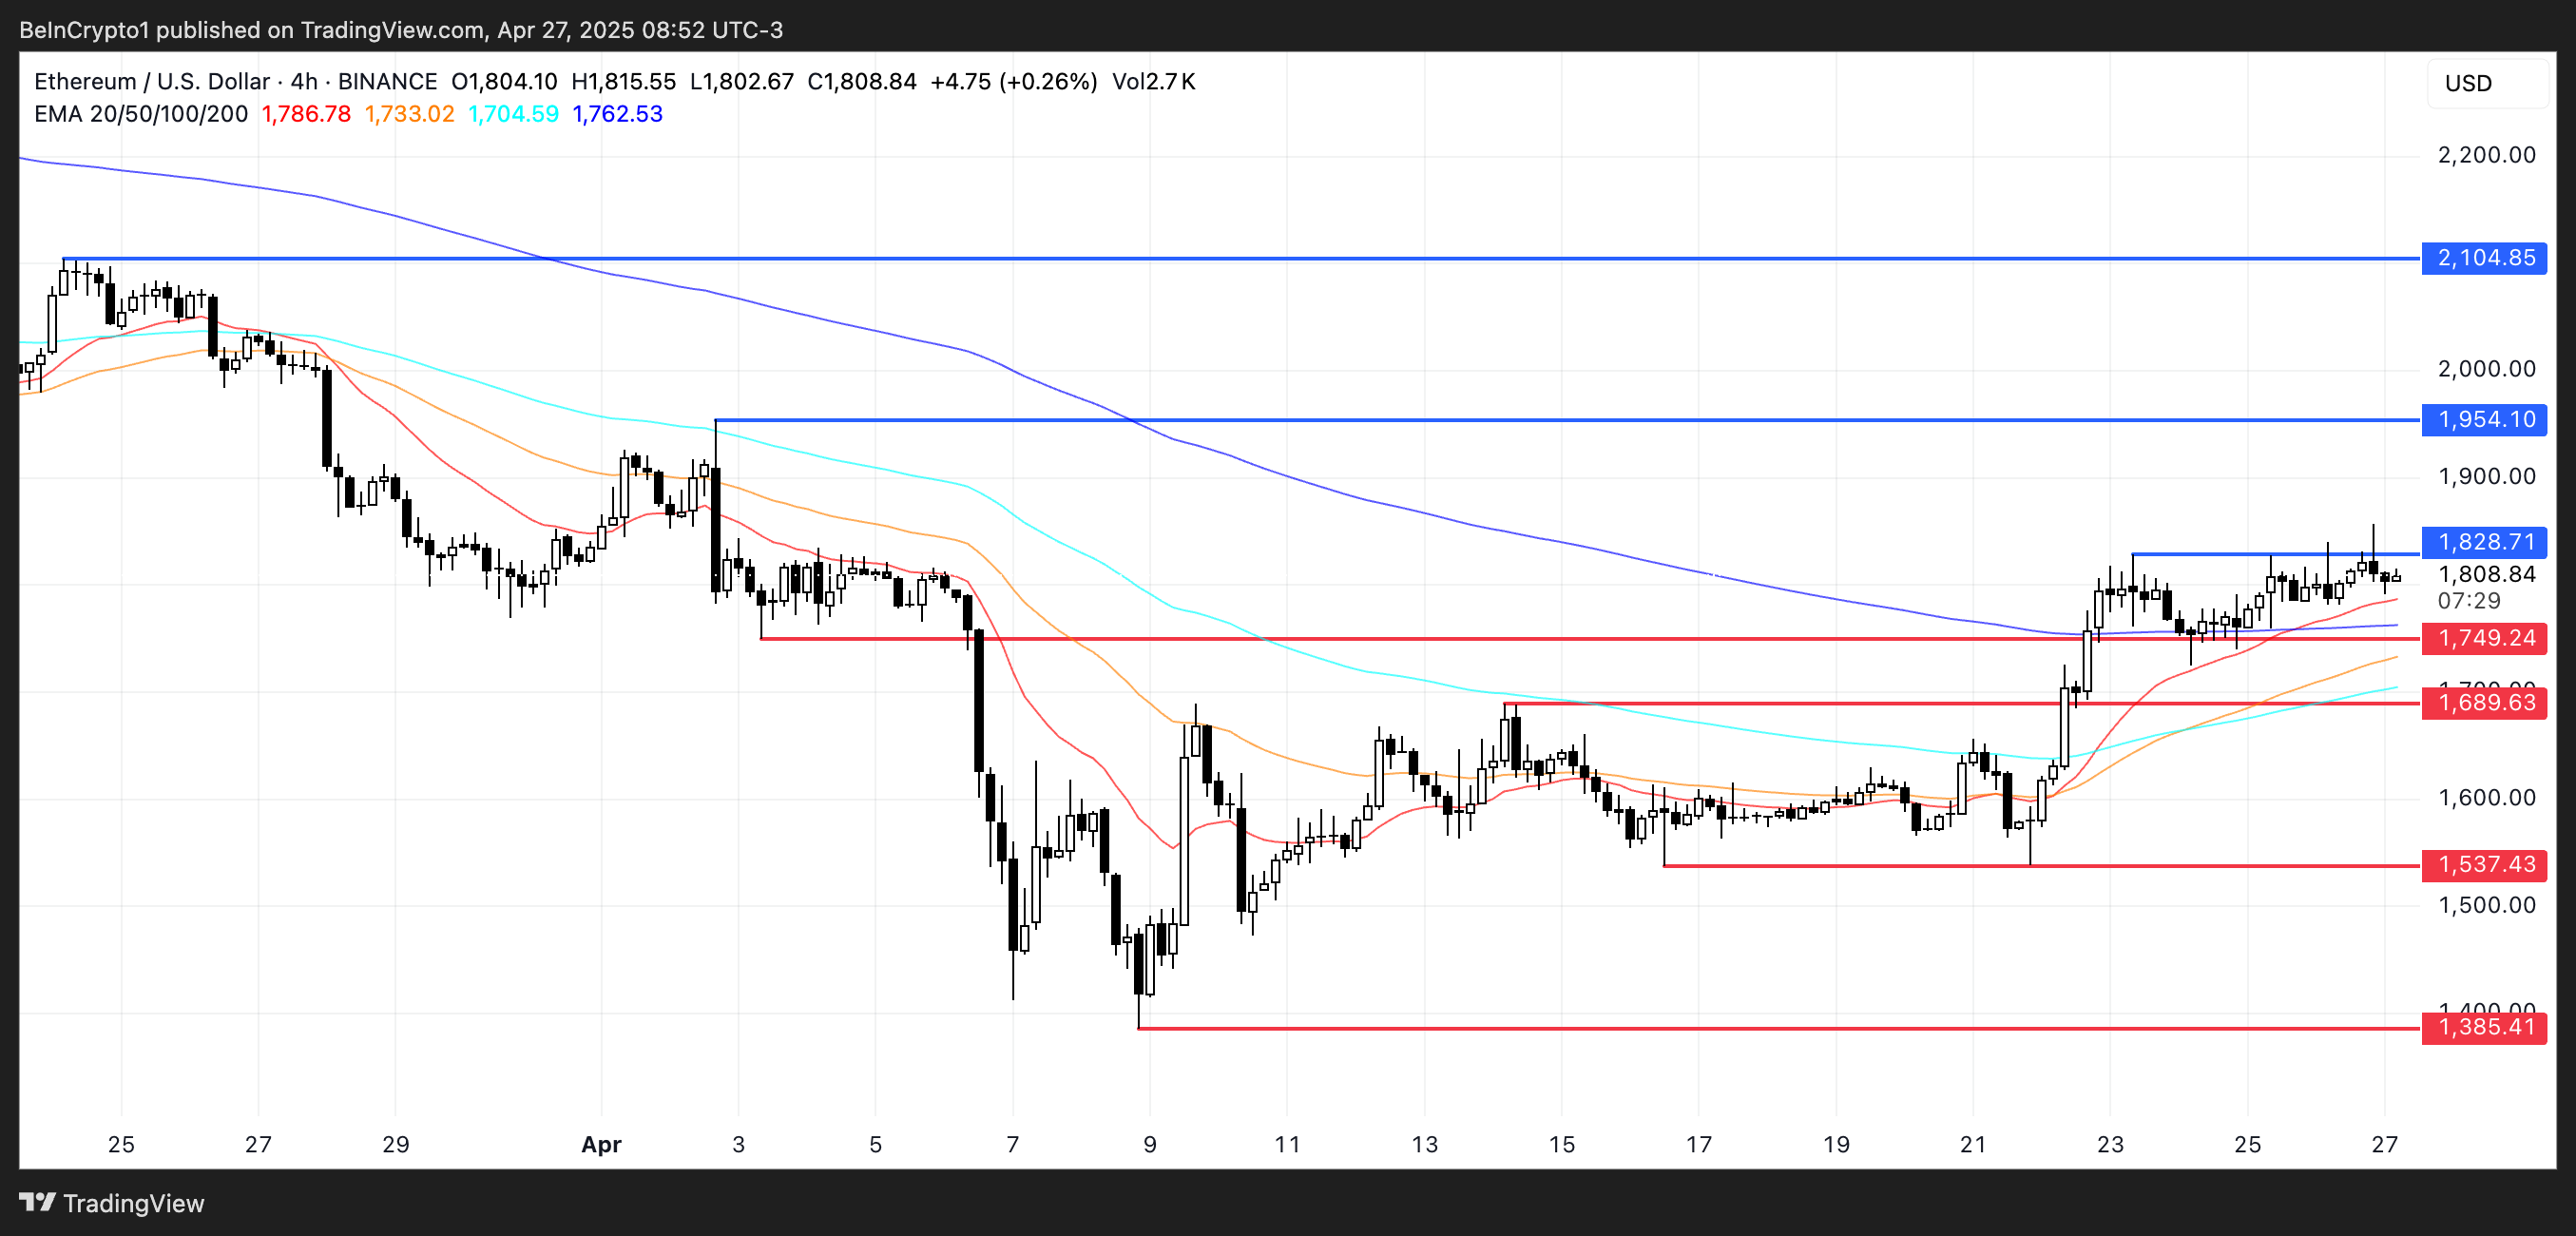
A break above $2,000 would be significant, marking the first time ETH trades above this psychological level since March 27.
However, Ethereum price could fall back to test the support at $1,749 if the bullish momentum fades and the trend reverses. Losing this level could expose ETH to further declines toward $1,689.
Should selling pressure intensify, deeper support levels at $1,537 and even $1,385 could come into play.
The post Ethereum (ETH) Whale Stability Signals Calm Before Potential Major Move appeared first on BeInCrypto.

Rome is a city with layers. Literally. Stretching back thousands of years, the ancient Italian capital has been built and…