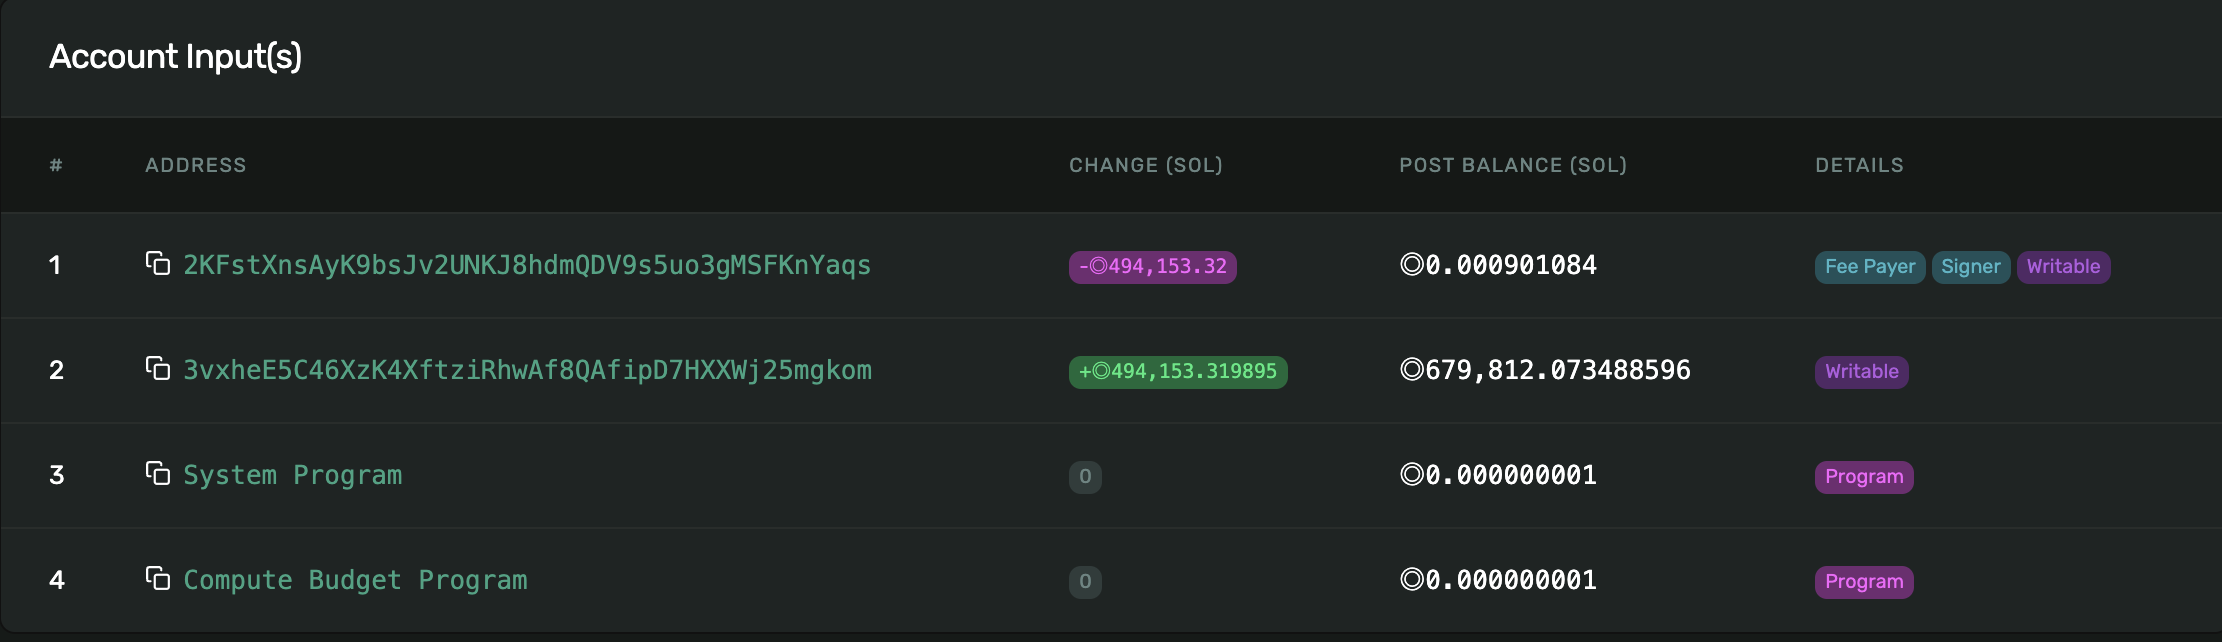
On Tuesday, a large Solana whale transferred 494,153 SOL—valued at approximately $72 million—to the Coinbase exchange, raising concerns over a potential sell-off.
Large exchange inflows like this often signal impending selling pressure, putting SOL’s recent gains at risk.
$72 Million in SOL Hits Coinbase, Weighing on Market Sentiment
According to Whale Alert, a SOL whale transferred 494,153 SOL valued at $72 million to Coinbase Institutional on Tuesday. Significant exchange inflows such as this mean that large investors are moving their holdings from private wallets to exchanges, often signaling an intent to sell.
This increased supply on exchanges can increase the downward pressure on the SOL price, especially if there is insufficient demand to absorb the selling. As a result, its price may decline in the near term, leading to further sell-offs.
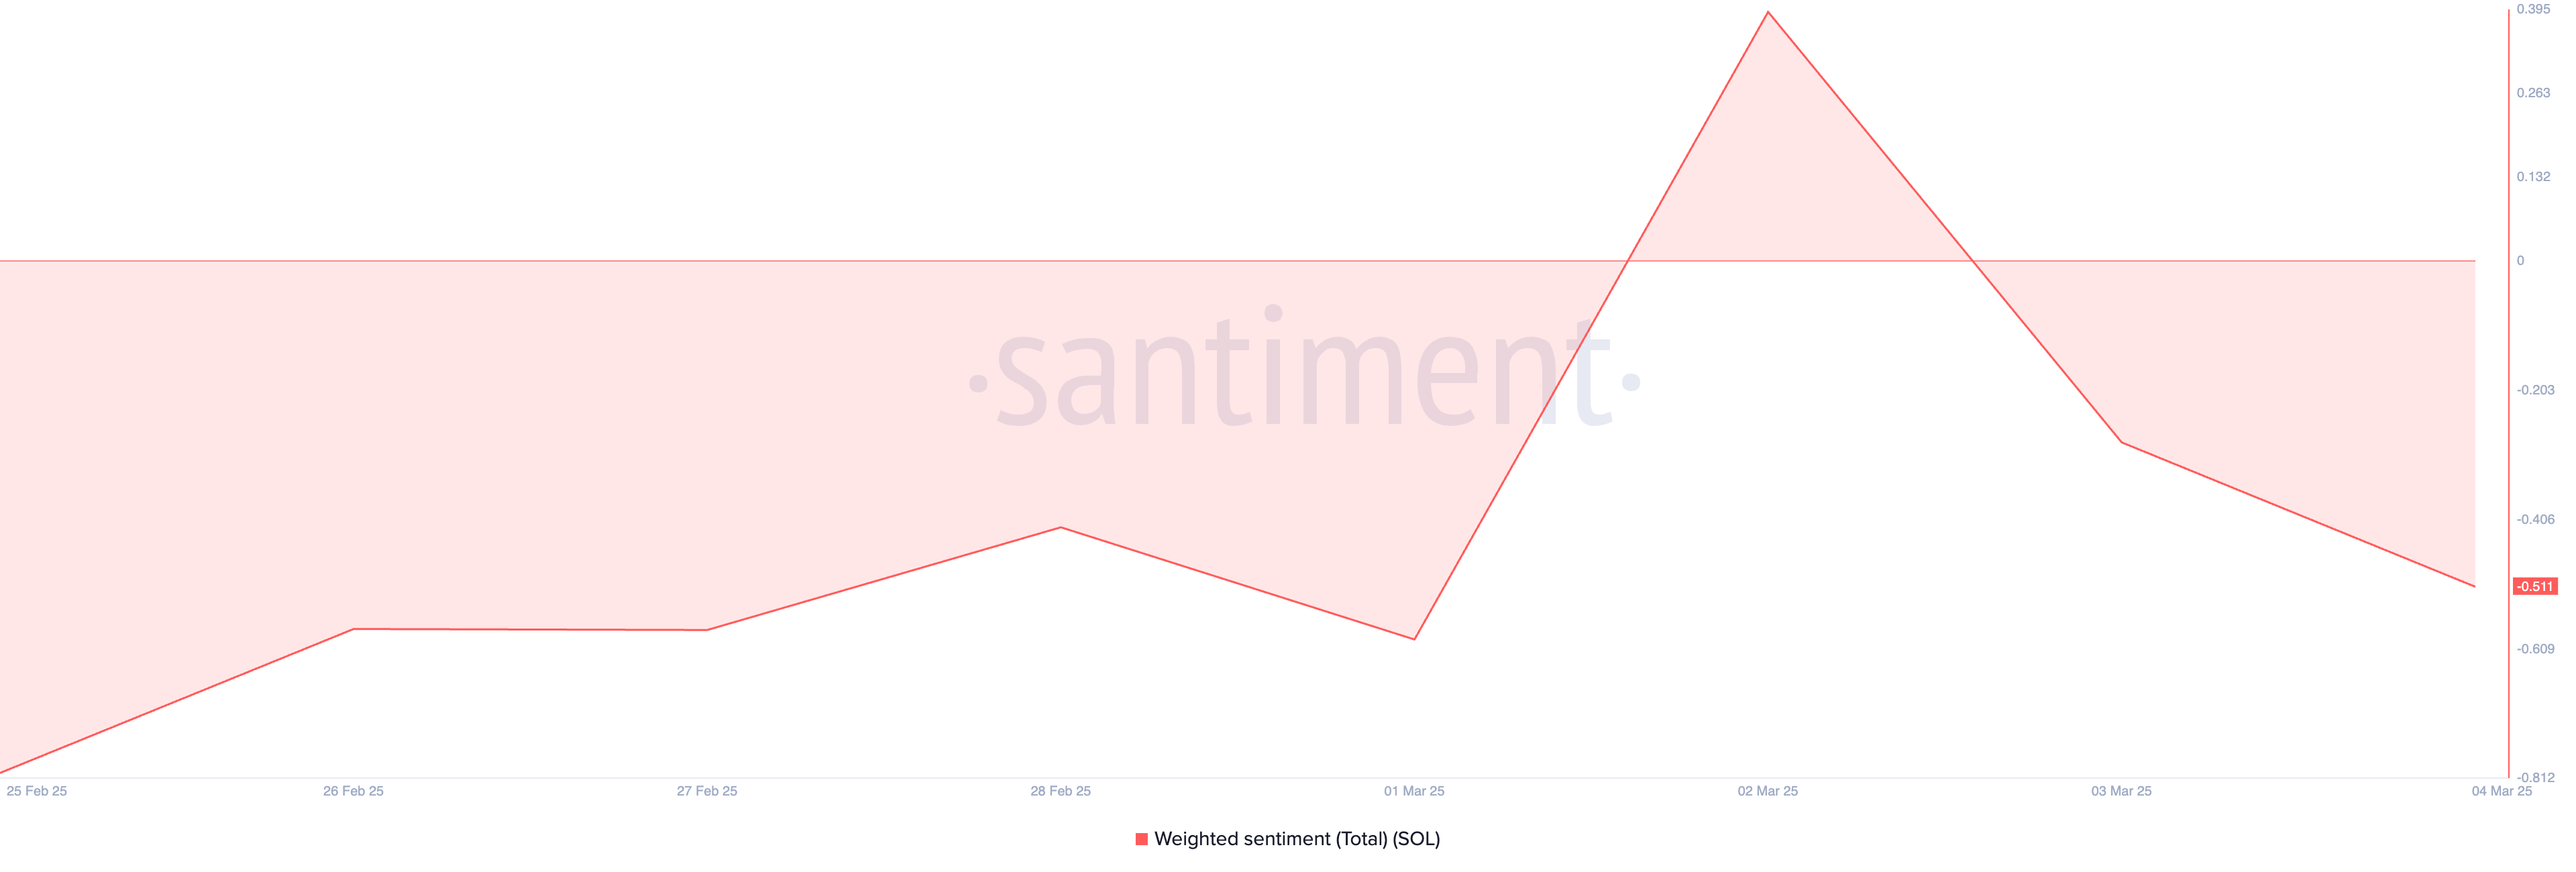
Moreover, the coin’s negative weighted sentiment heightens the risk of this selloff. At press time, this key metric is below zero at -0.51.
An asset’s weighted sentiment analyzes social media and online platforms to measure the overall tone (positive or negative) surrounding it. It considers the volume of mentions and the ratio of positive to negative comments. When weighted sentiment is positive, it indicates more positive comments and discussions about the cryptocurrency than negative ones.
On the other hand, when it is negative, the overall market sentiment is bearish, with more negative commentary and pessimism outweighing positive discussions about the asset.
This trend can increase selling pressure in the SOL market, discourage new demand, and contribute to its price decline as traders react to the prevailing bearish outlook.
Will Solana Drop to $138 or Surge to $160?
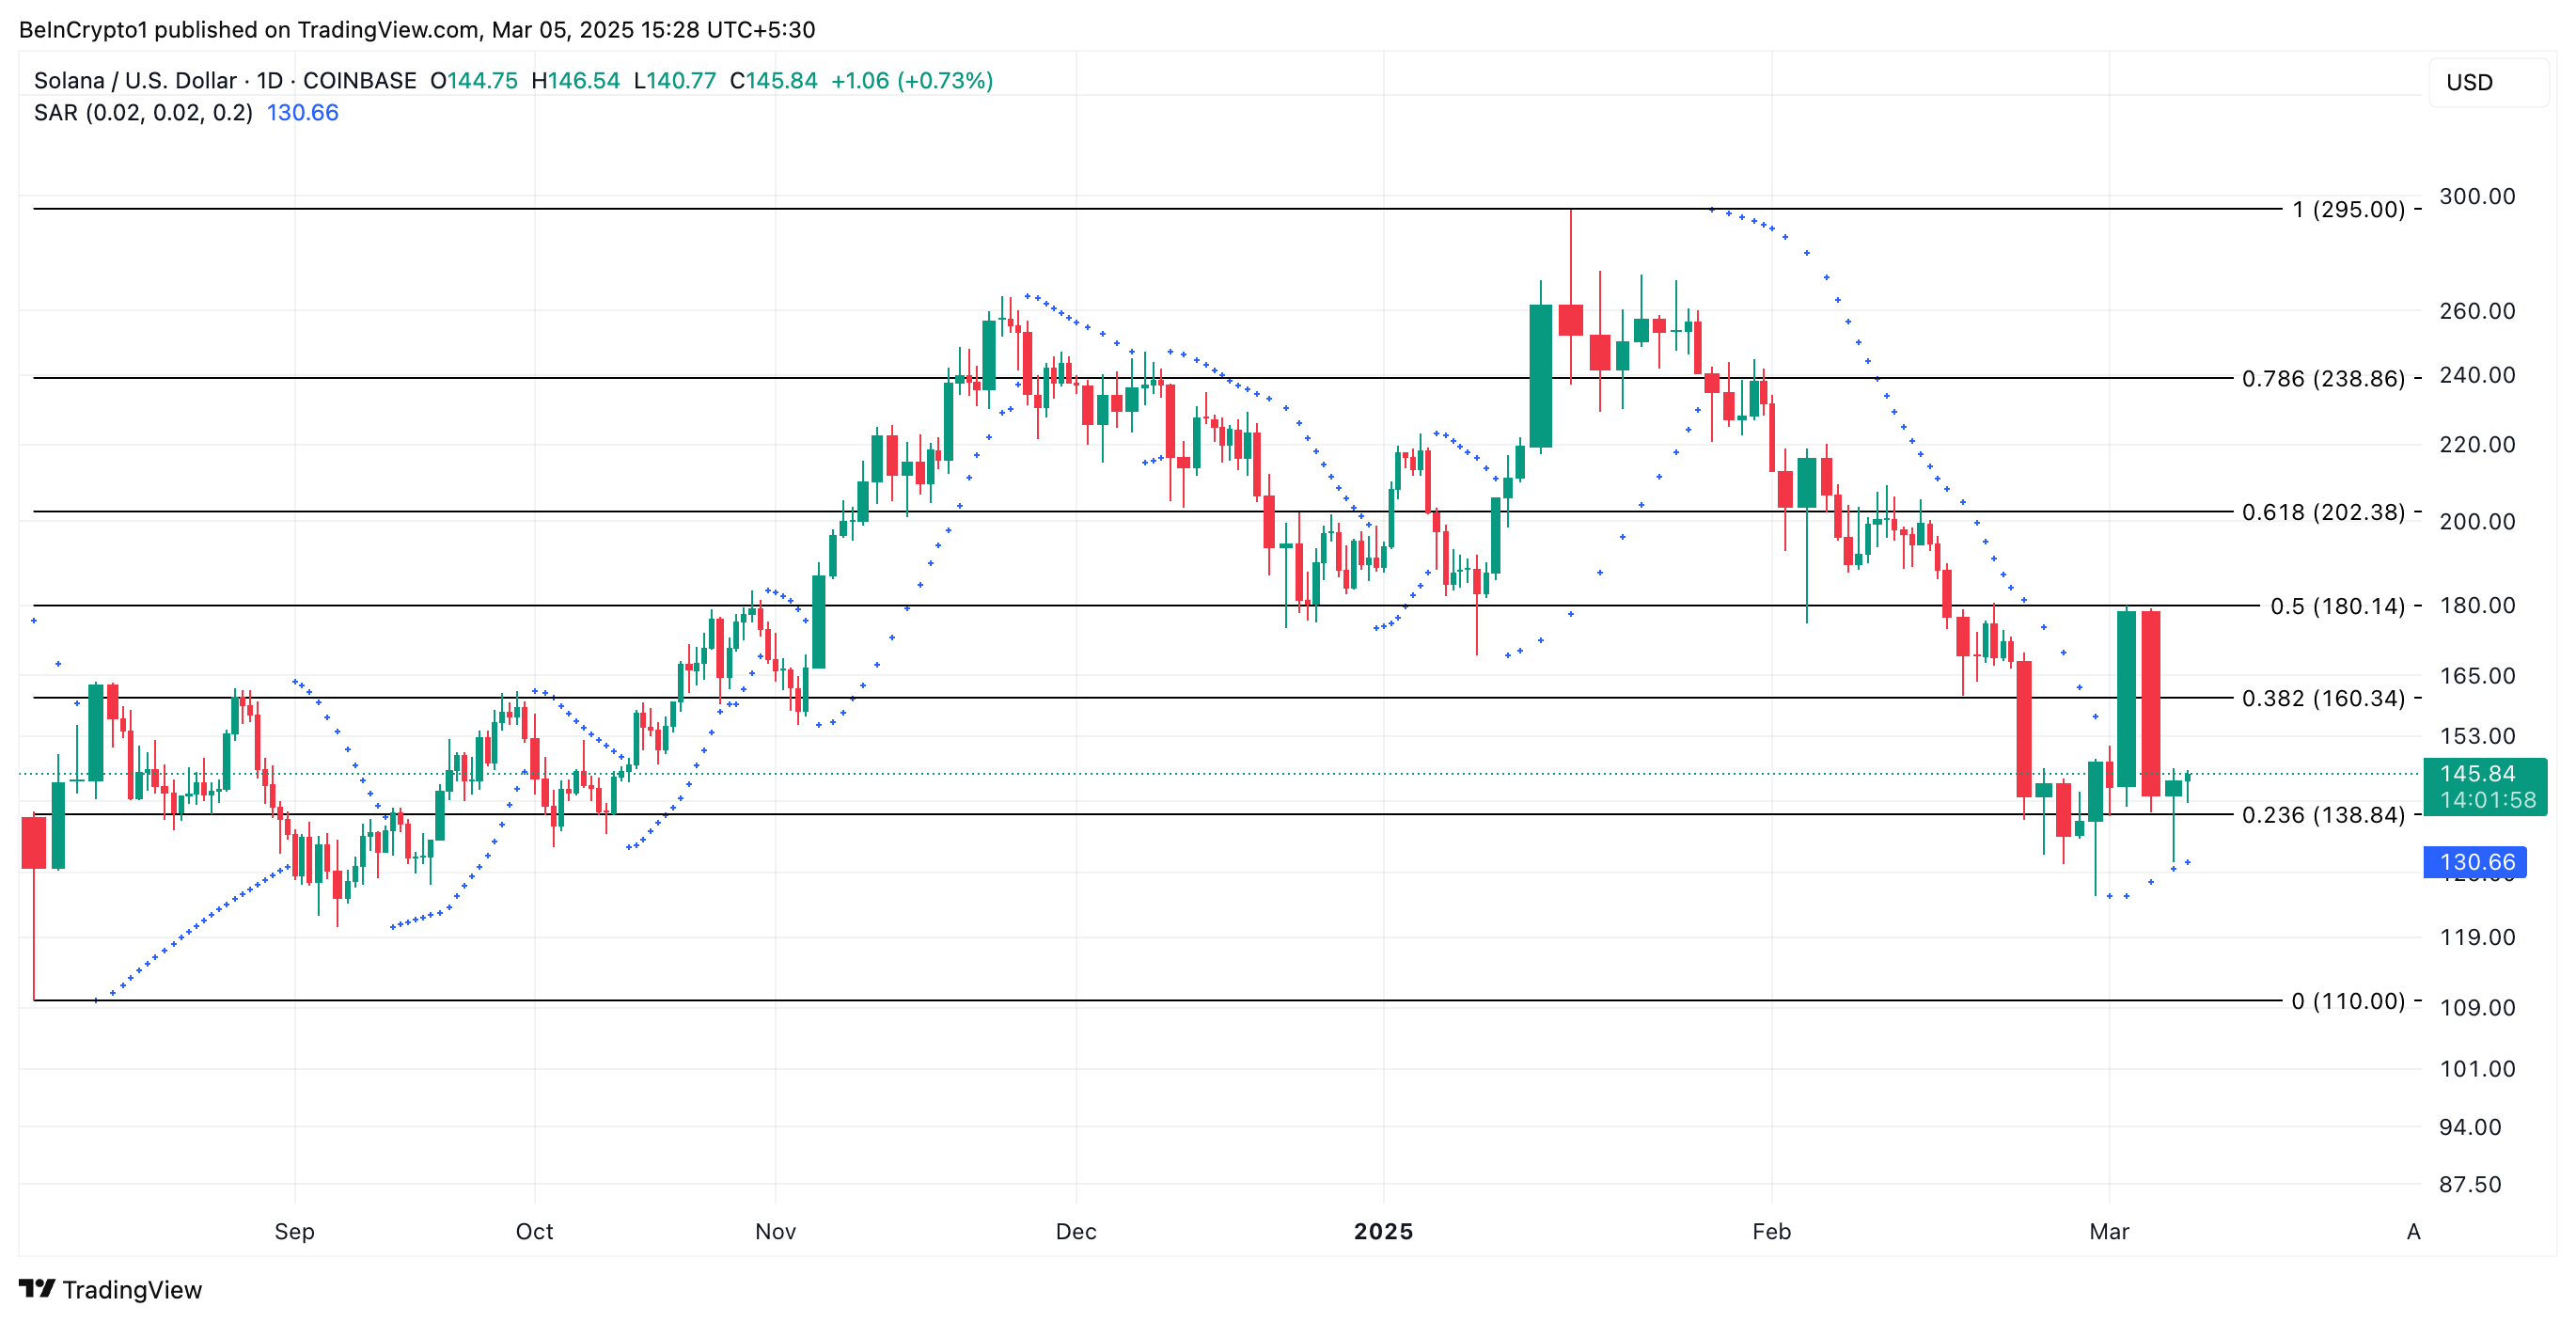
At press time, SOL trades at $145.84. If the whale selloff prompts retail traders to distribute their coins, SOL’s price may plummet to $138.84.
However, on the daily chart, SOL bulls appear ready to defend key levels. Readings from technical indicators, including the Parabolic SAR, suggest that buying momentum is gaining strength.
At press time, the dots that make up this momentum indicator rest below SOL’s price, offering dynamic support. When an asset’s Parabolic SAR is set up this way, it signals a bullish trend. It hints at the possibility of a rally in SOL’s price in the short term. If this happens, the coin could exchange hands at $160.34.
Since the Pi Network mainnet launched on February 20, it has made headlines for its ambitious goals. Yet, it has also faced substantial criticism. The underwhelming price performance and lack of DApps, among other issues, have raised questions about Pi Network’s ability to meet the expectations of its reported 60 million users, referred to as Pioneers.
Below are five key areas of underperformance that emerged as focal points for observers in early 2025.
1. Pi Network’s Lack of Binance Listing
Pi Network’s community has been vocal in its push for a listing on major exchanges like Binance. In fact, 86% of participants voted to list Pi Coin (PI) in a February community vote.
Despite this show of support, Binance has not listed PI. On May 15, the exchange posted its logo on X (formerly Twitter) featuring several mathematical symbols, including π. The post sparked speculation among Pioneers, but no official listing announcement followed.
The absence of a listing has led to renewed scrutiny over Pi Network’s credibility. Notably, Binance applies a rigorous evaluation process before listing any asset.
The exchange considers user adoption, business model viability, relevance, tokenomics, technical security, team background, and compliance with regulatory standards. The decision not to list Pi Coin may indicate that the project has yet to meet one or more of these critical benchmarks.
“I now better understand why Pi is not listed on major exchanges such as Binance and Coinbase. It is likely that the Pi Core Team has not been transparent enough about the locking and burning mechanism involving the billions of Pi coins currently owned by the PCT,” Pioneer Dr. Altcoin posted on March 22.
Coinbase, another top exchange, has also refrained from listing Pi. This has further fueled disappointment among Pioneers about the token’s potential for mainstream adoption. Nonetheless, Pi Coin remains available for trading on HTX, Bitget, MEXC, and OKX.
2. Pi Coin Price Fails to Meet Expectations
Pioneers have been actively mining Pi Coin for around six years, anticipating major gains. Yet, its price was a major letdown for many. At launch, Pi Coin was listed on OKX with a floor price of just $2. This was way below its IOU trading value.
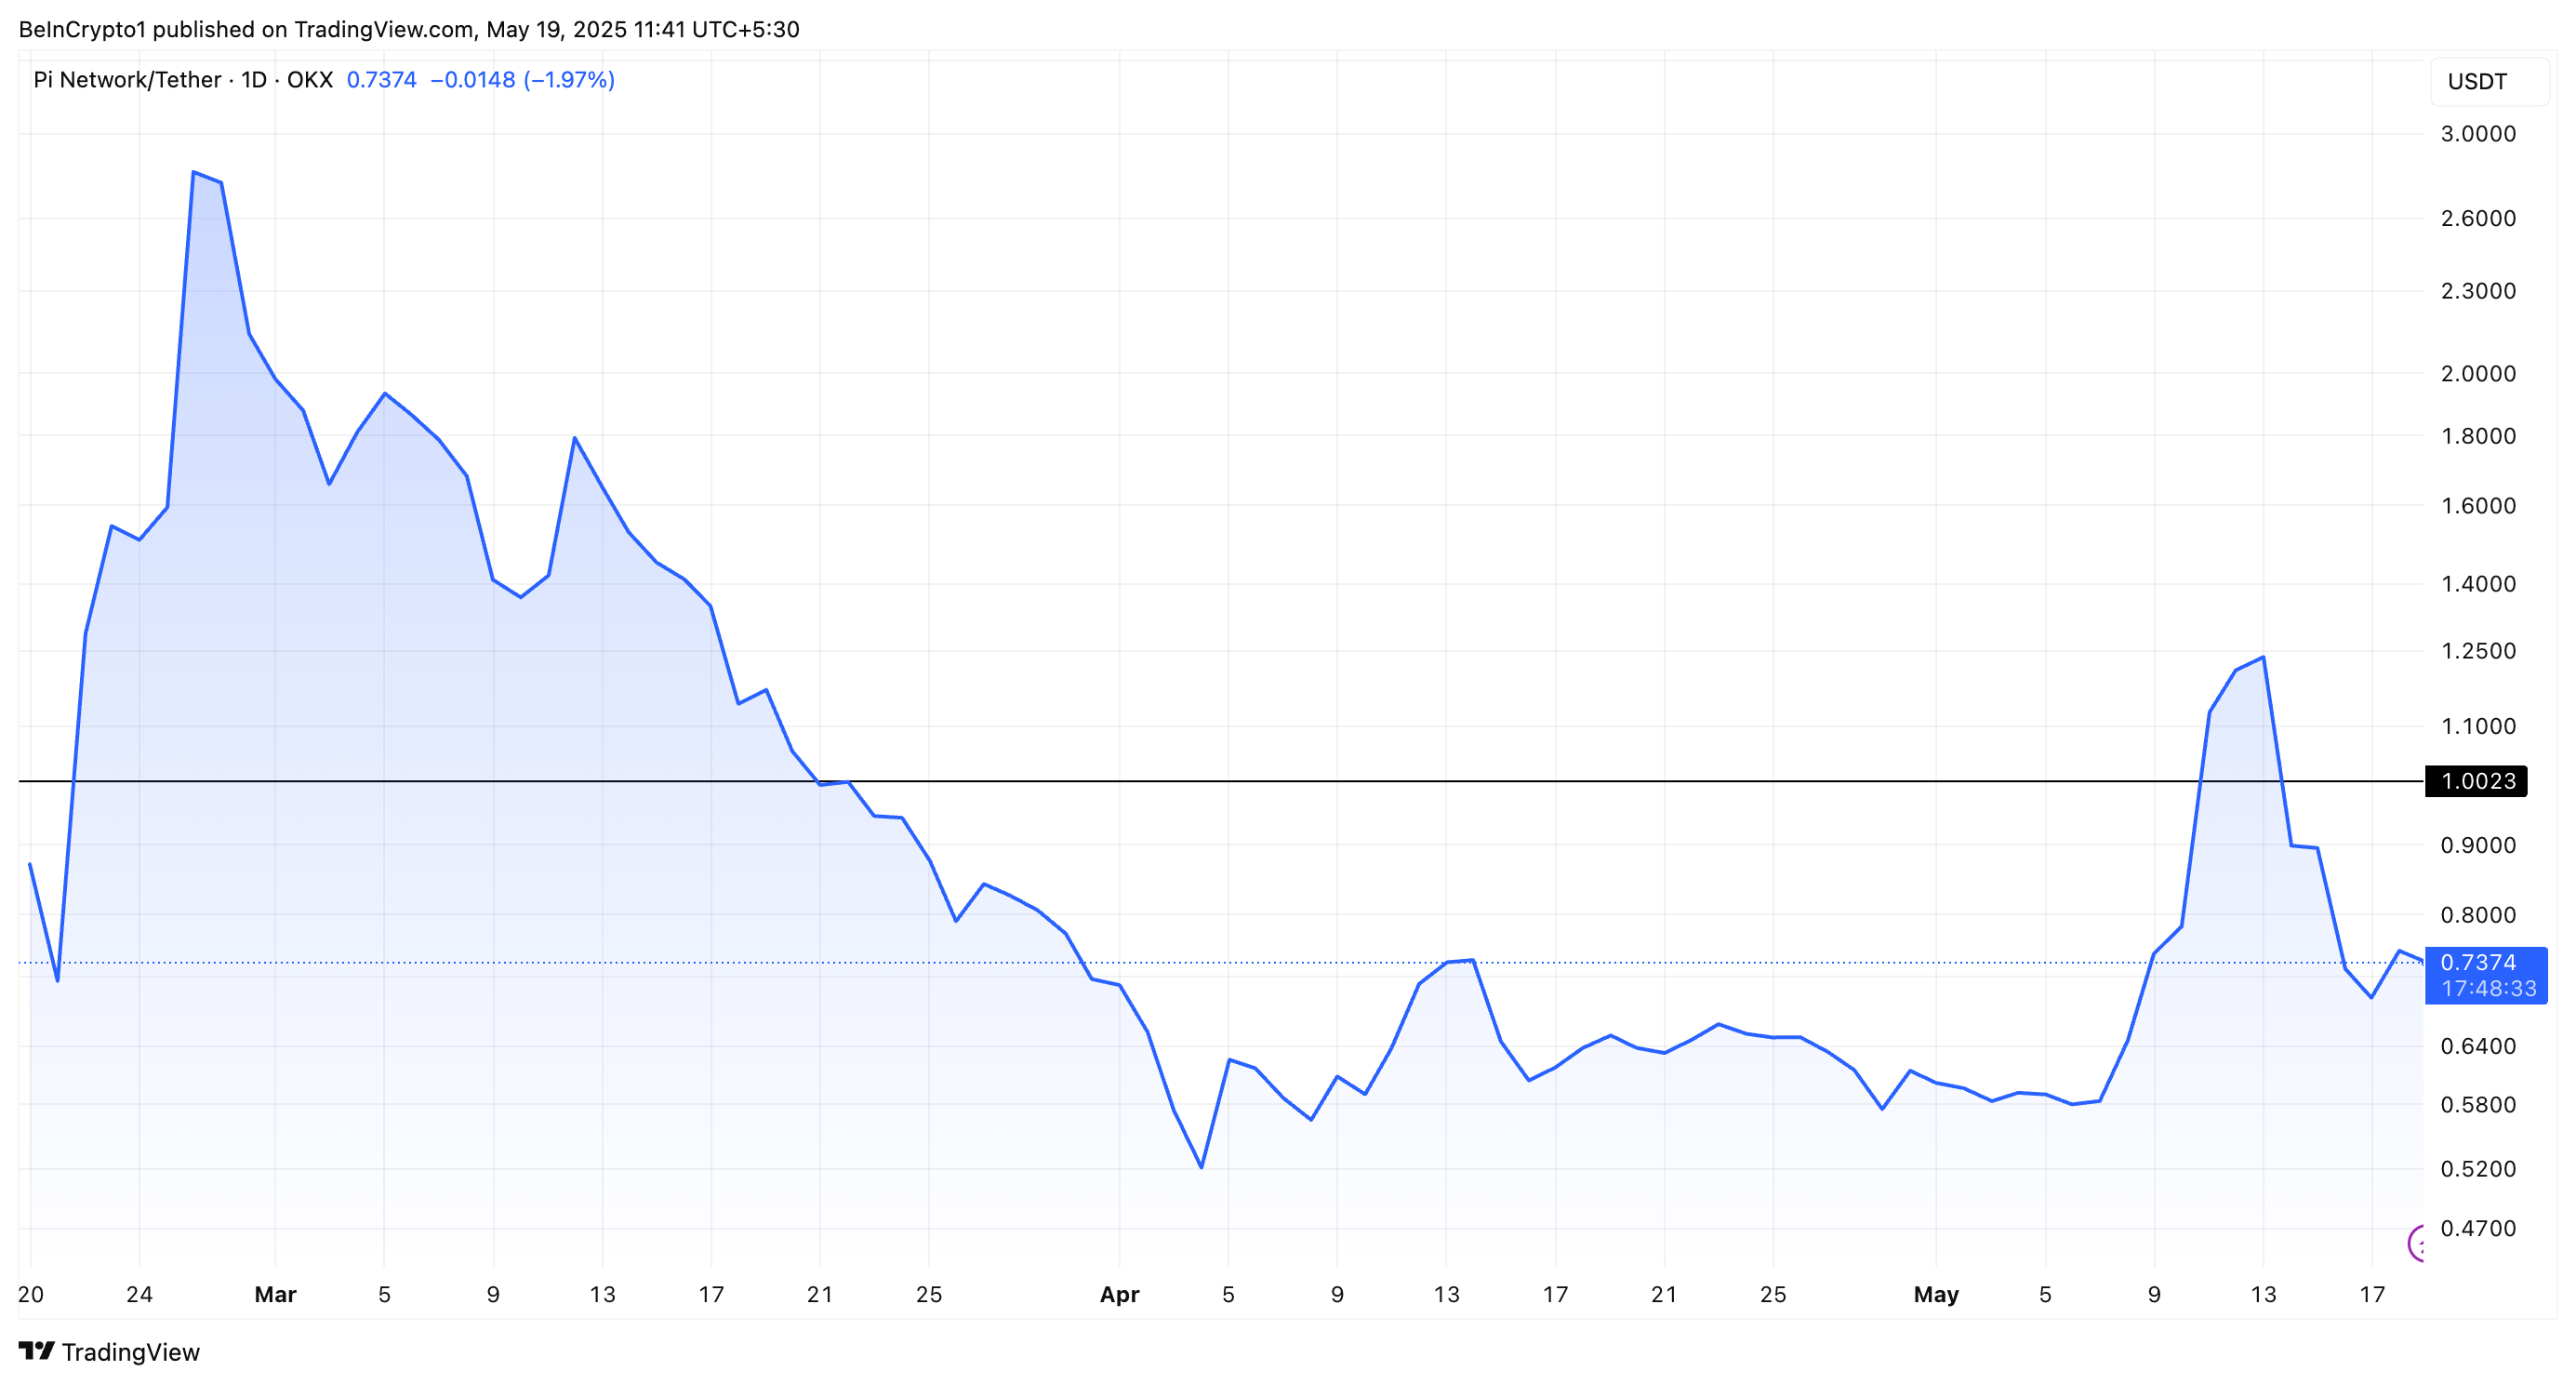
The underwhelming debut worsened as PI dipped below the $1 mark shortly after listing. Although the token rebounded to an all-time high of $3 in late February, the rally was short-lived. PI soon resumed its downtrend, falling below $1 again by late March.
Last week, the level was briefly reclaimed as support. Yet once more, PI failed to hold above it. These declines came despite some bullish catalysts.
The launch of the Pi Ventures Fund was followed by a sharp price drop rather than a recovery. Additionally, Pi Network founder Nicolas Kokkalis made a rare public appearance at Consensus 2025 on May 16.
Many hoped it would restore investor confidence. Instead, the token plunged. BeInCrypto data showed that PI dipped 42.6% over the past week. At press time, Pi Coin’s price was $0.7, down 3.1% over the past day.
While the official announcement outlines a funding pool of up to $100 million, Pi Network Foundation retains full discretion over the deployment of these funds.
“The Pi Foundation is not obligated to invest the entire $100 million, based on the quality of applicants and number of startups accepted into the initiative,” the blog read.
The initiative also allows for phased investments over time. Additionally, the Foundation can discontinue funding at any stage. This condition has not been well received by some in the community, who expected more immediate and guaranteed support for ecosystem development.
“The $100M promise investment will discontinue from time to time if they don’t see any investors coming or having no impact at all LOL,” a user wrote.
4. Pi Network’s Missing Decentralized Apps (dApps)
The concerns extend beyond the fund’s stability. Dr. Altcoin alleged that the team is using the fund to build DApps that should have already been completed.
He explained that one of Pi Network’s mainnet launch conditions was deploying 100 live dApps. As of May 2025, this promise remains unfulfilled, with most dApps still missing from the ecosystem.
“After 6 years of waiting, why isnt anyone asking the real question: Where are the 100 Dapps we were promised?” the analyst stated.
The shortfall has left many in the community questioning the network’s readiness and ability to support a functional ecosystem.
5. Pi Network’s Roadmap Issues
Another major concern is the lack of transparency. Pi Network unveiled a three-phase roadmap for its mainnet migration in April 2025, but the absence of specific timelines has frustrated users.
A report from BeInCrypto highlighted the community’s backlash, emphasizing that the roadmap did not include estimated dates or an audit process to address discrepancies in historical mining data. This has further deepened distrust in the project’s leadership.
That’s not all. Other issues, such as delays in KYC and challenges in migrating tokens to the Pi Network mainnet, have also been prevalent.
Thus, Pi Network’s first three months post-launch have been marked by unmet expectations and growing disillusionment among its Pioneers. As the network navigates these setbacks, its ability to deliver on its ambitious vision will be critical to restoring confidence in the months ahead.
In 2025, the ecosystems that thrive aren’t the loudest — they’re the most strategic, the most focused, and the ones building lasting value. Ecosystem health today is increasingly measured by the depth of developer engagement, not the size of token airdrops or surface-level metrics. Marketing has evolved too: AI tools, grassroots community operations, and hybrid content strategies are replacing short-lived, high-gloss campaigns.
As crypto becomes a fixture in national policy and economic frameworks, credibility and trust within ecosystems have emerged as the new currencies of growth.
There’s no one-size-fits-all playbook anymore. To uncover what’s actually working today, we spoke with growth leaders from Sui, Avalanche, Syscoin, Manta Network, and others.
This report helps to shed some light on the ongoing trends in the crypto-related marketing and find out which of them are setting the pace for the next wave of sustainable growth.
TL;DR:
In 2025, the ecosystems thriving aren’t the loudest. They’re the most strategic, most focused and most aligned with long-term value.
Ecosystem health is increasingly tied to the depth of developer engagement, not the size of token airdrops or vanity metrics.
Marketing has evolved. AI tools, grassroots community ops, and hybrid content strategies are replacing high-gloss, short-cycle campaigns.
With crypto entering national policy agendas and economic frameworks, credibility and ecosystem trust are new growth currencies.
There’s no one-size-fits-all. We spoke with growth leaders from Sui, Avalanche, Syscoin, Manta Network and others to uncover what’s actually working.
Back in 2024, crypto felt like it was everywhere and nowhere all at once.
Timelines were flooded with debates, L1 vs. L2, monolithic vs. modular, liquidity this, fragmentation that. Almost everyone had a hot take and every project was scrambling for a flash of attention that barely lasted longer than a tweet.
You could launch a project, nail the narrative, get your retweets and podcast mentions and still wake up the next day with no real momentum.
It wasn’t sustainable and deep down, most teams knew it.
And yet, behind the scenes, something foundational shifted.
For the first time, crypto became a serious topic in policy rooms.
The U.S. government announced a strategic crypto reserve.
The SEC greenlit Bitcoin and Ether ETPs, signaling a long-awaited shift in regulatory posture.
Lawmakers started treating blockchain not as a niche asset class, but as infrastructure and a core component of national strategy.
Suddenly, crypto had a seat at the big table. That was the moment the growth playbook started to change.
Fast-forward to 2025, ecosystems that had been optimizing for virality started asking tougher questions:
What does long-term credibility look like?
How do we show up to policymakers and enterprises, not just degens and influencers?
Can we measure our health beyond just wallet counts and discord headcounts?
To find answers, we spoke with ecosystem leaders across 10 blockchain networks, from early-stage innovators to mature platforms. Despite technical and strategic diversity, they shared one common mindset: They’re building like they plan to be here in five, ten, twenty years.
This is post-hype crypto and the rules have changed.
Key highlights and critical findings
Marketing budgets are all over the place: Some teams are grinding with less than $100K a year while others are spending $10 million and up. There’s no one-size-fits-all approach, but the gap speaks volumes.
Hybrid teams are the new normal: The smartest teams are optimizing for speed, adaptability, and high-context execution. They’re ruthlessly prioritizing talent that moves the needle, not just fills roles.
Builders are the flywheel: Growth teams are channeling most of their energy into developer outreach such as grants, hackathons, ambassador programs, and local language support are common plays.
Audience alignment: In an oversaturated, narrative-heavy market, cutting through the noise to reach the right set of audience is still one of the biggest hurdles.
Tactics are getting sharper: AI-powered marketing, community-based onboarding, and incentive models like “watch-to-earn” are emerging as key differentiators in creating sticky, engaging experiences.
Research Methodology
To understand what’s driving ecosystem growth in 2025, we went straight to the source in conversations with ten executives across active, forward-thinking blockchain networks including Sui, Avalanche, Manta Network, Syscoin, eCash, and CrossFi Chain.
Our findings are structured across five critical themes:
→ Strategic Priorities
→ Growth Challenges
→ Team Structures
→ Marketing Tactics
→ Budget Allocation
These are the pressure points where ecosystems are being tested, where they’re iterating and where the shift from hype to health is most visible.
The answers weren’t surface-level.
They were honest, revealing, and at times, surprisingly candid.
Section 1: The Evolving Landscape of Crypto Ecosystems
1.1 From Noise to Nuance
Not long ago, crypto felt like a winner-takes-all race.
Ethereum and Bitcoin dominated headlines, while new chains clawed for attention with a flashy feature or a viral announcement.
But that playbook has changed.
Today, the landscape is more fragmented and more alive than ever.
Upstart chains can gain real traction in months. Niche ecosystems are finding staying power by serving focused communities with precision: real dev support, localized outreach, unique tooling, and use cases that resonate with people who actually build.
It’s no longer about being the biggest.
It’s about being the most relevant to the audience that matters.
Source: Market share distribution among top ecosystems.
The momentum has shifted from mass appeal to mission-driven growth.
The ecosystems making progress are the ones listening, serving and playing the long game.
1.2 Key growth metrics and benchmarks
Among surveyed ecosystems, developer adoption has become the north star metric.
While TVL remains a benchmark, leading teams are shifting toward engagement depth over vanity counts. Grants, hackathons, and local campaigns outperform short-term airdrops in both onboarding and retention.
1.3 Critical Challenges Facing Ecosystem Growth
Source: Top Barriers to Ecosystem Adoption Identified by Executives
Based on direct feedback, the top challenges for ecosystems today are:
Difficulty reaching the right audience
Oversaturation of the crypto landscape
Budget constraints and limited runway for experimentation
While blockchain infrastructure is improving,especially with L2 scalability and better dev tooling, the biggest challenges aren’t technical anymore.
They’re strategic.
Most teams aren’t struggling with what to build but with how to position, differentiate, and communicate.
“It’s no longer enough to be technically sound. Ecosystem success depends on whether you can communicate value to developers, users and partners in the clearest, most compelling way possible.” – — Matthew Schmenk, Ecosystem Growth Lead, Avalanche
Section 2: Marketing & Growth Strategies
“Marketing in crypto used to be noise. Now it’s systems thinking – who you reach, how you reach them, and why they stay.”- The Lunar Strategy Team
Ecosystem marketing in 2025 isn’t about dropping a flashy campaign, running a paid KOL loop, and hoping it sticks. Today, marketing is infrastructure.
It’s the connective tissue between ecosystem layers: builders, users, tokenholders, institutions driving onboarding, retention, and legitimacy.
Let’s break it down:
2.1 Choosing the Right Growth Model
Source: Percentage of Ecosystems Using External Agencies vs. In-House Teams
According to our survey:
60% use a hybrid model (in-house + agency)
40% operate with fully internal teams
2.2 Analysing the Pros and Cons
Hybrid models allow for speed and flexibility while maintaining institutional knowledge. Fully in-house teams prioritize cohesion but may lack bandwidth or breadth of expertise.
2.3 Marketing Budget Allocation Across Ecosystems
Annual budgets vary widely:
<$500K: Primarily in-house with lean teams
$500K–$1M: Hybrid setups with agency retained for campaigns
$5M+: Full-stack growth teams covering PR, events, KOLs, paid media, SEO and more
What’s changing in 2025 isn’t just how much teams spend, it’s how precisely they deploy capital:
Early-stage: lean, localized execution
Mid-tier: AI tooling, content ops, ambassador focus
Mature: brand systems, KOL pipelines, segmentation
“In 2024, we spent $2M and didn’t know what moved the needle. In 2025, we’re spending half that – with 3x the return – because we track the full funnel.” — Ecosystem CMO
Section 3: Driving Ecosystem Adoption
As ecosystems compete for market share, one truth is becoming increasingly clear: developers are the new power users.
Ecosystem health is now largely measured by the number and quality of developers actively building, contributing, and shipping.
3.1 Developer Acquisition & Retention
Across the board, developer evangelism and hackathons ranked as the most effective levers for attracting high-quality builders. In 2025, 9 out of 10 ecosystem leaders called them “critical” or “highly effective.”
But incentives alone aren’t enough.
The modern developer is motivated by clear value exchange and personal growth, not just payouts.
Here’s what’s working now:
Hackathons with real-world utility
On-chain recognition (e.g., badges, NFTs)
IRL builder meetups with funded follow-through
In short, developer outreach is all about frictionless onboarding, compelling challenges, and a clear value exchange.
Also, programs that combine monetary reward + mentorship + visibility are far outperforming “spray-and-pray” grants.
Case Highlights:
eCash: Turned its internal engineers into public-facing magnets for talent. Builders engage because they trust the humans behind the chain.
Syscoin: Hosts regionally targeted AMAs → feeds directly into localized hackathons → devs connect directly to mentors.
Sui: “Watch-to-Earn” onboarding that rewards learning with gas fee discounts, NFTs, and access to future funding rounds.
Takeaway: Attracting developers is about storytelling. The ecosystems seeing long-term success are those building not just incentives but infrastructure, identity and upward mobility.
3.2 Community Building & Engagement
While developer acquisition drives infrastructure growth, community engagement fuels longevity. Every successful ecosystem in 2025 has one thing in common: a loyal, activated community with a clear identity.
Source: The Most effective community growth tactics
While growth tactics vary, one truth stands out: the most resilient ecosystems pair online engagement with offline connection.
Top tactics driving community growth:
Strategic partnerships and cross-promotion
Ambassador programs built around values, not vanity
Hybrid content strategies that blend memes, education, and culture
In fact, ecosystems like Sui and Syscoin consistently outperform larger chains on key ecosystem health metrics not because they’re bigger, but because they’re tighter:
Higher TVL per wallet
Greater contributor-to-user ratio
More active builders per community member
Case Study: Syscoin’s grassroots events across APAC led to a 30% increase in wallet retention among new users, with ongoing community-led workshops in 5+ cities.
3.3 The Role of Kaito in Ecosystem Brand Building
In 2025, brand strategy has moved beyond logos and Twitter handles.
The Kaito framework, designed to optimize ecosystem mindshare is fast becoming a differentiator for projects seeking credibility and cohesion.
Source: Kaito mindshare metrics across top ecosystems
Adoption Snapshot:
Only 10% of surveyed ecosystems are currently using a structured Kaito strategy
However, 40% are actively exploring adoption in the next cycle
Projects like Berachain that adopted early Kaito brand structuring reports increased developer trust, faster community onboarding and stronger alignment between technical and community narratives.
Strategic Approaches to Kaito Optimization:
Clear “voice pillars” that reflect ecosystem values
Unified messaging across technical, enterprise, and community verticals
Scalable content kits and assets to empower contributors to amplify the brand
Today, ecosystems aren’t asking “How do we go viral?”
Instead, they’re asking “How do we show up with the right message, in the right format and to the right audience consistently?”
The new growth stack includes:
Influencer alignment by audience layer
PR as a funnel driver, not a vanity boost
Social media as ecosystem UX
AI and segmentation to fine-tune delivery
Let’s break down the mechanics behind the ecosystems getting it right.
4.1 Influencer Marketing Effectiveness
Influencer marketing remains effective, only if you get the tier right.
Source: ROI comparison across influencer tiers
Key Takeaway:
Nano Influencers (1K–10K): ~4.2x ROI
Micro Influencers (10K–50K): ~3.9x ROI
Macro/Mega Influencers: Significantly lower returns due to saturation and high CPM
Nano and Micro influencers (1K–50K followers) outperform all others in ROI due to stronger niche focus, higher engagement, and lower cost-per-activation.
Though, the Top-performing influencer strategies in 2025 blend:
Nano creators for authenticity (Twitter threads, walkthroughs)
Mid-tier educators for onboarding and explanation (YouTube, LinkedIn)
Selective mega partnerships for major announcements or enterprise plays
Best for:
Early-stage projects
Ecosystems entering new regions or subcultures
Campaigns focused on developer credibility over hype
The Lunar Amplification Method
Used by select top-tier ecosystems, the Lunar Amplification Method is a multi-tiered distribution system that combines:
AI-driven influencer matching
Creator content kits (assets, talking points, tone guides)
Performance-based tiers (creators earn more by driving on-chain action)
It’s a system where the creator voice becomes a scalable growth vector backed by data, incentives, and trust.
4.2 Public Relations & Media Coverage
Too many ecosystems view PR as a vanity move.
The most effective teams treat it as distribution infrastructure.
This dual-axis chart illustrates how media coverage intensity correlates with:
Average Developer Sign-ups
Total Value Locked (TVL) Growth
Investing in PR campaigns and consistent media exposure can significantly accelerate ecosystem adoption both in developer participation and capital inflow (TVL).
Key Takeaways:
Developer sign-ups scale from ~50 (Low coverage) to ~400 (Very High coverage).
TVL growth jumps from 5% under low coverage to an impressive 45% with very high media presence.
Higher media coverage directly correlates with a sharp rise in both developer sign-ups and TVL growth.
Example: Manta Network launched its dev-focused ZK SDK and timed the announcement with coordinated earned media + regional hackathons = 3.2x increase in sign-ups over 14 days.
4.3 Social Media Strategy
In 2025, ecosystems aren’t asking “should we be on [platform]?”
They’re asking how do we show up with the right content, for the right moment, on each platform?
This bar chart displays how frequently various social media platforms are mentioned as part of crypto ecosystem growth strategies.
Platform Highlights:
Twitter dominates as the most commonly used platform
Telegram and Discord follow closely, suggesting strong emphasis on community interaction and support hubs.
Lesser-used platforms like Reddit, YouTube and Facebook play a niche role in ecosystem marketing.
However, crypto ecosystems should create platform-specific content:
Twitter: Memes, threads, real-time updates
Telegram/Discord: Community health, AMAs, governance
Ecosystems are moving beyond flat airdrops and short-term incentives, and instead architecting behaviorally intelligent tokenomics that reward commitment, skill and genuine contribution.
The question is no longer “What do we give?” but “What are we reinforcing?”
5.1 Effective Incentive Structures
Incentives were once a shortcut for growth.
Now, they’re shaping everything from user retention to governance alignment to ecosystem stickiness.
Source: This bar chart compares the perceived effectiveness of two major types of incentive mechanisms used in crypto ecosystems.
These often tie directly to network growth metrics such as TVL, active wallets, and user retention.
Off-chain rewards can still be useful for short-term engagement, brand visibility, and community culture.
Projects that tie incentives to measurable contributions and future value (e.g., governance power, access tiers) retain users longer than those offering flat token grants.
Case Examples:
Syscoin offers tiered rewards for contributor milestones
Manta Network combines token drops with future airdrop eligibility tied to participation
5.2 Local Developer Hubs
Ecosystem growth is global by default and regional by design.
Local developer hubs are now a critical piece of post-hype strategy.
Source: Geographic distribution of developer hubs
This chart highlights the regional presence of developer hubs across the globe, indicating where ecosystems are establishing a physical or community-driven footprint to support builders.
Regional presence is shaping ecosystem strength:
Asia-Pacific leads in number of hubs, driven by fast-growing developer ecosystems
North America/Europe hold steady with mature infrastructure and funding access
Latin America, MENA, and Africa show rapid interest but remain early-stage
More consistent retention through community anchoring
Best Practices:
Launch hybrid events (online + local)
Create language-specific docs and support
Offer region-based grant programs tied to local needs
Conclusion
Crypto in 2025 is quieter, deeper, and more intentional.
The ecosystems winning today are building context, culture, and trust, rooted in purpose where meaningful value, thoughtful execution, and trusted communities are taking center stage.
Our deep-dive conversations with builders, marketers and ecosystem leaders across ten blockchain networks uncovered three core principles that are setting the pace for the next wave of sustainable growth:
Developer-First, Always: The thriving ecosystems treat developers with genuine support, visibility, and growth paths. They’ve recognized that every successful builder brings ten more, creating a powerful flywheel effect and it’s the foundation everything else builds upon.
Communities Over Crowds: The most dynamic ecosystems are building tight-knit, purpose-driven communities where members feel ownership and identity. They’re creating spaces where online connections lead to offline relationships and where shared values matter more than token price.
Strategic Over Tactical: Leading teams build comprehensive growth systems where every channel, message, and touchpoint works together. They’re tracking full-funnel metrics and optimizing for lasting engagement, not just initial attention.
We’re past the era of chasing “what’s working.”
The real question is: What’s worth building and who’s staying to build it with you?
So, focus on creating real value for the people who matter most to your ecosystem. Build with intention, authenticity and remember that in a market still finding its footing and the strongest position isn’t being the loudest voice but the most trusted one.
Because ecosystems aren’t websites.
They’re living systems.
About Lunar Strategy’s Ecosystem Launchpad Accelerator
Lunar Strategy’s Ecosystem Launchpad Accelerator combines deep expertise in go-to-market strategy, ecosystem growth, and strategic advisory to help innovative Layer 1 and Layer 2 projects capitalize on the historic crypto market shift.
With 25+ years of combined experience across top ecosystems like Solana, Cardano, Mantle, Polkadot, and ICP, our team brings proven frameworks for: