The crypto market is at a crucial point, with traders wondering whether we’re in for a breakout or a pullback. In a recent Thinking Crypto podcast, host Tony sat down with Brian from Santiment to dig into the data, analyzing just how high Bitcoin, Ethereum, XRP, Solana, and Sui could go, and what metrics matter most right now.
Here, where are these coins heading next!
BTC Eyes on $110K Before the Next Big Move
Looking at the Bitcoin price, Brian says Bitcoin’s MVRV ratio, a tool that tracks unrealized profits, is far from overheating. In past cycles, BTC usually peaks when its 3-month and 6-month MVRV ratios hit extreme highs, and we’re not there yet.
Whale wallets holding 10 to 10,000 BTC now control about two-thirds of the total supply, adding roughly 536,320 BTC in the past year, a 4.1% jump.
Over the weekend, BTC tried to break $123K but failed. Brian thinks we might first see a dip toward the $110K area before any push toward new highs.
Ethereum (ETH)
Ethereum has been riding the ETF approval momentum, with sentiment staying positive. The MVRV shows ETH still has room to grow before hitting the danger zone. He notes that whale holdings have increased, and staking withdrawals remain relatively low, indicating confidence.
As of now, ETH is trading around $4739, reflecting a jump of almost 30% in a week. With a key resistance lies near $4,830, with a potential climb toward $5,000–$5,500 if momentum continues.
XRP
Moving forward with XRP, Brian suggests that MVRV data shows it remains undervalued compared to its historical peaks. He believes the lack of extreme euphoria could mean long-term upside, but it may take time.
The chart shows resistance at $3.45, with a breakout potentially sending XRP toward the $3.6–$3.80 range. Whale activity is steady, but the real push might come from overall market strength.
Solana (SOL)
Coming onto Solana, its MVRV ratio is still at comfortable levels, not showing signs of overheating. Brian notes SOL often makes explosive moves when MVRV spikes, and right now it’s well-positioned for upside.
Over the past week, SOL’s price has increased by over 22%, now trading at $205.83. Strong resistance sits at $220, and breaking above could open the path to $235–$250.
Sui (SUI)
Being a newer asset, Sui still has plenty of room for growth, but Brian says its MVRV metrics suggest it’s nowhere near overheated. This gives it potential for strong gains if the market turns risk-on.
Adding to the excitement, European investment firm 21Shares has filed for a spot Sui ETF in the U.S. For now, SUI faces resistance at $4.20, with upside targets of $4.60–$5 if momentum continues.
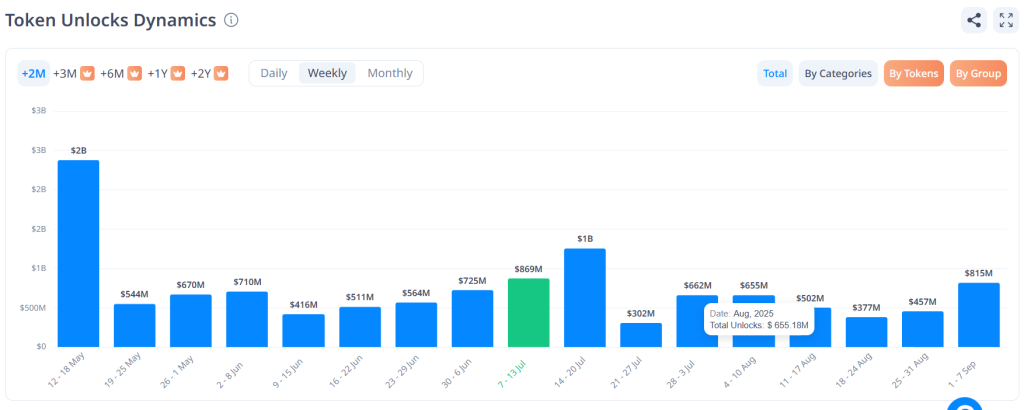
With several high-profile unlocks already underway, July 2025 continues to shape up as one of the most impactful months, with over $1.8 billion in cumulative value scheduled, including the now-completed $323M unlock from SUI earlier this month, the largest of July. According to TokenUnlocks data, unlock activity will peak in the third week of July at nearly $1 billion.
This influx of supply comes at a time of cautious market sentiment and reactive liquidity flows, turning each event into a potential catalyst. From Solana-based meme coins like TRUMP to Layer-2 leaders like Arbitrum (ARB) and modular chains like SUI, the unlock wave offers both risk and short-term trading opportunities.
Official Trump (TRUMP) Token Unlock
Image Source: Cryptorank
Unlock Date: July 18, 2025 Unlock Amount: ~90M TRUMP Value: ~$455M–$462M % of Max Supply: ~9% Category: Creators & CIC Digital 1–4 allocations
President Donald Trump has reportedly added over $620 million to his net worth through cryptocurrency ventures, with the TRUMP token playing a central role. The token, a Solana-based meme coin that once surged on viral hype and political fandom, is now at the centre of a substantial unlock event that could impact price volatility and market sentiment. This unlock marks the first major release of team and contributor tokens, following a 6–12 month cliff. With only 20% of TRUMP’s 1 billion supply currently circulating, the upcoming 9% unlock significantly changes its tokenomics, introducing new liquidity and potential sell pressure.
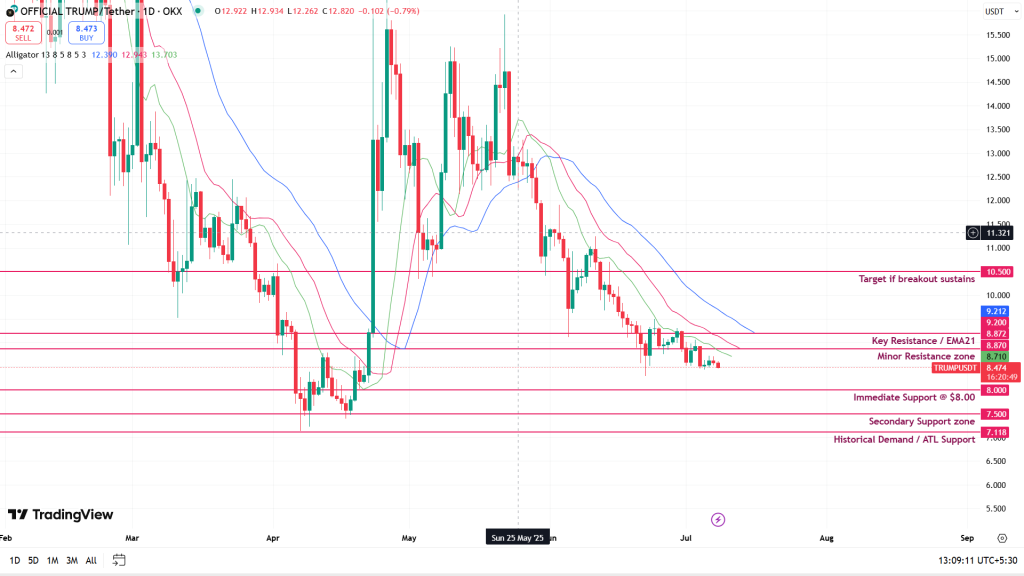
TRUMPUSDT Price Analysis: Bearish Structure Ahead of Major Unlock
Image Source: Trading View
TRUMP is trading around $8.60, consolidating in a tight range ahead of its $455M token unlock on July 18. Price action remains subdued, with the formation of lower highs since its $11.30 peak in early June.
The Alligator indicators that represent different timeframes and help traders identify when a market is trending, consolidating, or preparing to reverse are fully fanned out in a bearish formation, with the green line (Lips) trailing below the red (Teeth) and blue (Jaw), confirming a persistent downtrend.
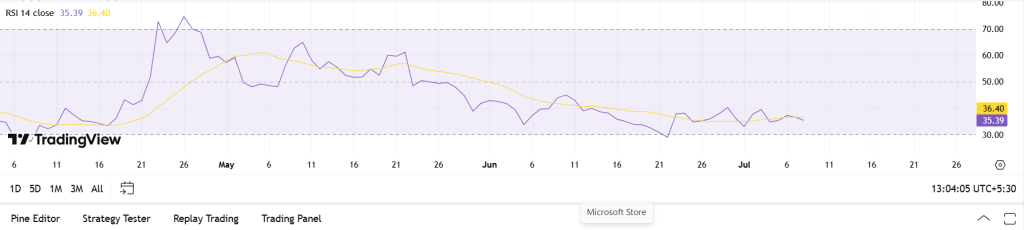
The RSI at 38.5, while rising slightly above its signal line at 36.8, suggests weak bullish momentum but still hovers in bearish territory, implying hesitation from buyers.
A breakdown below $8.00 could accelerate losses to $7.50, with $6.90 as the next major demand zone.
Conversely, a close above $9.20 is needed to invalidate this structure and target $10.50. Until then, the unlock event and broader meme coin fatigue weigh heavily on sentiment.
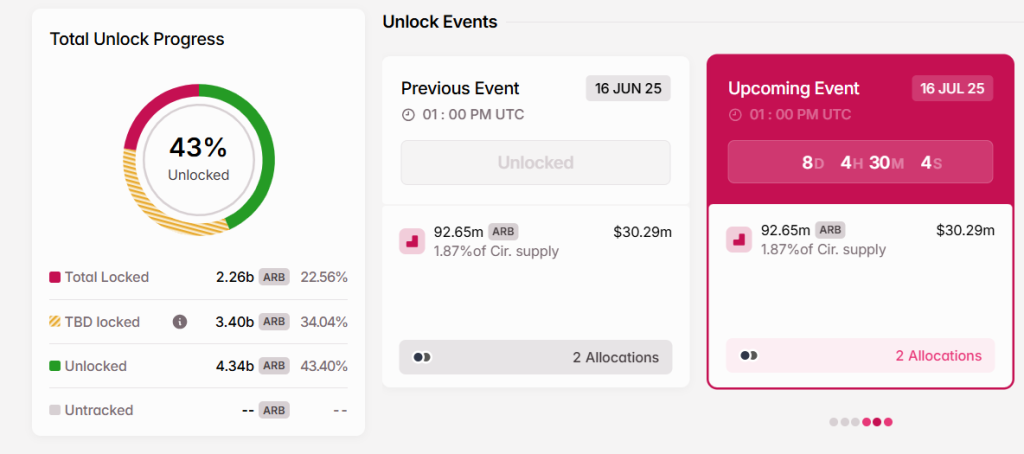
Unlock Date: July 16, 2025 Unlock Amount: ~92.65M ARB Value: ~$30.3M % of Max Supply: ~1.17% Category: Team & Advisor allocation
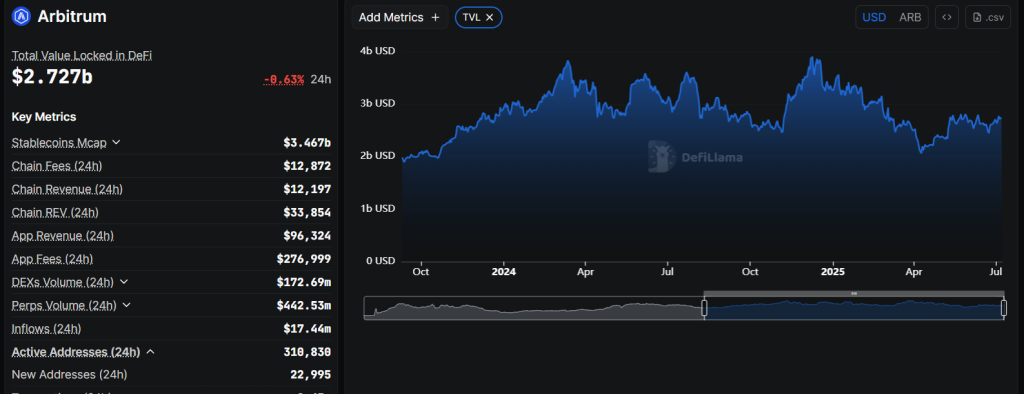
Image Source: Defilama
Arbitrum remains the dominant force among Ethereum Layer-2s, currently holding over $2.4 billion in TVL—representing approximately 55–60% of all L2 value locked, as per DeFiLlama.
June saw explosive growth across Arbitrum DeFi protocols like Uniswap, Fluid, and SushiSwap, collectively drawing 2.4M+ users and sustaining high DEX liquidity.
Yet, despite strong fundamentals, the upcoming unlock for team and advisors introduces a fresh token supply that could dampen short-term price action.
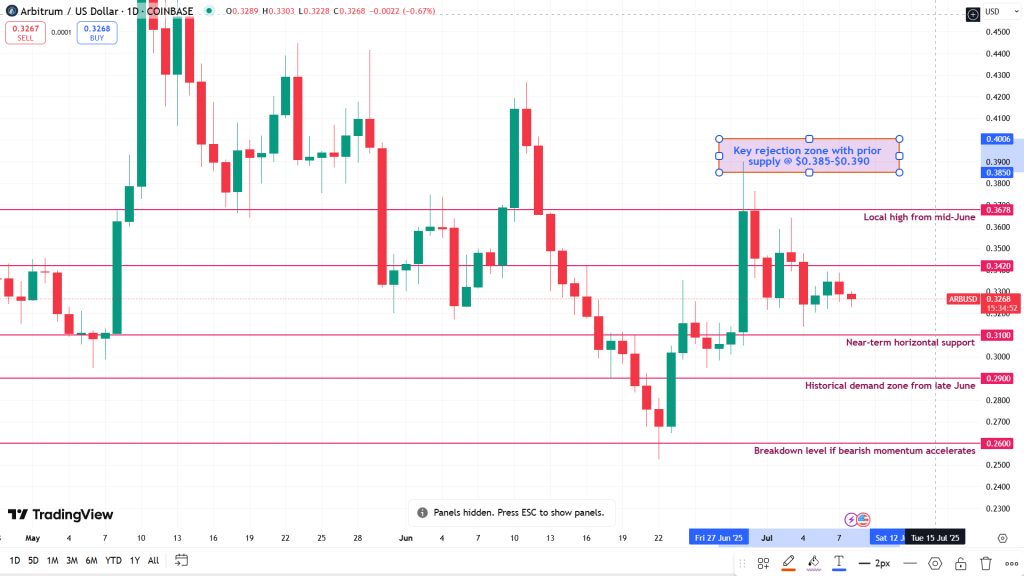
ARBUSD Price Analysis: Stalled Recovery with Bearish Tilt
Image Source: Trading View
Arbitrum (ARB) trades at $0.33, consolidating below the $0.34 resistance after multiple failed attempts to push higher. Price structure remains fragile, with no clear higher highs since the late June bounce. The Williams %R sits at –67, indicating bearish momentum creeping back in as buyers struggle to sustain pressure.
Support rests near $0.310, with a breakdown risking a slide toward $0.285. If bears gain traction post-unlock, deeper moves toward $0.250 could follow.
On the upside, ARB must close above $0.342 to signal a trend reversal. A breakout there could pave the way to $0.375 and possibly $0.41 if momentum revives alongside strong L2 narrative traction.
Other Upcoming Token Unlocks to Watch – July 2025
1. ZRO (LayerZero) – July 20
LayerZero, the newly launched omnichain interoperability protocol, is set to unlock 24.68M ZRO tokens (~$46.5M)—its first major post-airdrop release, expanding circulating supply by over 2.5% within weeks of listing.
2. AVAIL – July 23
AVAIL, the modular data availability chain founded by a Polygon co-creator, will unlock 990.6M tokens (~$23.7M)—a staggering 9.2% of its total supply, potentially triggering volatility in the under-the-radar L1 space.
3. XDAO – July 21
XDAO, a rising DAO infrastructure protocol, will release 6.44M tokens worth over $330M, a disproportionately large unlock that could create sharp price swings given its low market cap and liquidity.
4. MOCA – July 11
MOCA, a Web3 culture and GameFi governance token, is scheduled to unlock 241.72M tokens this week, aimed at community and contributor rewards, injecting liquidity into a niche but growing ecosystem.
Plume Network, focused on real-world asset tokenization, is unlocking 239.8M tokens (~$21M) just ahead of its mainnet launch phase, highlighting investor interest in the RWA narrative
The post TRUMP Coin Set For First Major Token Unlock This July. ARB, SUIAnd More To Follow appeared first on Coinpedia Fintech News
With several high-profile unlocks already underway, July 2025 continues to shape up as one of the most impactful months, with over $1.8 billion in cumulative value scheduled, including the now-completed $323M unlock from SUI earlier this month, the largest of July. According to TokenUnlocks data, unlock activity will peak in the third week of July …
Ethereum (ETH) is down almost 6% in the last 24 hours, intensifying a week of sharp declines. With the price below $1,500, market watchers are increasingly questioning whether ETH could fall to $1,000 in April.
Mounting concerns around liquidations, declining network activity, and bearish technicals are fueling the debate. As investor sentiment wavers, the next few days could prove critical for Ethereum’s short-term trajectory.
If ETH Falls Below $1200, Nearly $342 Million Will Be Liquidated
Ethereum is currently hovering just above the $1,500 mark, down more than 15% over the past week as bearish pressure intensifies across the crypto market.
The recent downturn has sparked concern among traders, especially with ETH struggling to hold key support levels. Standard Chartered recently stated that XRP could overtake Ethereum by 2028.
The decline reflects broader risk-off sentiment and uncertainty surrounding altcoins, with Ethereum now teetering dangerously close to levels that could trigger a major wave of liquidations.
According to on-chain data, if ETH falls below $1,200, it could trigger liquidations totaling approximately $342 million across leveraged positions.
Liquidation occurs when traders who borrowed capital to go long on Ethereum are forced to sell their holdings due to falling prices. This effectively amplifies the downside and adds more selling pressure.
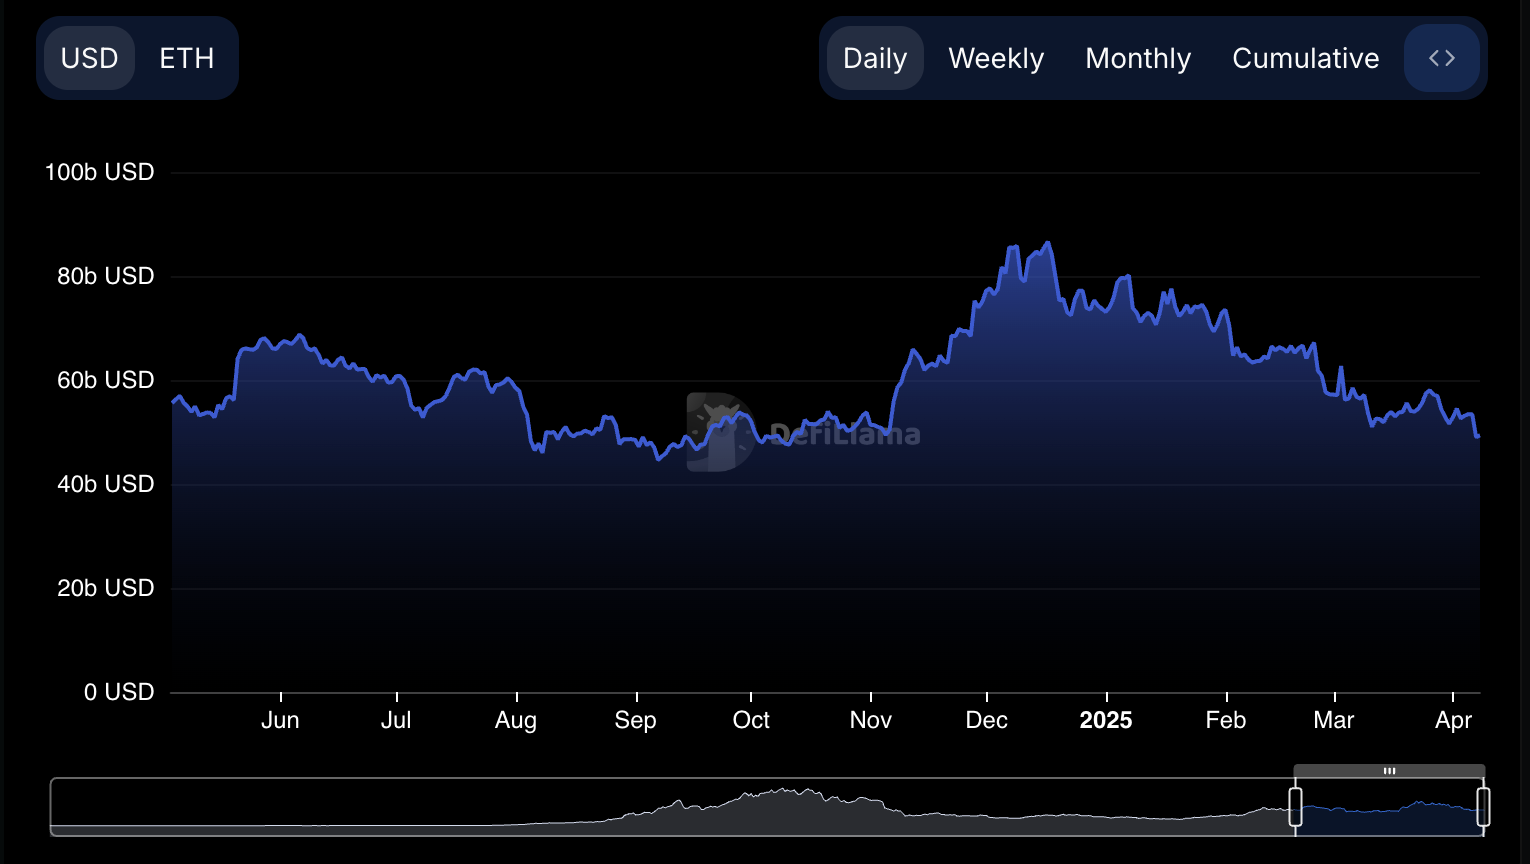
TVL measures the total capital deposited into decentralized finance (DeFi) protocols on a blockchain and serves as a key indicator of ecosystem health and investor confidence.
A rising TVL generally signals growing trust and usage of DeFi applications, while a falling TVL suggests declining demand and reduced engagement.
Ethereum Is Currently 70% Down From Its All-Time High
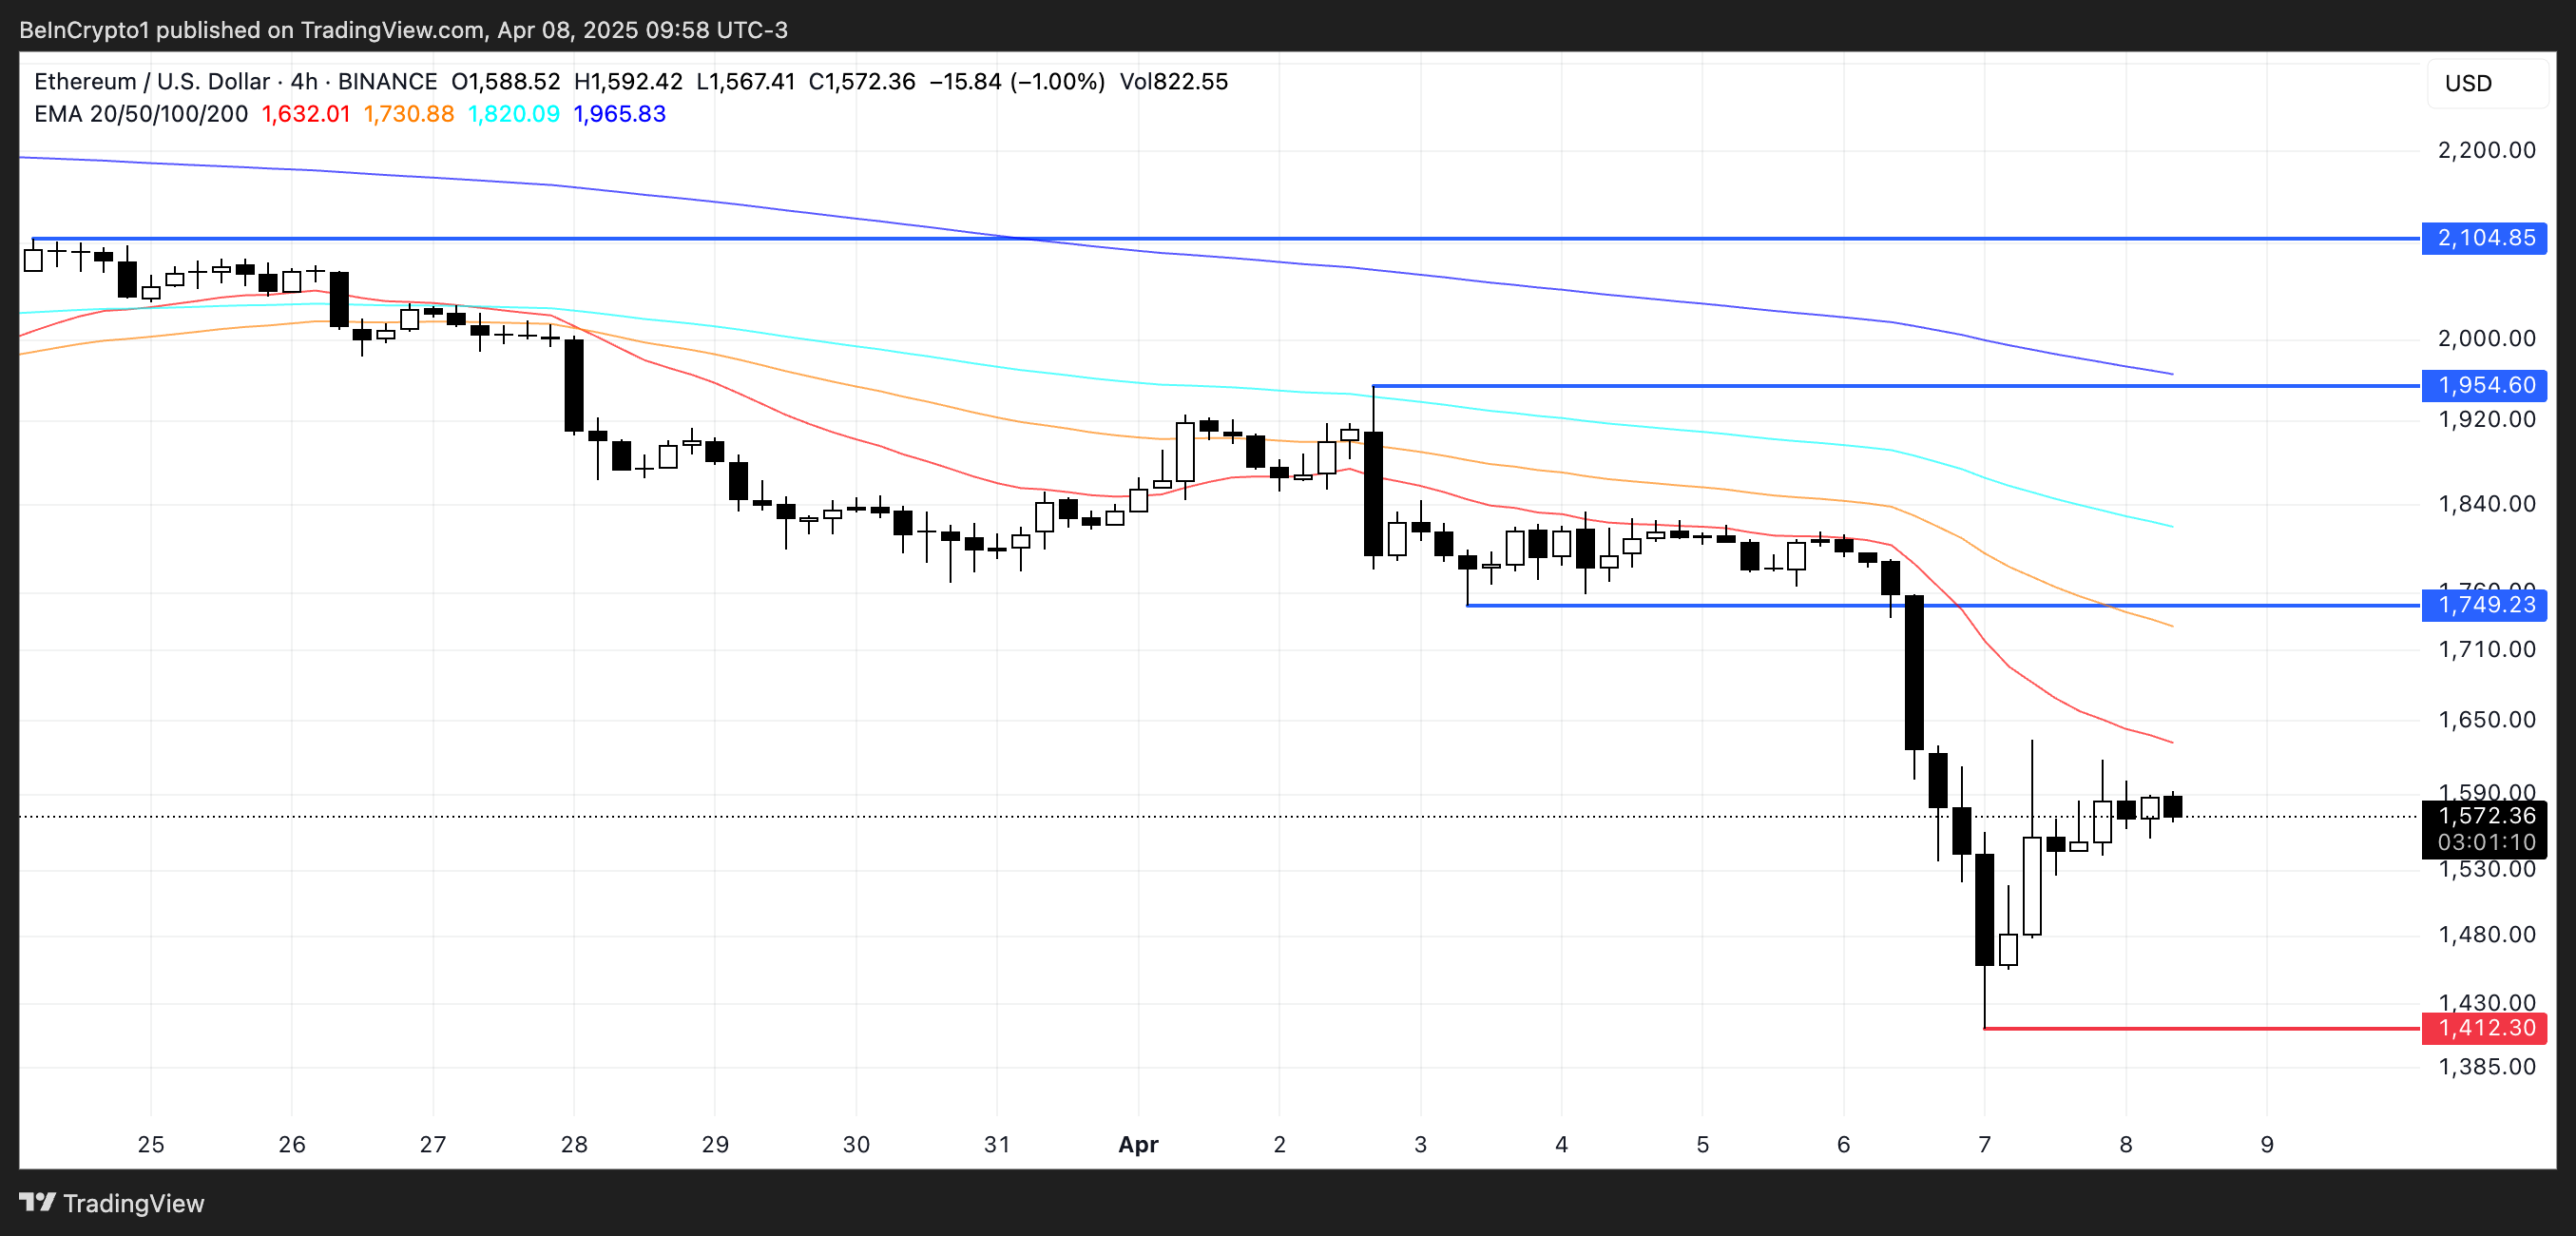
Ethereum’s price has been trading below $2,000 since March 26, and its technical indicators don’t look promising.
The current setup of its Exponential Moving Averages (EMAs) shows a bearish formation, with short-term EMAs positioned below the longer-term ones — a classic signal of ongoing downside momentum.
This suggests that sellers are still in control, and the market could be bracing for further correction.
If bearish momentum continues, Ethereum may retest support near $1,400. A breakdown below that level could trigger a deeper sell-off, with Ethereum price potentially sliding toward $1,000 in April — a key psychological and historical level.
However, if bulls regain control and reverse the trend, ETH could first challenge resistance at $1,749.
A breakout above that would open the door for a test of $1,954, and if momentum stays strong, Ethereum could push past the $2,000 barrier and aim for $2,104.
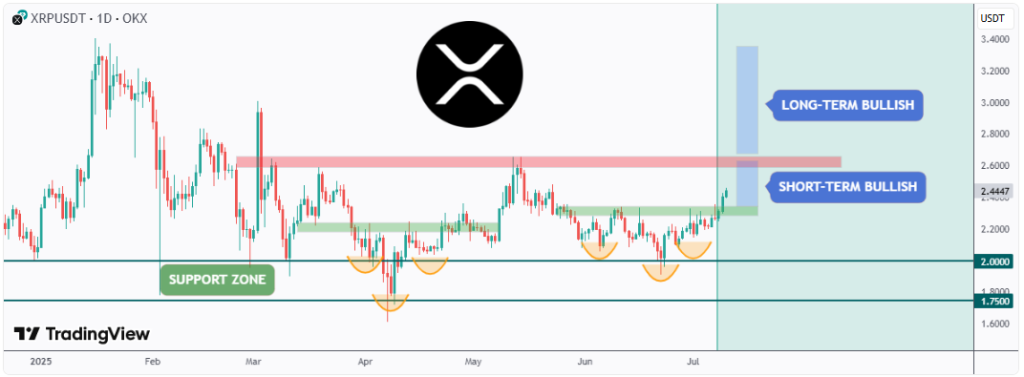
The XRP price has made headlines by strongly advancing on Wednesday by breaking through a multi-month resistance area. This move has reignited bullish sentiment among traders. Experts closely monitoring now believe, after witnessing this surge, that another surge could propel the price of XRP to higher levels.
This optimism is supported as its parent company, Ripple, enjoys a series of positive developments, and experts now believe that its price action has led to the emergence of a new inverse head and shoulders pattern, which may indicate a long-term potential reversal in the near future.
Moreover, the investor sentiment has also shifted to a more bullish outlook, with many anticipating that XRP would continue its upward trajectory and aim for a higher target by the end of July.
Analyst Targets $3.30 In XRP Price
Crypto analyst TheSignalyst recently highlighted that the XRP price has entered an Inverse Head and Shoulders pattern. This formation has emerged at a crucial moment, coinciding with strong support levels which were maintained by bullish traders for several months.
As of now, Bitcoin has also surpassed its June high, and XRP crypto is riding on that momentum, having climbed to $2.45. The analyst notes that in the short term, the price could reach between $2.62 and $2.66.
Looking ahead, TheSignalyst displays that a decisive break above the $2.66 level is essential for confirming a bullish continuation. If this setup holds, the analyst projects that the XRP price could potentially reach as high as $3.30 in the long term.
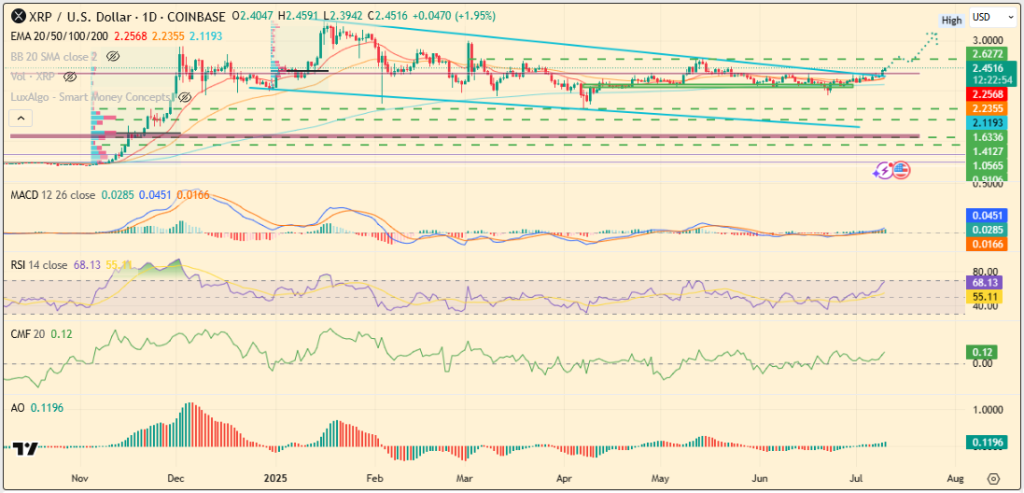
Indicators Analysis Shows Bullish Strength
The XRP price is demonstrating notable bullish strength, with today’s momentum highlighted by several bullish indicators. The MACD has revealed a golden cross, with the histogram rising at 0.0277. Currently, the MACD line sits at 0.0440, while the signal line is at 0.0164.
In addition, the Awesome Oscillator (AO) supports this bullish sentiment, as its histogram has also climbed at 0.1196. The Chaikin Money Flow (CMF) also indicates positive trends, currently jumping from 0 line to 0.11, reflecting an increase in money inflows.
Moreover, the Relative Strength Index (RSI) is on the rise, inching closer to overbought territory at 67.48. This suggests a strong likelihood of another price spike in the short-term before the market becomes overheated.
The post Can XRP Price Reach $3.30 by Month-End? appeared first on Coinpedia Fintech News
The XRP price has made headlines by strongly advancing on Wednesday by breaking through a multi-month resistance area. This move has reignited bullish sentiment among traders. Experts closely monitoring now believe, after witnessing this surge, that another surge could propel the price of XRP to higher levels. This optimism is supported as its parent company, …