USDC issuer Circle is again looking to make headways in the stablecoin industry and assert its dominance, unveiling the ‘Arc’ Layer-1 network. The Circle Arc blockchain will focus on stablecoin payments and have USDC as its native gas token. Details About The Circle Arc Blockchain In a press release, the USDC issuer announced Arc, an
Ethereum (ETH) is up more than 10% over the last seven days as the market shows signs of renewed activity. However, key technical indicators reveal a mix of weakening trend strength and cautious optimism from buyers.
ETH is currently battling critical resistance zones that could define whether the rally continues or fades. With momentum still fragile, May could be a decisive month for Ethereum’s next major move.
Ethereum’s Trend Weakens Sharply as Bears Close In
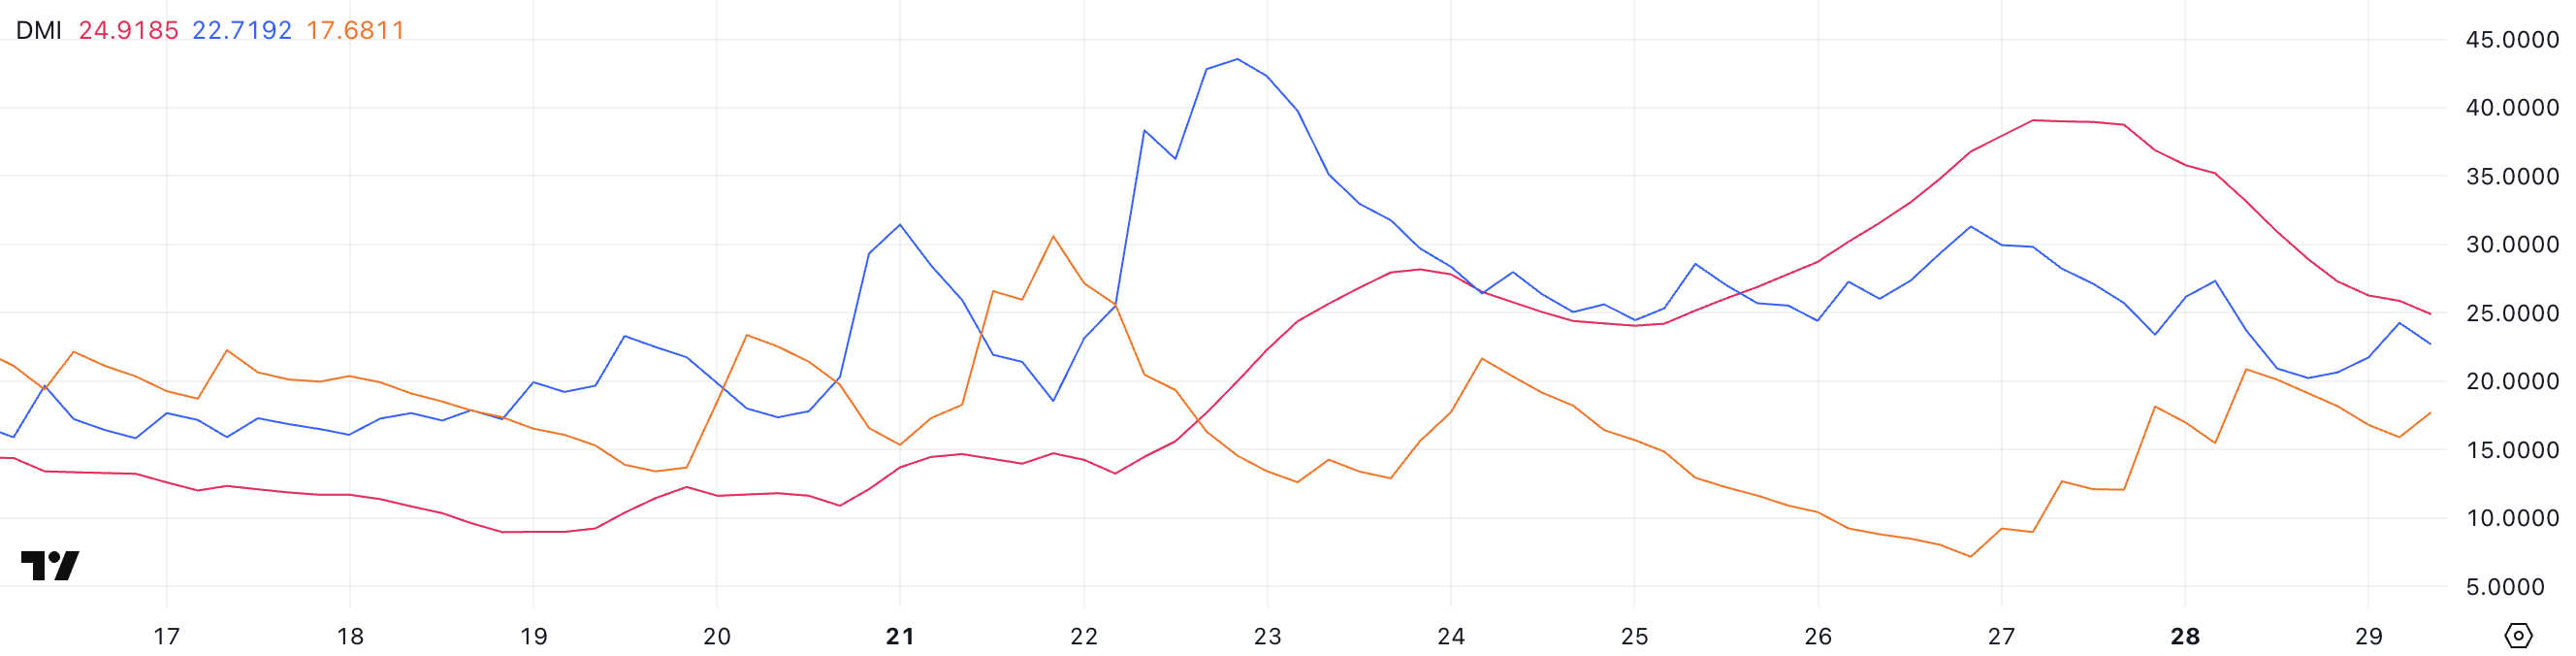
Ethereum’s DMI chart shows its ADX is currently at 24.91, a sharp decline from 39 two days ago. The ADX, or Average Directional Index, measures the strength of a trend, whether up or down.
Generally, an ADX reading above 25 signals a strong trend, while values below 20 suggest the market is entering a period of weakness or range-bound trading.
The steep drop in ADX indicates that Ethereum’s recent momentum is quickly losing strength. Without renewed buying or selling pressure, ETH could remain stuck in a more volatile, sideways pattern over the short term.
Meanwhile, the directional indicators are showing a clear shift. The +DI, which tracks bullish pressure, has dropped to 22.71, falling from 31.71 three days ago and 27.3 yesterday.
In contrast, the -DI tracks bearish pressure has climbed to 17.68, up from just 7.16 three days ago and 15.64 yesterday. Yesterday, the gap between buyers and sellers nearly closed, with +DI at 20.91 and -DI at 20.1, suggesting sellers almost regained market control.
ETH RSI Climbs After Sharp Drop: Will the Recovery Hold?
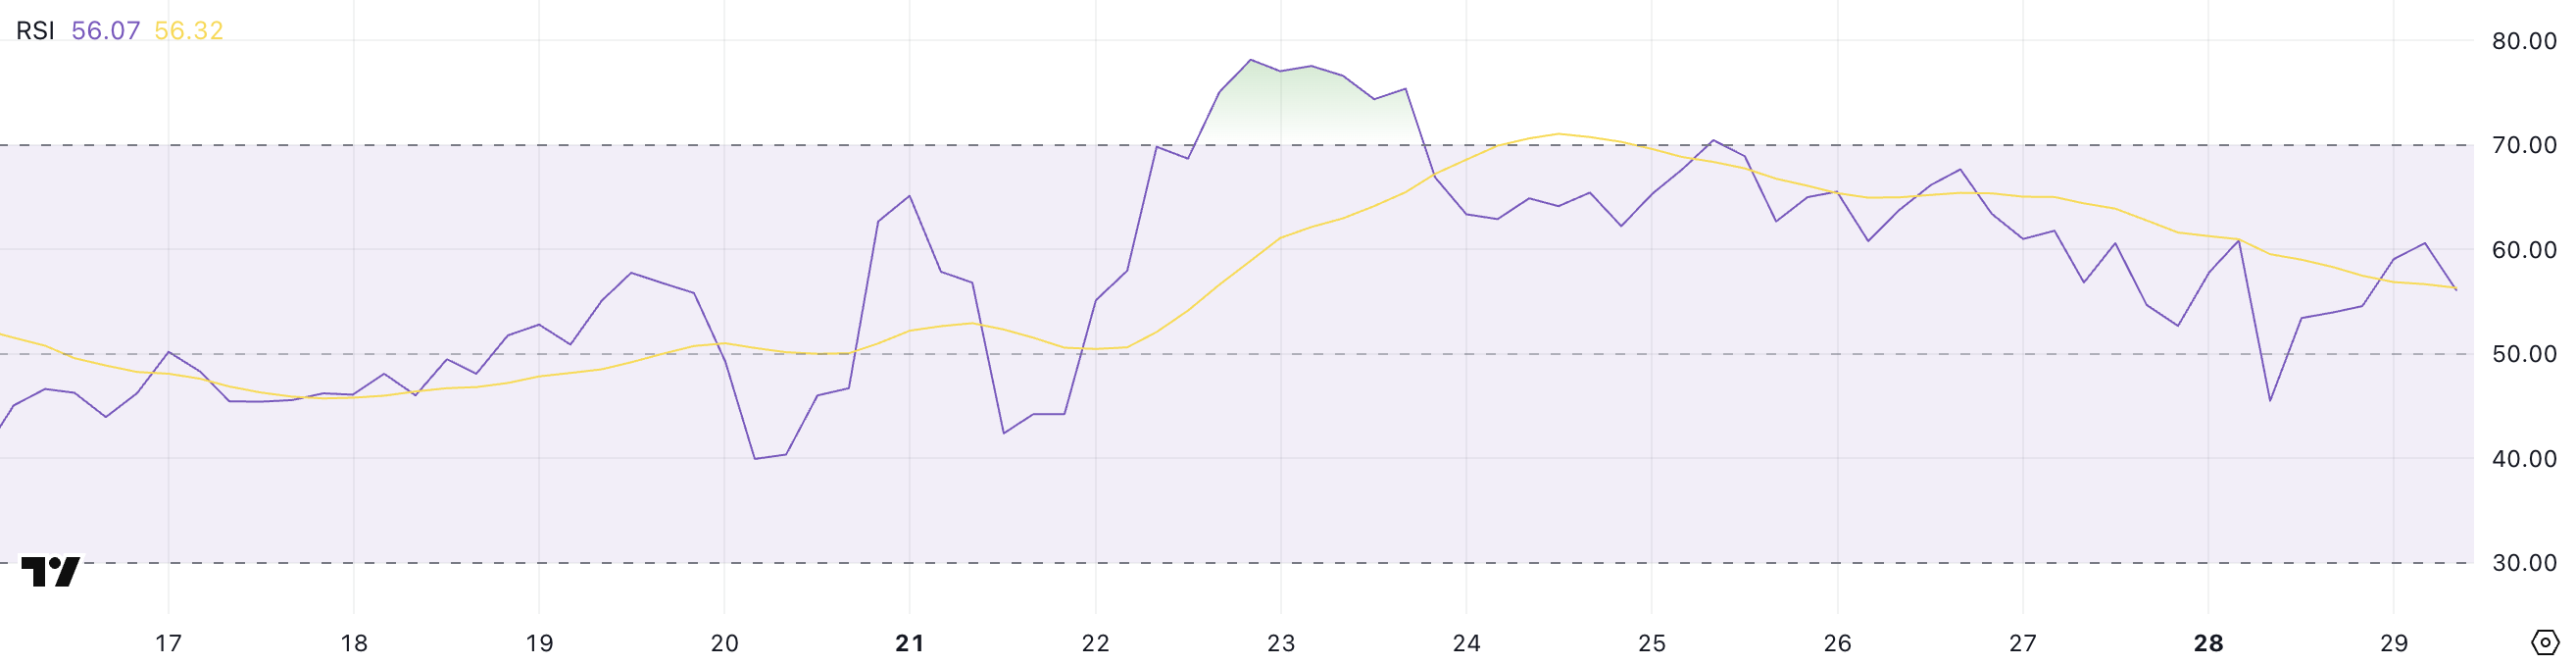
Ethereum’s RSI is currently sitting at 56, up from 45.5 one day ago, after reaching 70.46 four days ago. The Relative Strength Index (RSI) is a momentum indicator that measures the speed and magnitude of price movements.
Typically, an RSI above 70 suggests an asset is overbought and may be due for a pullback, while an RSI below 30 indicates oversold conditions and the potential for a rebound.
Readings between 30 and 70 are considered neutral, with levels around 50 often signaling a market at a decision point. The sharp swing in Ethereum’s RSI over the past few days reflects the recent volatile sentiment around ETH.
With the RSI back up to 56, Ethereum has regained momentum after dipping into neutral-to-bearish territory. A reading above 50 leans slightly bullish, suggesting that buyers have started to reassert some control, though not with overwhelming strength.
However, if momentum stalls again and the RSI turns back down, it would suggest the recovery is losing steam and that Ethereum could fall back into a broader consolidation or even a correction phase.
Ethereum Battles Key Resistance as Breakout or Breakdown Looms
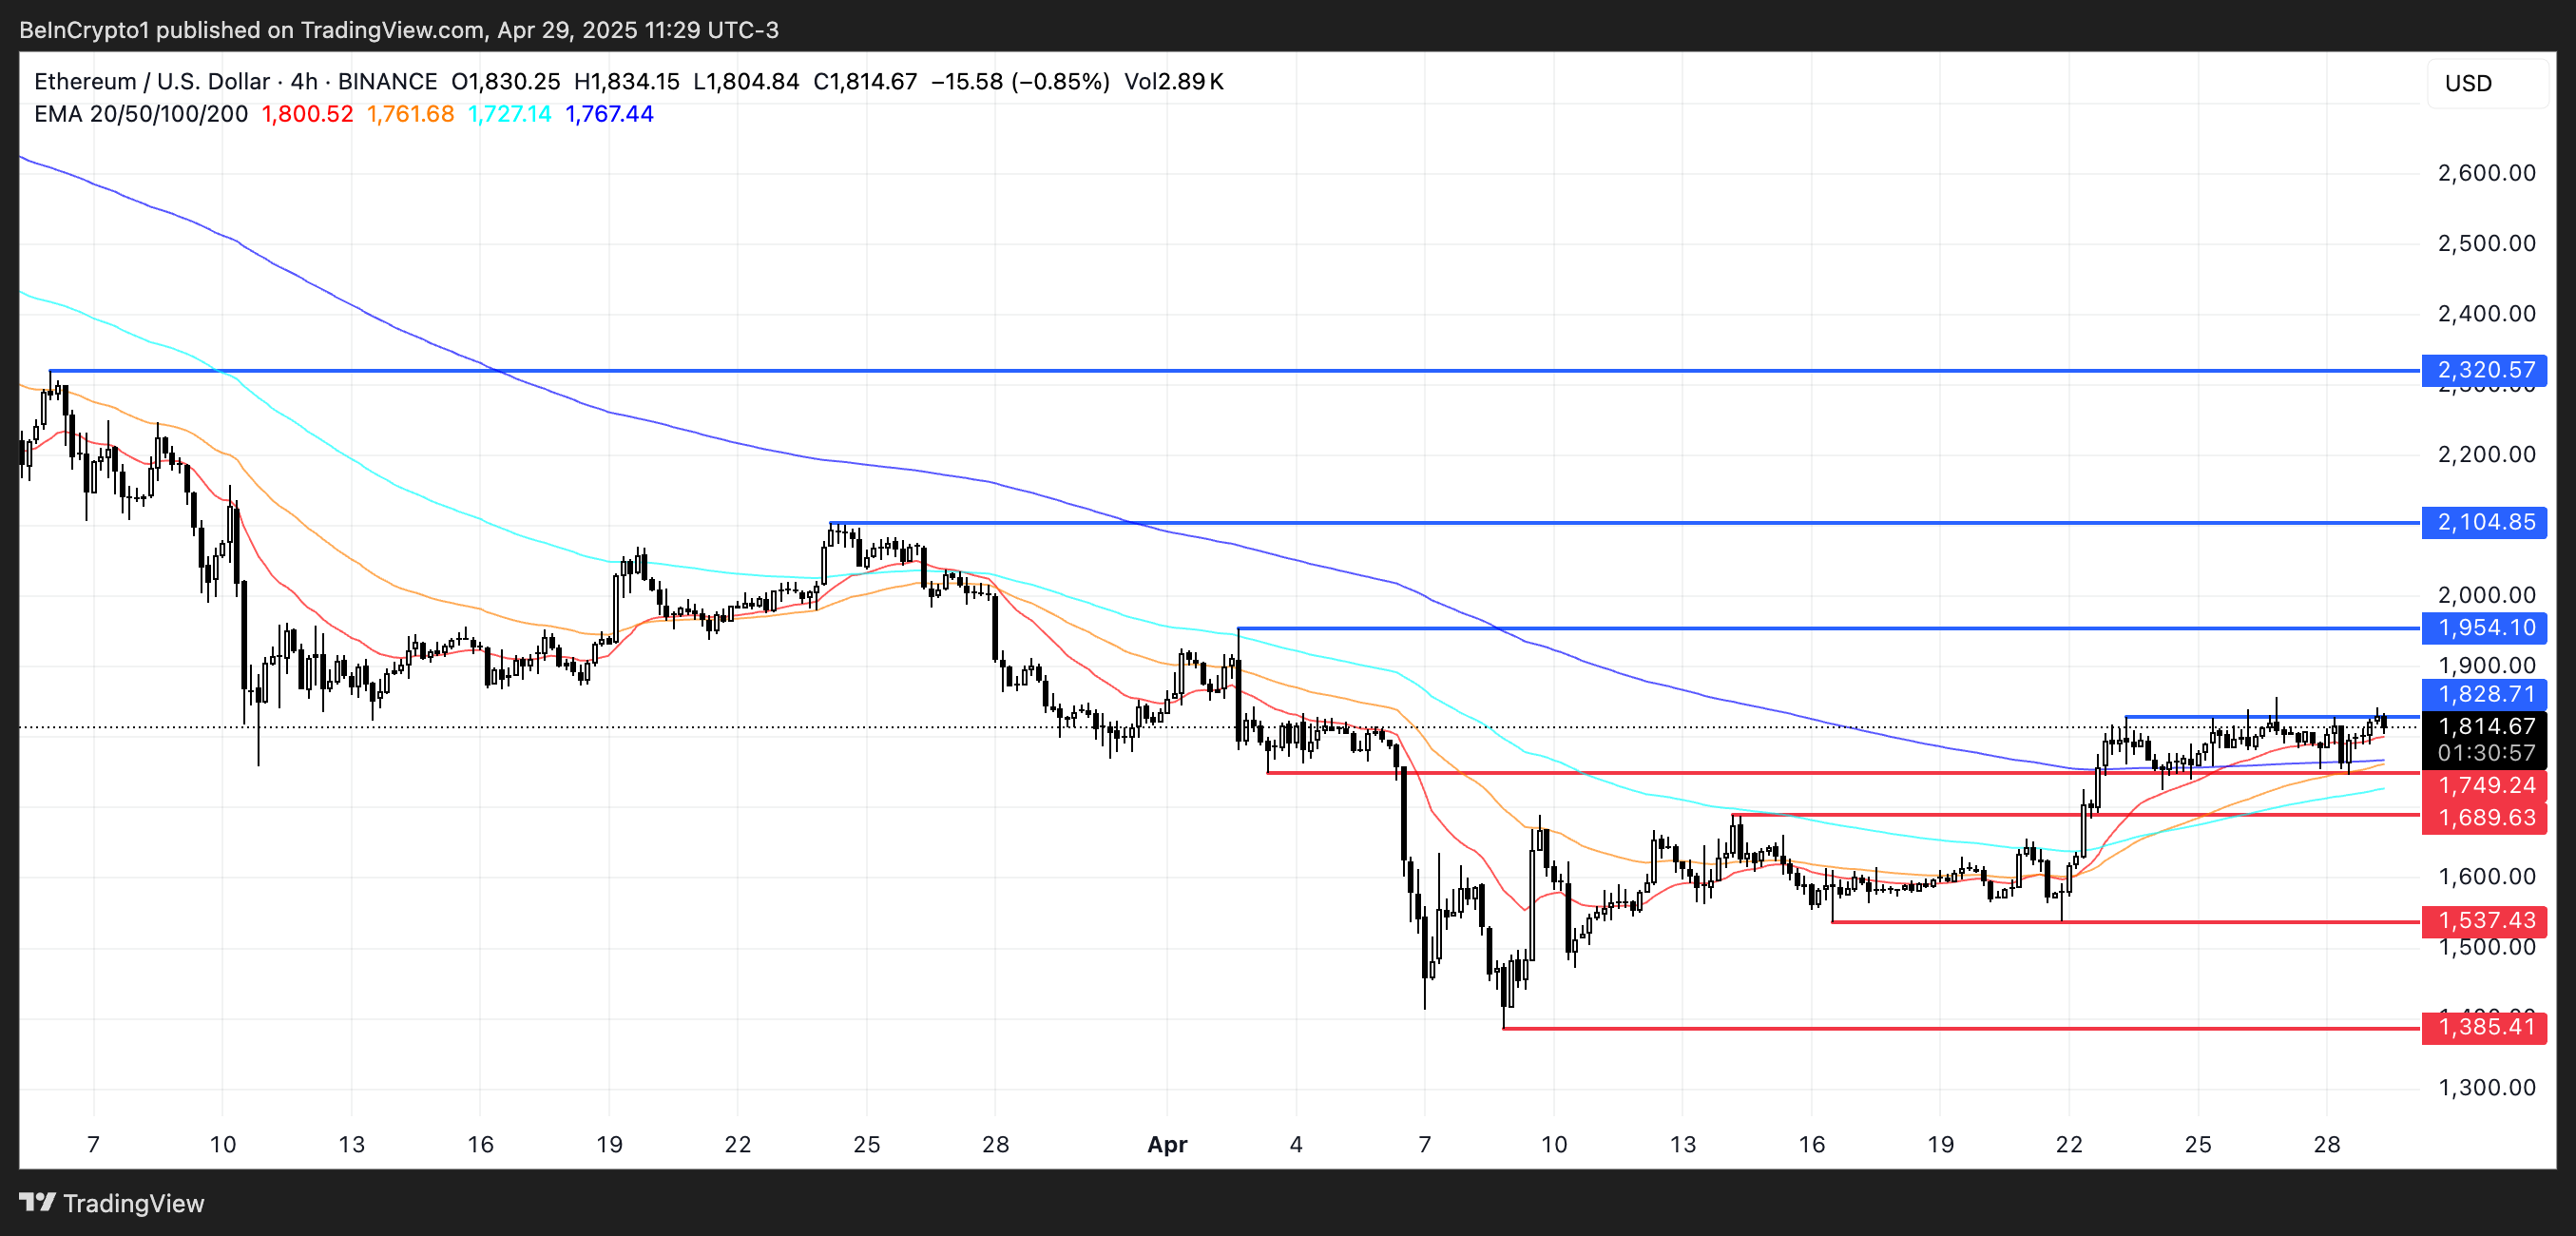
Ethereum price has made several attempts over the past few days to break above the resistance level at $1,828. If ETH manages to break and hold above this level decisively, it could open the door for a stronger move upward.
The next major target would be $1,954, and if bullish momentum remains strong, a further rally toward $2,104 could unfold. Ethereum could eventually test $2,320 in an even more aggressive uptrend, marking a significant bullish extension.
These levels will be key to watch as they could define the strength and sustainability of any breakout in the coming days.
On the downside, if Ethereum fails to hold its current levels and the trend reverses, the first critical support to watch lies at $1,749. A break below that could trigger a move lower toward $1,689.
Losing these levels would signal a much deeper correction, suggesting that the recent attempts at recovery were only temporary before a more prolonged bearish phase sets in.
Ripple’s native token, XRP, has just climbed to the third spot in the global crypto rankings, sitting right behind Bitcoin and Ethereum, with its market cap reaching $164.29 billion. At the same time, popular crypto influencer Alex Cobb has made a bold prediction, saying XRP could hit $22.54 by December 2025.
But what makes him so confident that XRP can reach this level?
Analyst Predicts XRP Price to Hit $22
In his recent post, Cobb used humor to send a serious message. He shared a meme showing XRP skeptics regretting their decision as the coin rises above $22.54. It was a playful way to say something clear, don’t ignore XRP’s potential.
If XRP reaches that price, it would mean a massive 8X jump, or about 767% gain from where it is now. Such a rise could push XRP’s market value to around $1.32 trillion, possibly putting it ahead of Ethereum as the second-largest crypto.
Even veteran trader Peter Brandt, once critical of XRP, now believes it could hit a $502 billion market cap, and some believe it could go even higher.
History of Proving Doubters Wrong
This isn’t the first time XRP has shocked those who doubted it. Between November 2024 and January 2025, XRP surged by 7X, forcing well-known critics to rethink their positions.
Even Davinci Jeremie, a die-hard Bitcoin fan, admitted XRP could climb past $20, recognizing the community’s strong push and Ripple’s progress.
Whales Buying More XRP
Recently, XRP whales have accumulated a massive amount of XRP. Right now, 2,743 wallets each hold over 1 million XRP, the highest number ever. These wallets now control nearly half of all XRP in circulation.
Meanwhile, this big buying wave comes as XRP hit $2.80 after a strong 10% daily jump. The price spike also forced $31 million in short positions to close, catching bearish traders off guard.
After hitting $2.97, XRP pulled back but found support at $2.70. It’s now holding above $2.75. If buyers push it past $2.90 with good volume, XRP could reach $3.20 or higher soon.
The post XRP Could Hit $22 by December 2025? Top Analyst Says Soo! appeared first on Coinpedia Fintech News
Ripple’s native token, XRP, has just climbed to the third spot in the global crypto rankings, sitting right behind Bitcoin and Ethereum, with its market cap reaching $164.29 billion. At the same time, popular crypto influencer Alex Cobb has made a bold prediction, saying XRP could hit $22.54 by December 2025. But what makes him …
Bitcoin slid 0.7% on Sunday, May 4, falling below $96,000 for the first time since midweek. The drop marks a second consecutive day of losses, following a strong institutional-led rally that pushed BTC to a 70-day high of $98,200 on Friday, per Coingecko data.
Despite reclaiming a $2 trillion market capitalization briefly, Bitcoin’s bullish momentum has stalled, coinciding with soft weekend volumes and renewed macro uncertainty.
On a weekly basis, Bitcoin is still up 4.5%, while 30-day performance remains strong at 12.8%, supported by ETF inflows and renewed accumulation from U.S. corporate treasuries.
However, resistance around the $98,000 level has proven tough to break, especially in the absence of clear macro tailwinds.
At the same time, Ethereum’s inability to hold above $1,900 and declining futures trading volume across top exchanges like Binance and CME further confirm the cautious short-term sentiment over the weekend.
DeMark Warns: Bear Market in U.S. Stocks Could Be Imminent
Tom DeMark, creator of the TD Sequential indicator and a trusted technical advisor to major hedge funds, has issued a fresh warning: a U.S. stock market top is imminent and could give way to a full-blown bear market within months.
DeMark, who accurately predicted the February top and April low in the S&P 500, says the index is showing clear signs of exhaustion.
S&P 500 Technical Analysis | DeMark/Market WIT
His analysis highlights that two more closing highs in the S&P 500 would complete a 9-count exhaustion cycle, a historically reliable signal for trend reversals.
Once this occurs, DeMark expects a retracement below 4,835 the intraday low from Aprilrepresenting a 20%+ drop from February’s highs.
“A top is imminent. Too much technical damage has been done,” DeMark said,
He also, added that the market remains vulnerable to improvement in global trade outlook or liquidity conditions.
What’s Next: Will DeMark’s Prediction Derail Bitcoin’s $100K Target?
Bitcoin price correlation to traditional markets, especially the S&P 500, has become increasingly relevant in the current macro environment.
On February 19, when China imposed retaliatory tariffs and global markets dipped, Bitcoin’s correlation to the S&P 500 fell to a yearly low of 0.27%. At the time, BTC acted as a partial hedge, decoupling from equities.
Bitcoin vs S&P 500 Price Correlation
However, President Donald Trump’s softening stance on tariffs and aggressiv push for rate cuts, have boosted broader market sentiment in recent weeks.
As a result, the BTC/S&P 500 correlation has surged, reaching 0.82% at press time.
This implies that Bitcoin may now respond more directly to U.S. equity moves than earlier this year.
If the market correction predicted by DeMark is driven by geopolitical tensions or inflationary trade tariffs, Bitcoin could attract safe-haven flows and maintain upward momentum.
Historical data shows BTC often benefits from global instability and monetary easing.
On the other hand, if the S&P 500’s decline stems from systemic risk such as a recession, financial contagion, or an energy shock.
Bitcoin may not be spared. In such scenarios, investors typically flee risk assets broadly, and BTC could experience significant drawdowns.
Conclusion: Bitcoin’s $100K Outlook Hinges on Crash Catalyst
Bitcoin’s $100K target and sustained $2 trillion market cap remain within reach, but macro risks are now front and center.
Whether Tom DeMark’s bear market call derails the BTC rally will largely depend on what drives the next wave of equity losses.
If it’s policy or trade-related, Bitcoin may rally as a hedge. But if the downturn it triggered by deep economic stress, recession or energy crisis, Bitcoin price could fall with the pack, as Demark predicts