SEC disclosure documents revealed that Harvard University had invested over $116.6 million in to IBIT, BlackRock’s Bitcoin ETF, in Q2 2025. IBIT was its fifth-largest portfolio investment, surpassing Google’s parent company.
This news is quite unexpected, and it’s still unclear when Harvard made this investment. The university has significant shares in a wide range of tech firms, but IBIT is apparently its only Web3 commitment.
Harvard’s Surprise Bitcoin ETF Purchase
Harvard, one of the world’s most prestigious universities, has occasionally appeared in the crypto industry, but most of its interactions have been tangential.
Social media reports first suggested that Harvard put $120 million into BlackRock’s Bitcoin ETF, but this was slightly garbled. In actuality, it was $116.6 million.
This revelation came from SEC documents detailing the university’s investment portfolio at the end of Q2 2025.
Still, Harvard has evidently put a lot of faith in the Bitcoin ETF. It’s the university’s fifth-largest portfolio investment right now, outpaced by Meta, Microsoft, Amazon, and Booking Holdings Inc.
This figure doesn’t include other asset categories like real estate. Amazingly, Harvard allocated roughly $3 million more into IBIT than Alphabet, Google’s parent company.
Its portfolio includes other tech and crypto-adjacent stocks, like $104.4 million in NVIDIA, but IBIT remains Harvard’s only direct Web3 exposure.
Harvard’s unexpected purchase could increase IBIT’s public notoriety. July was a bad month for BTC ETFs, with BlackRock’s Ethereum ETF surpassing IBIT in terms of weekly inflows. If an establishment pillar like Harvard is interested regardless, that could represent a signal of confidence.
TAO, the altcoin that powers Bittensor’s decentralized machine learning network, has soared 10% in the past 24 hours. It has outperformed major cryptocurrencies like Bitcoin (BTC), which has seen a modest gain of 0.13%, and Ethereum (ETH), whose value has dipped by 1.3% over the past day.
With technical indicators hinting at growing bullish pressure, TAO could extend its double-digit rally in the short term.
TAO Flashes Bullish Signal
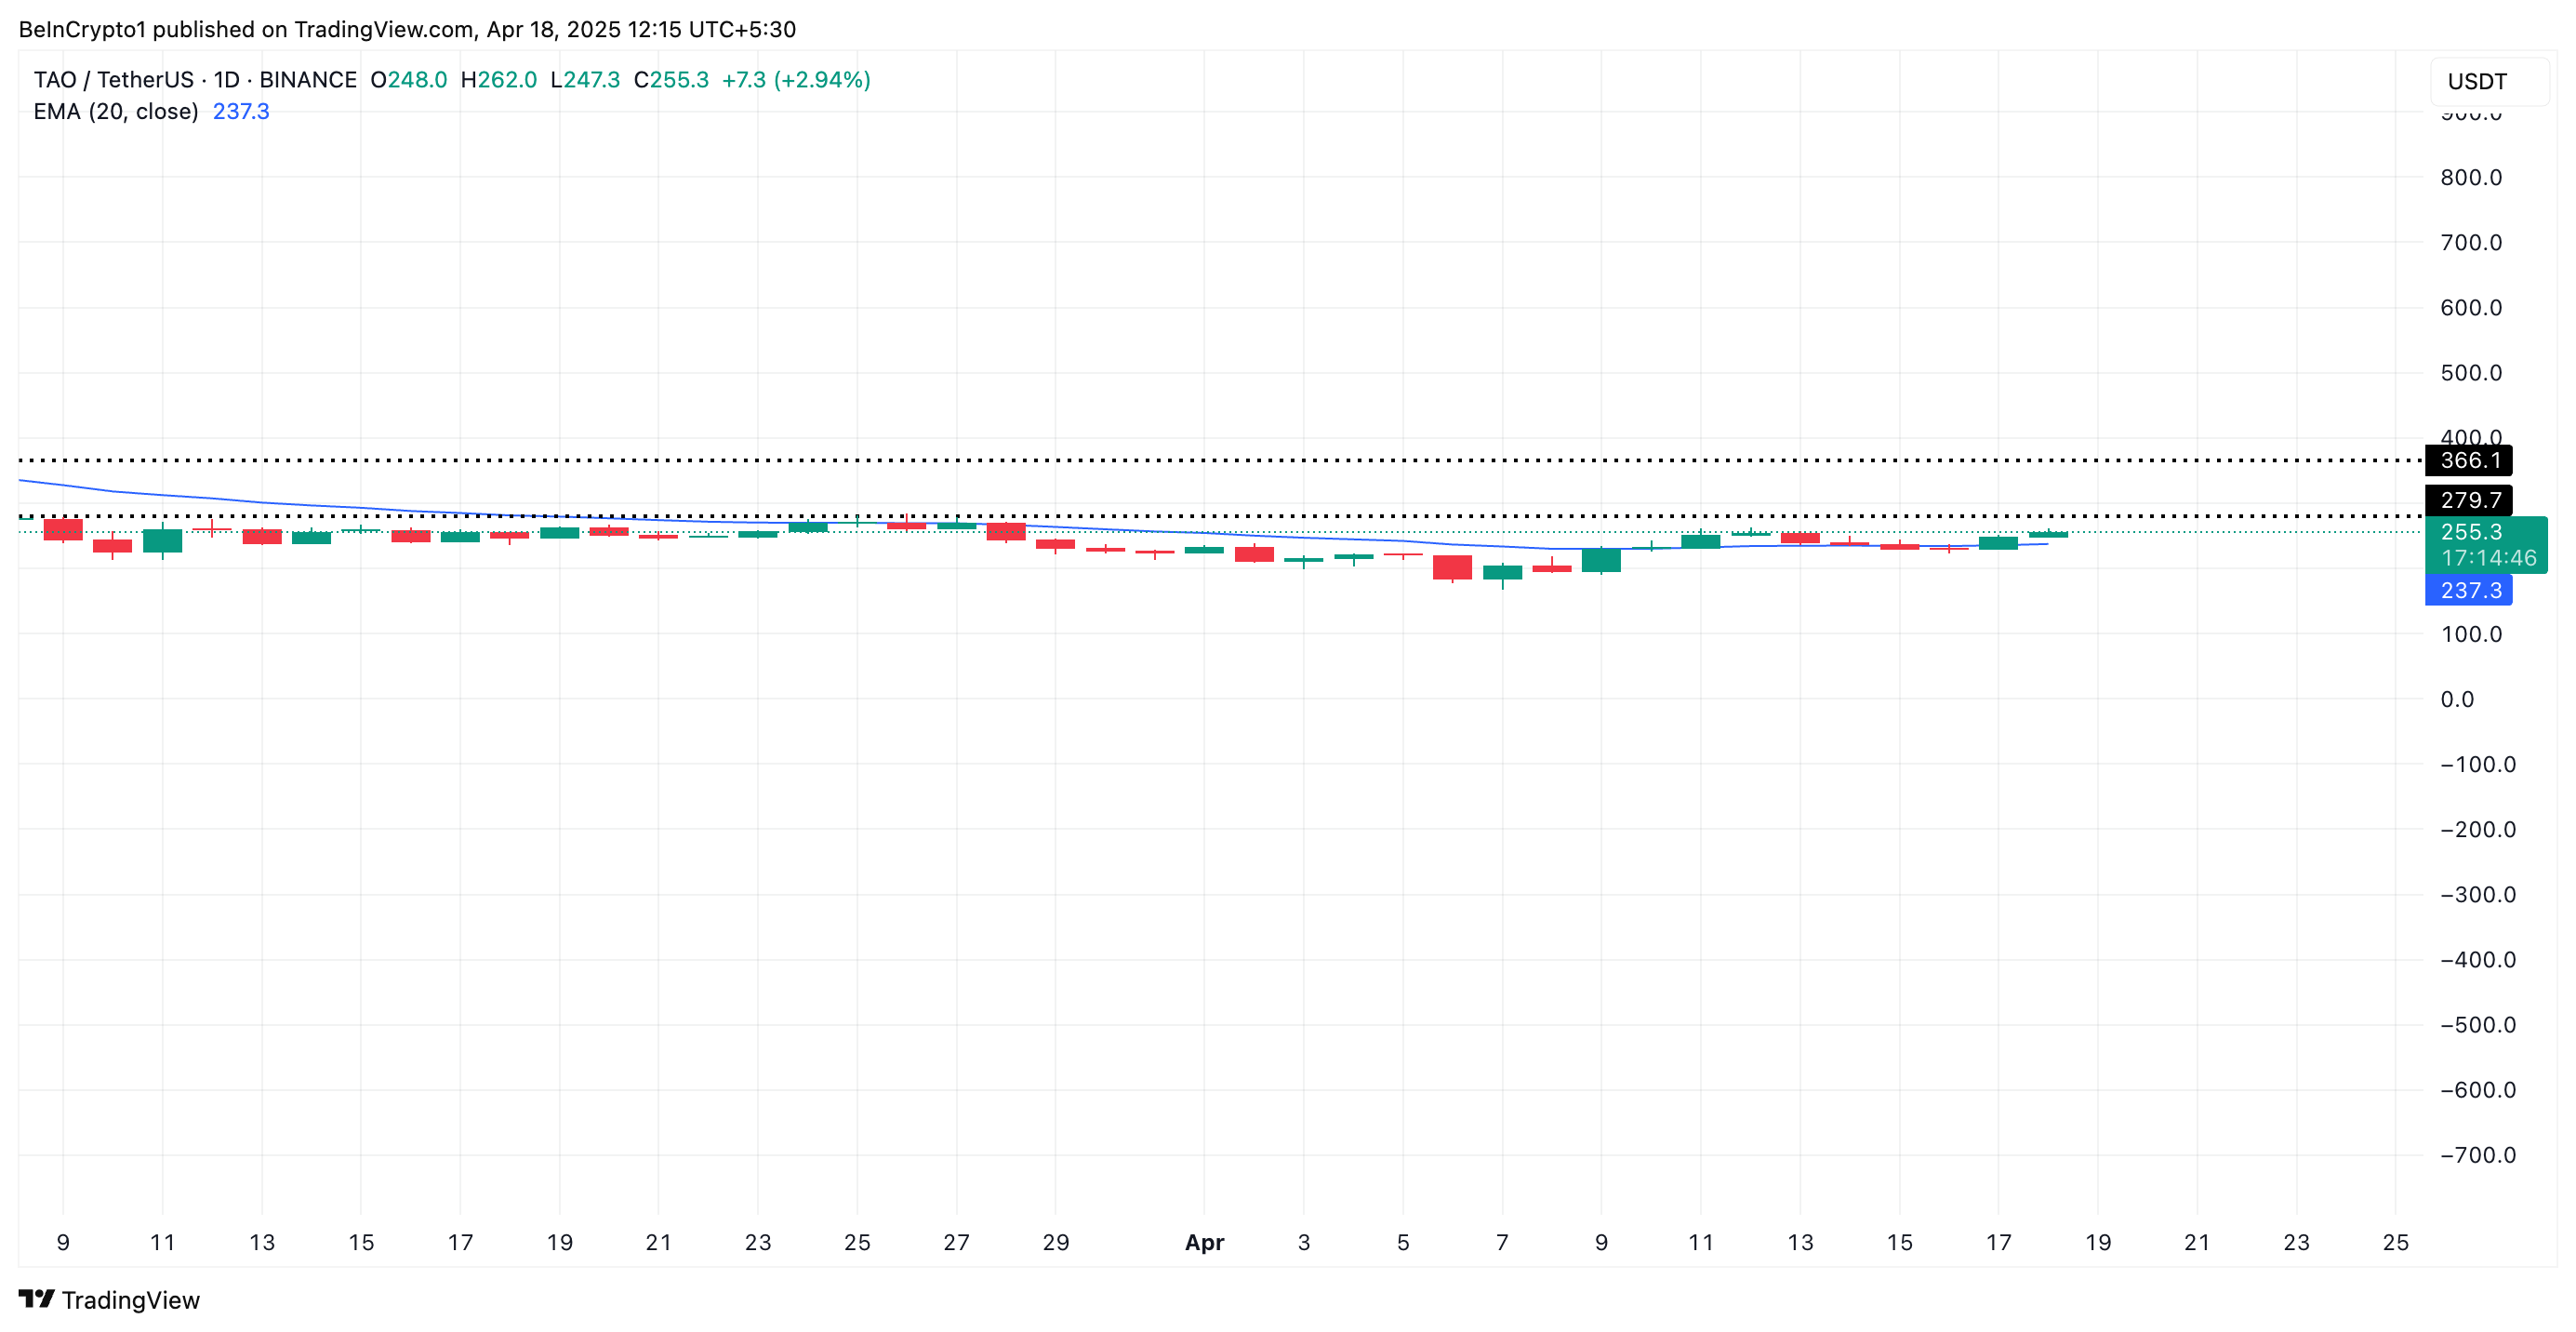
TAO’s price has broken above its 20-day Exponential Moving Average (EMA), an indicator that suggests a strong bullish trend in its spot market.
The 20-day EMA measures an asset’s average price over the past 20 trading days, giving more weight to recent prices. When an asset’s price breaks above this key moving average, it signals a shift in momentum toward a bullish trend. Traders view it as a short-term signal that the asset may continue to rise.
This crossover confirms TAO’s growing buying pressure and renewed investor confidence. It also hints at a sustained price rally as long as the 20-day EMA remains below the token’s price, to offer a dynamic support floor against any significant price dips.
Additionally, the altcoin’s rising Relative Strength Index (RSI) further supports the demand spike, reinforcing the likelihood that TAO’s upward trend could continue. At press time, this is at 54.86.
This indicator ranges between 0 and 100. Values above 70 suggest that the asset is overbought and due for a price decline, while values under 30 indicate that the asset is oversold and may witness a rebound
TAO’s RSI confirms that bullish momentum is building gradually. It indicates growing buying interest, with room for further upside before reaching overbought conditions above 70.
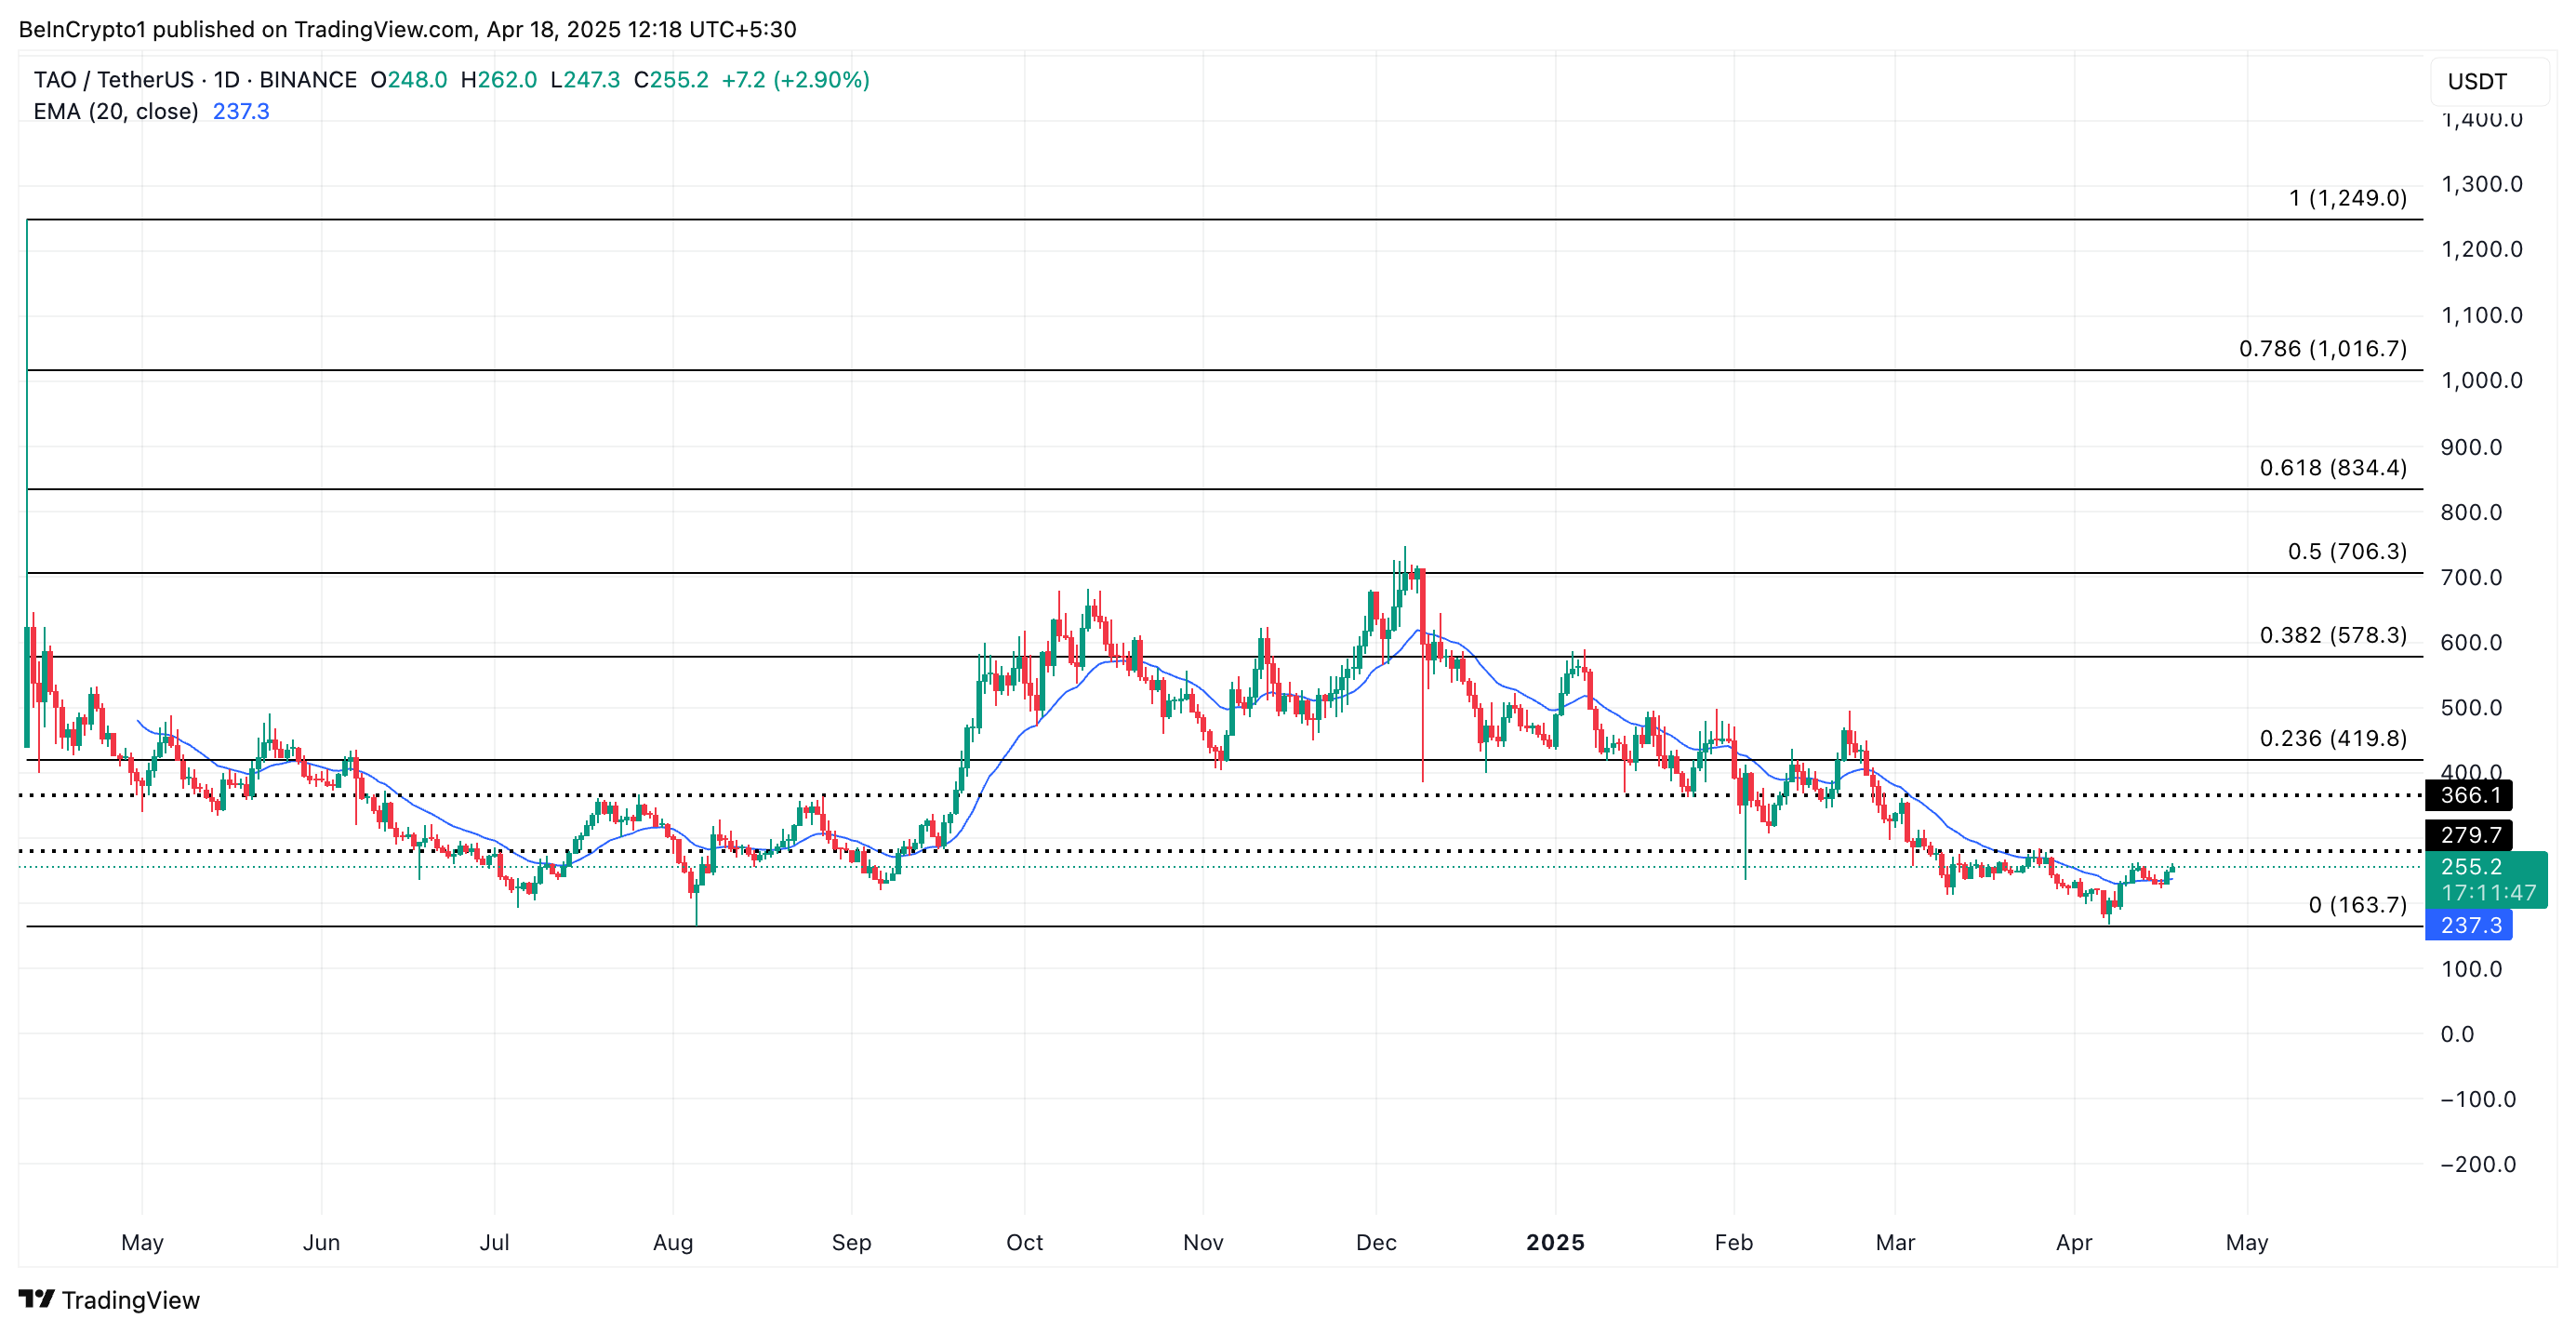
TAO Eyes $279.70 Breakout as Bullish Momentum Builds
TAO currently trades at $255.20. With strengthening bullish pressure, the altcoin could extend its gains and break above $279.70, its next major resistance level. A successful breach of this price spot could propel TAO’s price to $366.10.
However, a spike in profit-taking activity will invalidate this bullish outlook. If demand wanes and TAO sellers regain market control, they could force the token’s price below its 20-day EMA, which forms dynamic support at $237.30.
If this happens, the TAO token price could fall further to $163.70.
Bitcoin (BTC) is facing a mix of bullish signals and short-term uncertainty. Moody’s recent downgrade of the US credit rating has heightened long-term bullish sentiment around BTC, reinforcing its role as a hedge against rising debt and fiscal uncertainty.
Meanwhile, on-chain data shows a declining supply of Bitcoin on exchanges, suggesting investors are leaning toward holding rather than selling. Despite these bullish fundamentals, BTC remains in a short-term consolidation phase, with price action needing fresh momentum to break higher.
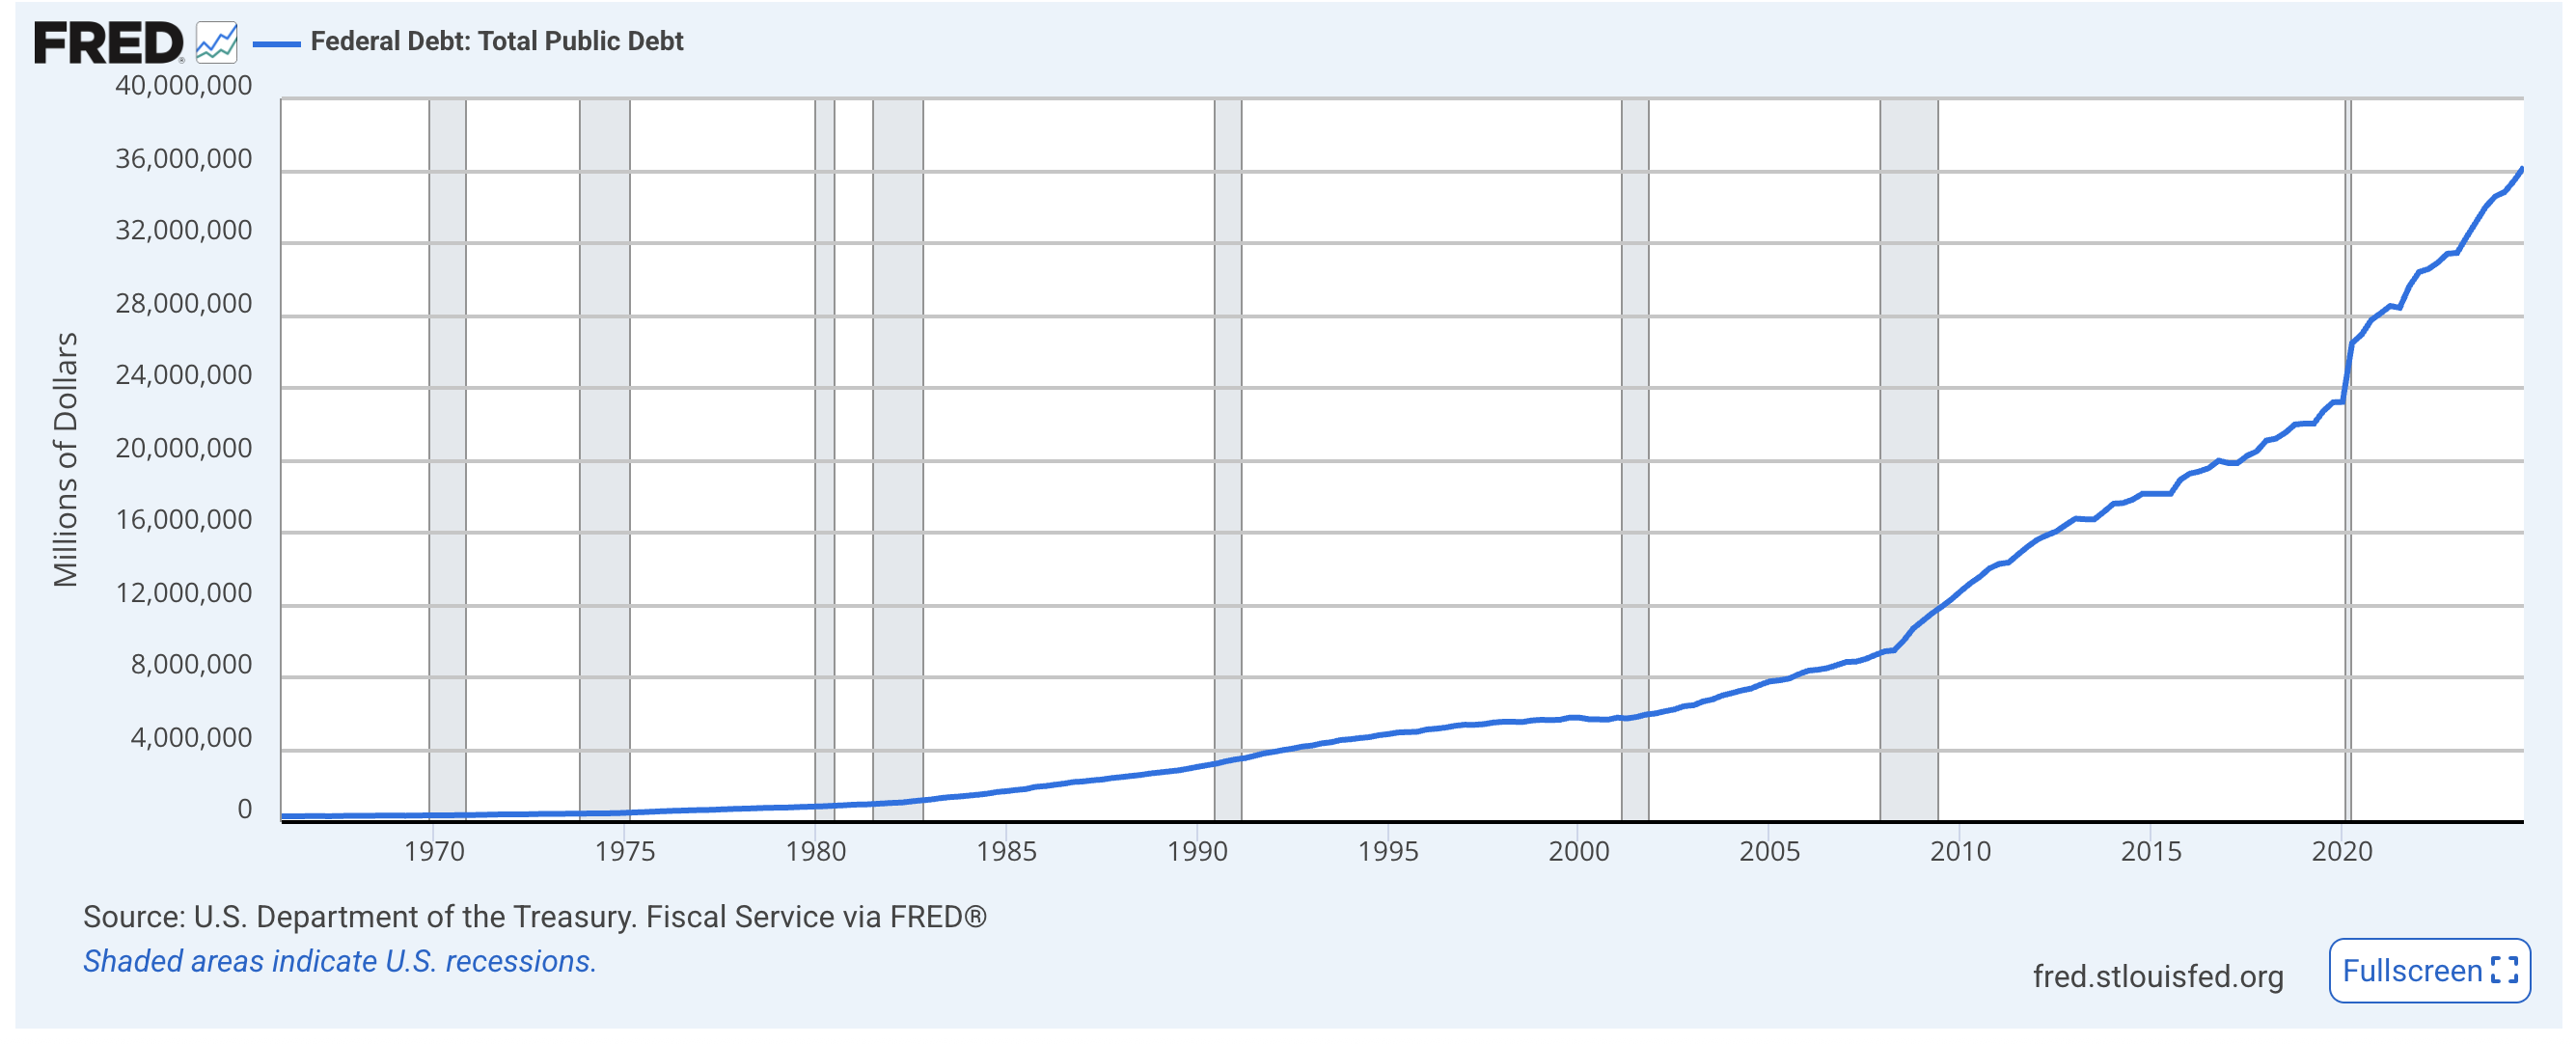
Moody’s Downgrade Ends US Century-Long Perfect Credit Rating Streak
Moody’s has downgraded the US credit rating from Aaa to Aa1, removing the country’s last perfect score among major credit agencies.
It’s the first time in over a century that the US lacks a top-tier rating from all three, following downgrades by S&P in 2011 and Fitch in 2023. Rising deficits, mounting interest costs, and the absence of credible fiscal reforms drove the decision.
Markets reacted quickly—Treasury yields climbed, and equity futures slipped. The White House dismissed the downgrade as politically driven, with lawmakers still negotiating a $3.8 trillion tax and spending package.
Moody’s also warned that extending Trump-era tax cuts could deepen deficits, pushing them toward 9% of GDP by 2035—a scenario that may strengthen the appeal of crypto, especially Bitcoin, as a hedge against long-term fiscal instability.
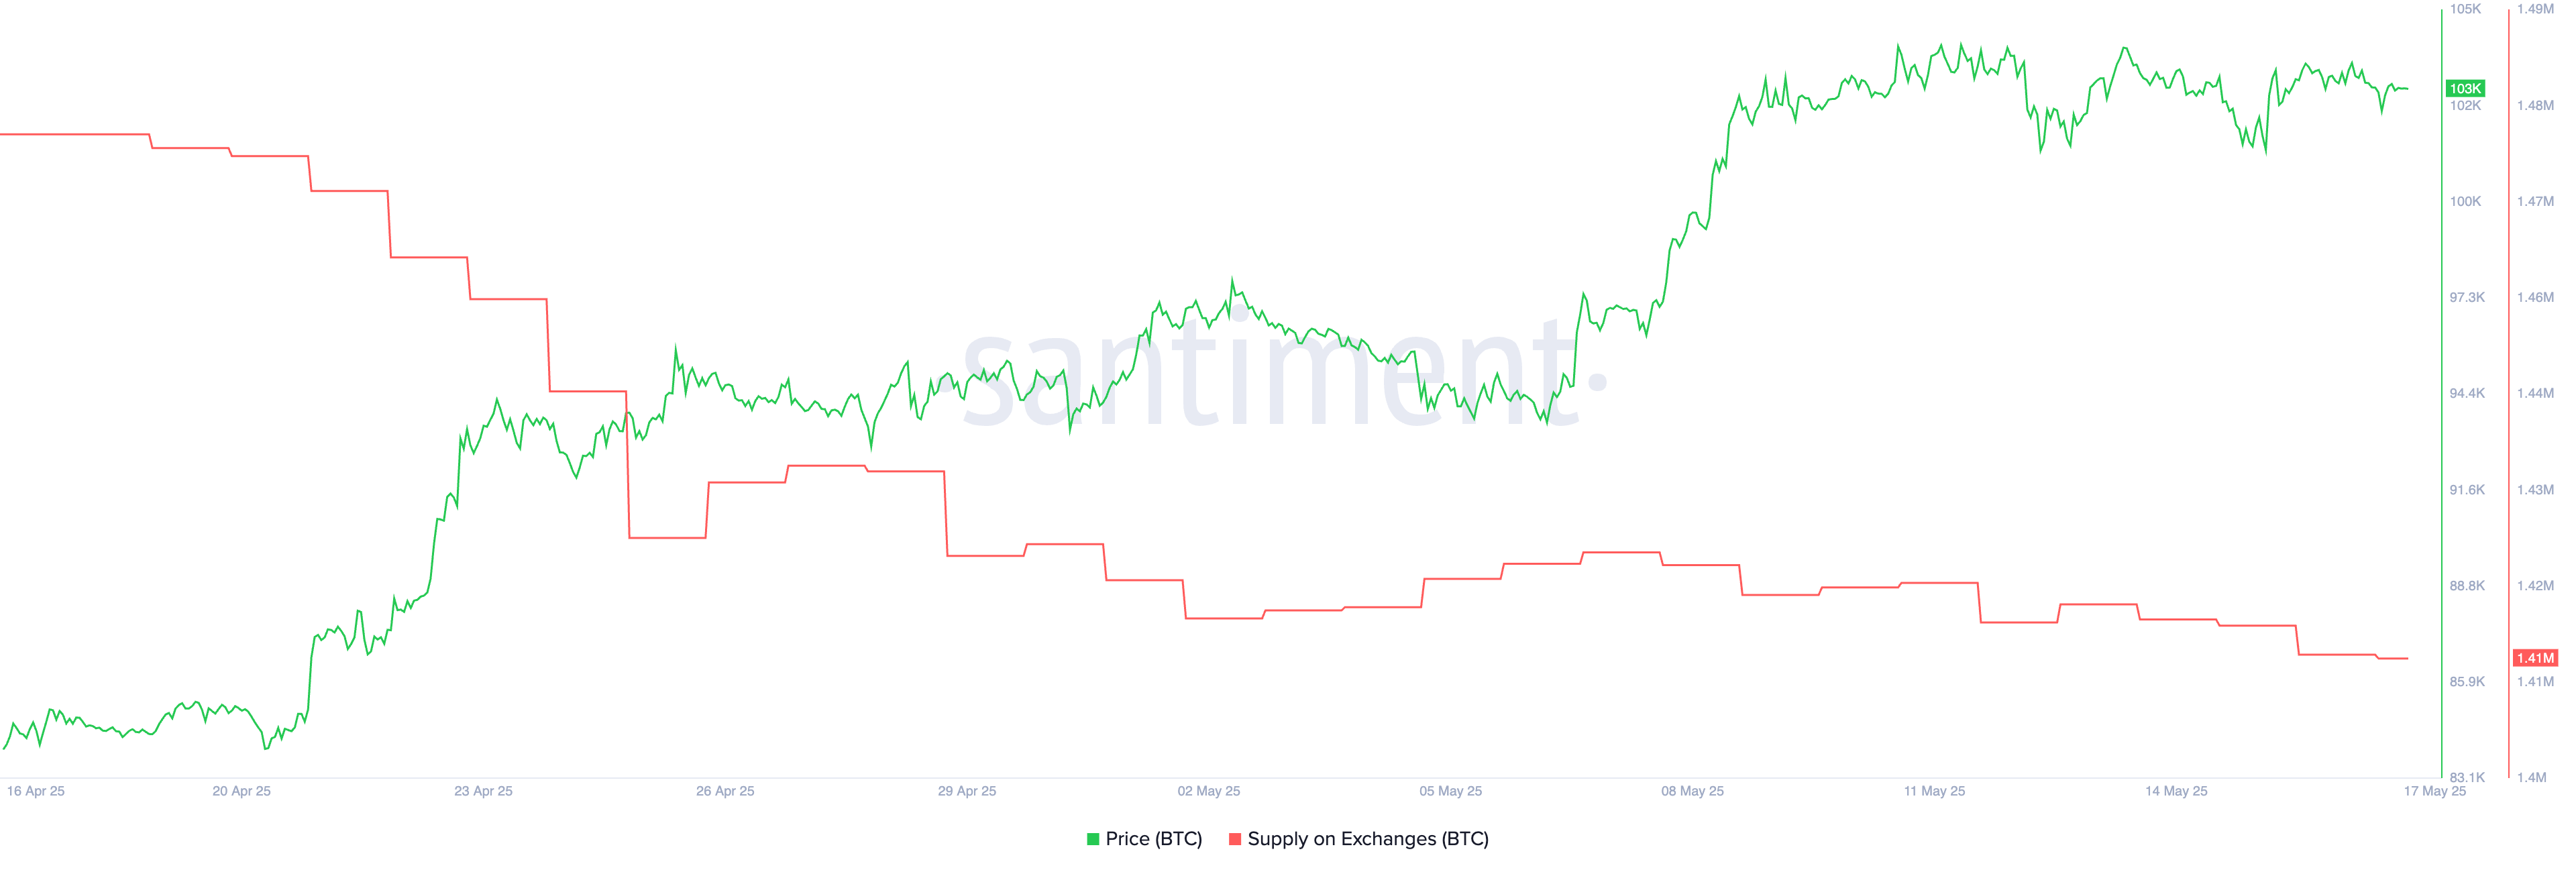
After briefly rising from 1.42 million to 1.43 million between May 2 and May 7, Bitcoin’s supply on exchanges is falling once again.
This short uptick followed a more significant decline between April 17 and May 2, when the exchange supply dropped from 1.47 million to 1.42 million. Now, the metric has resumed its downward trend, currently sitting at 1.41 million BTC.
The supply of Bitcoin on exchanges is a key market indicator. When more BTC is held on exchanges, it often signals potential selling pressure, which can be bearish.
Conversely, a decline in exchange balances suggests holders are moving their coins to cold storage, reducing near-term sell pressure—a bullish signal. The current drop reinforces the idea that investors may be preparing to hold rather than sell.
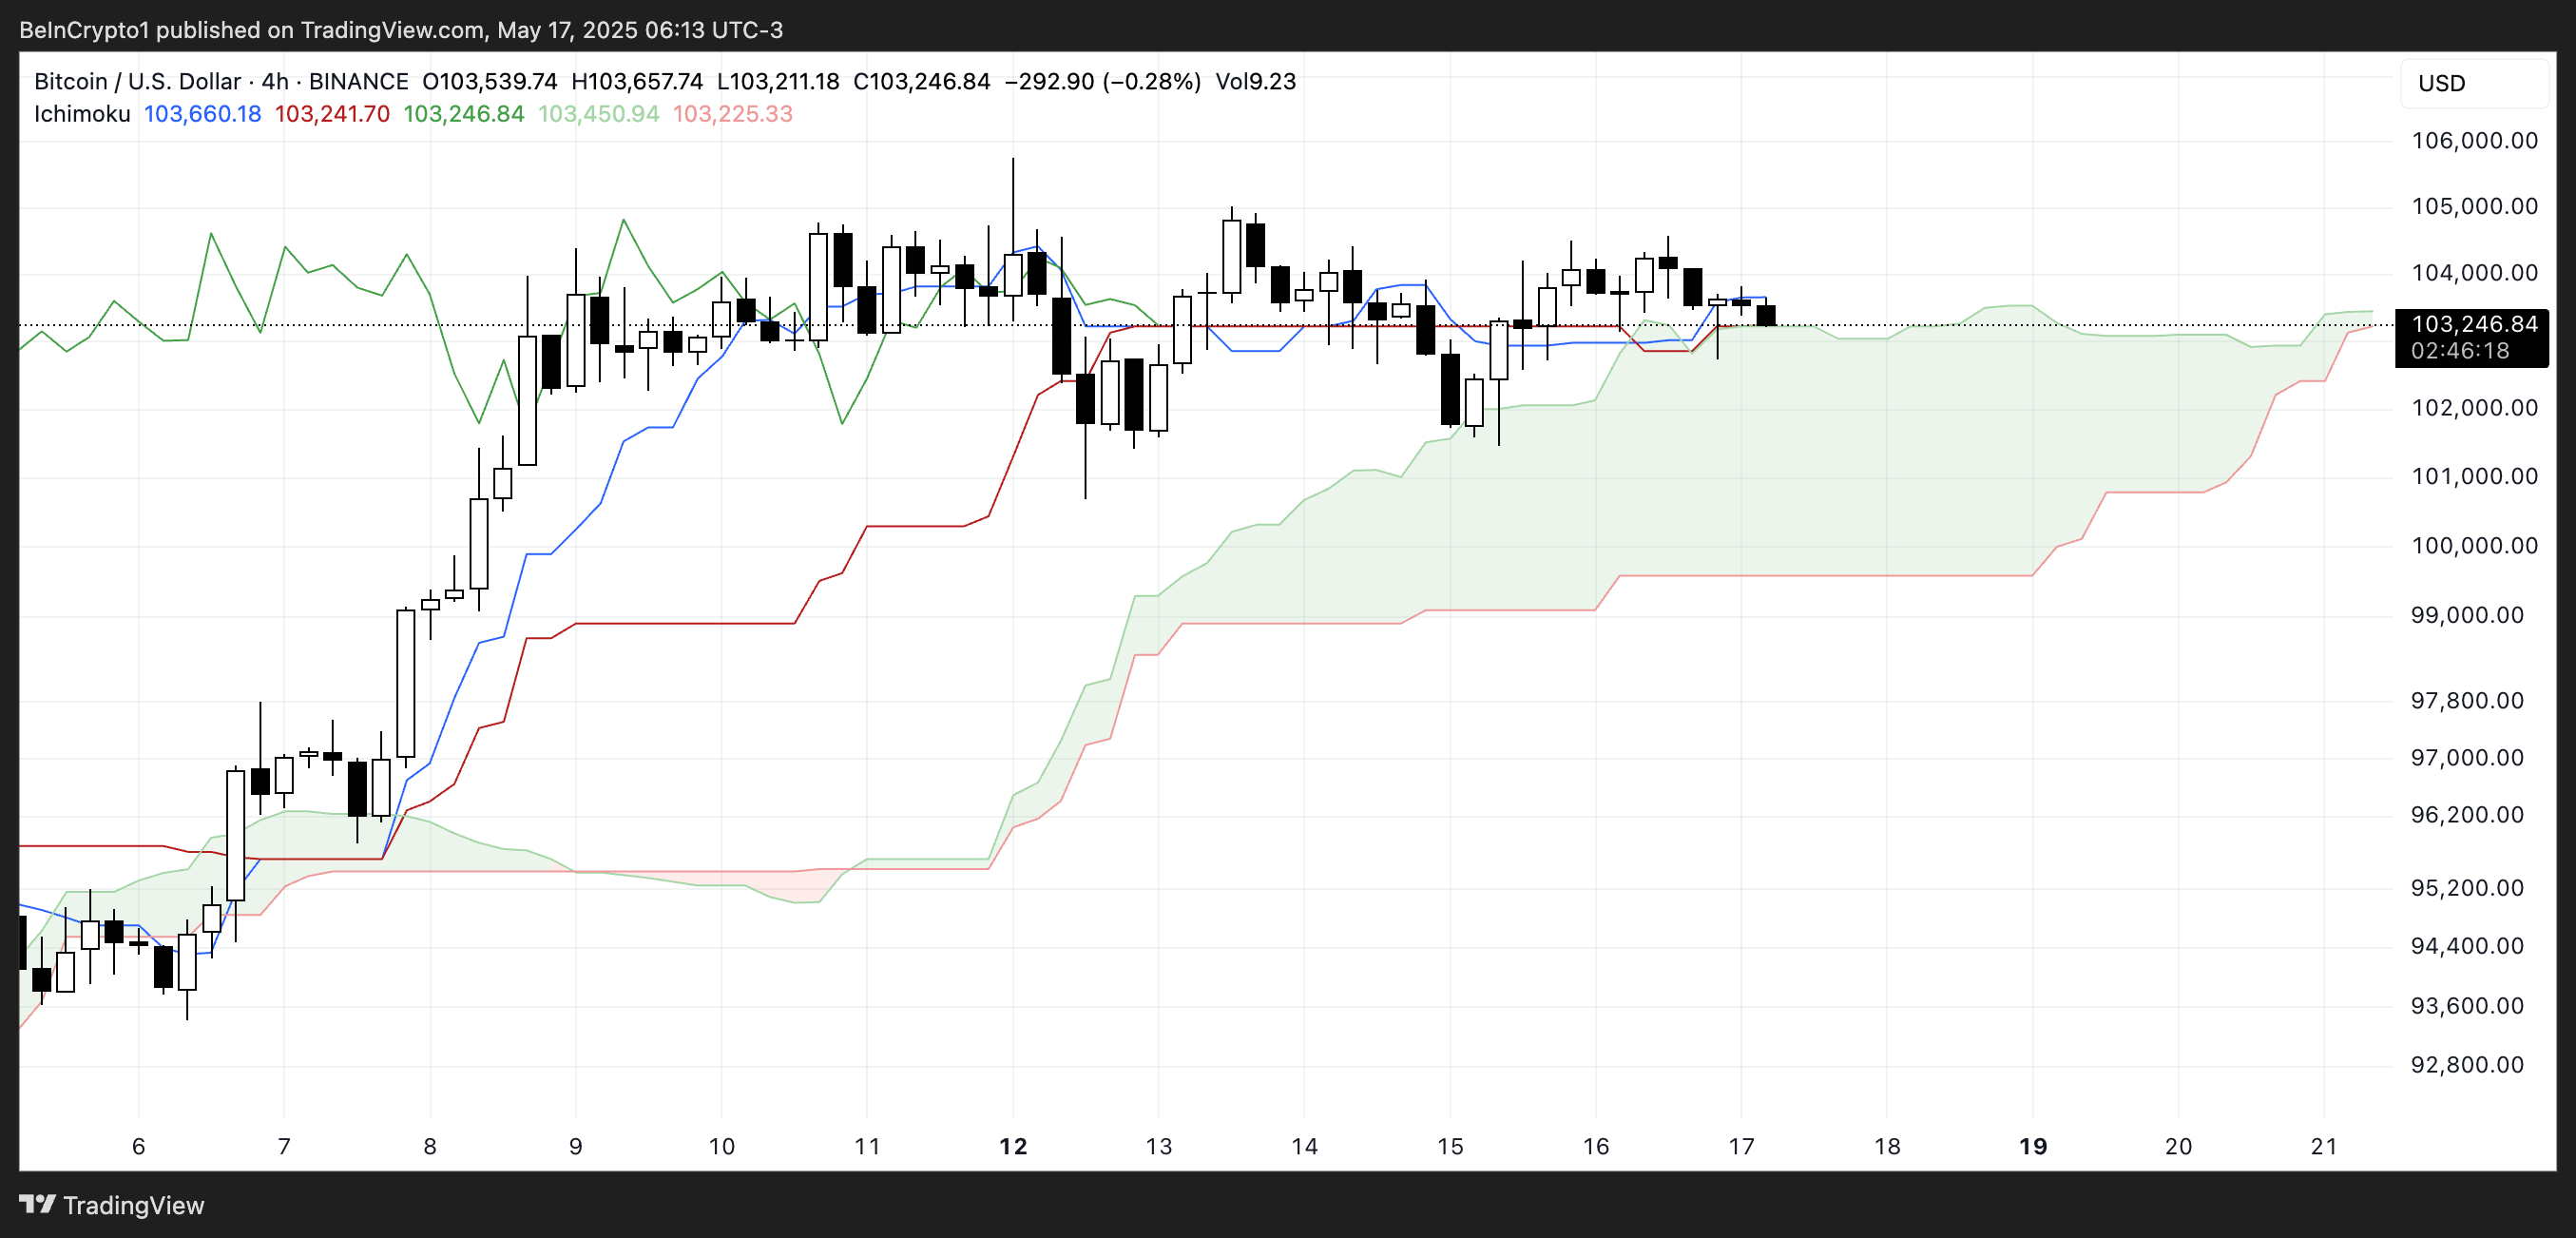
The Ichimoku Cloud chart for Bitcoin shows a period of consolidation with neutral-to-slightly-bearish signals. The price is currently sitting right around the flat Kijun-sen (red line), indicating a lack of strong momentum in either direction.
The Tenkan-sen (blue line) is also flat and closely tracking the price, reinforcing this sideways movement and short-term indecision.
The Senkou Span A and B lines (which form the green cloud) are also relatively flat, suggesting equilibrium in the market. The price is moving near the top edge of the cloud, which typically acts as support. However, since the cloud is not expanding and has a flat structure, there is no strong trend confirmation at the moment.
The Chikou Span (green lagging line) is slightly above the price candles, hinting at mild bullish bias, but overall, the chart signals indecision and the need for a breakout to confirm the next direction.
Moody’s Downgrade Strengthens Bitcoin’s Long-Term Bull Case Amid Short-Term Consolidation
While it may not trigger immediate price action, the downgrade reinforces the narrative of growing fiscal instability and debt concerns—conditions that strengthen Bitcoin’s appeal as a decentralized, hard-capped asset.
In the medium to long term, more investors may turn to BTC as a hedge against sovereign risk and weakening trust in traditional financial systems.
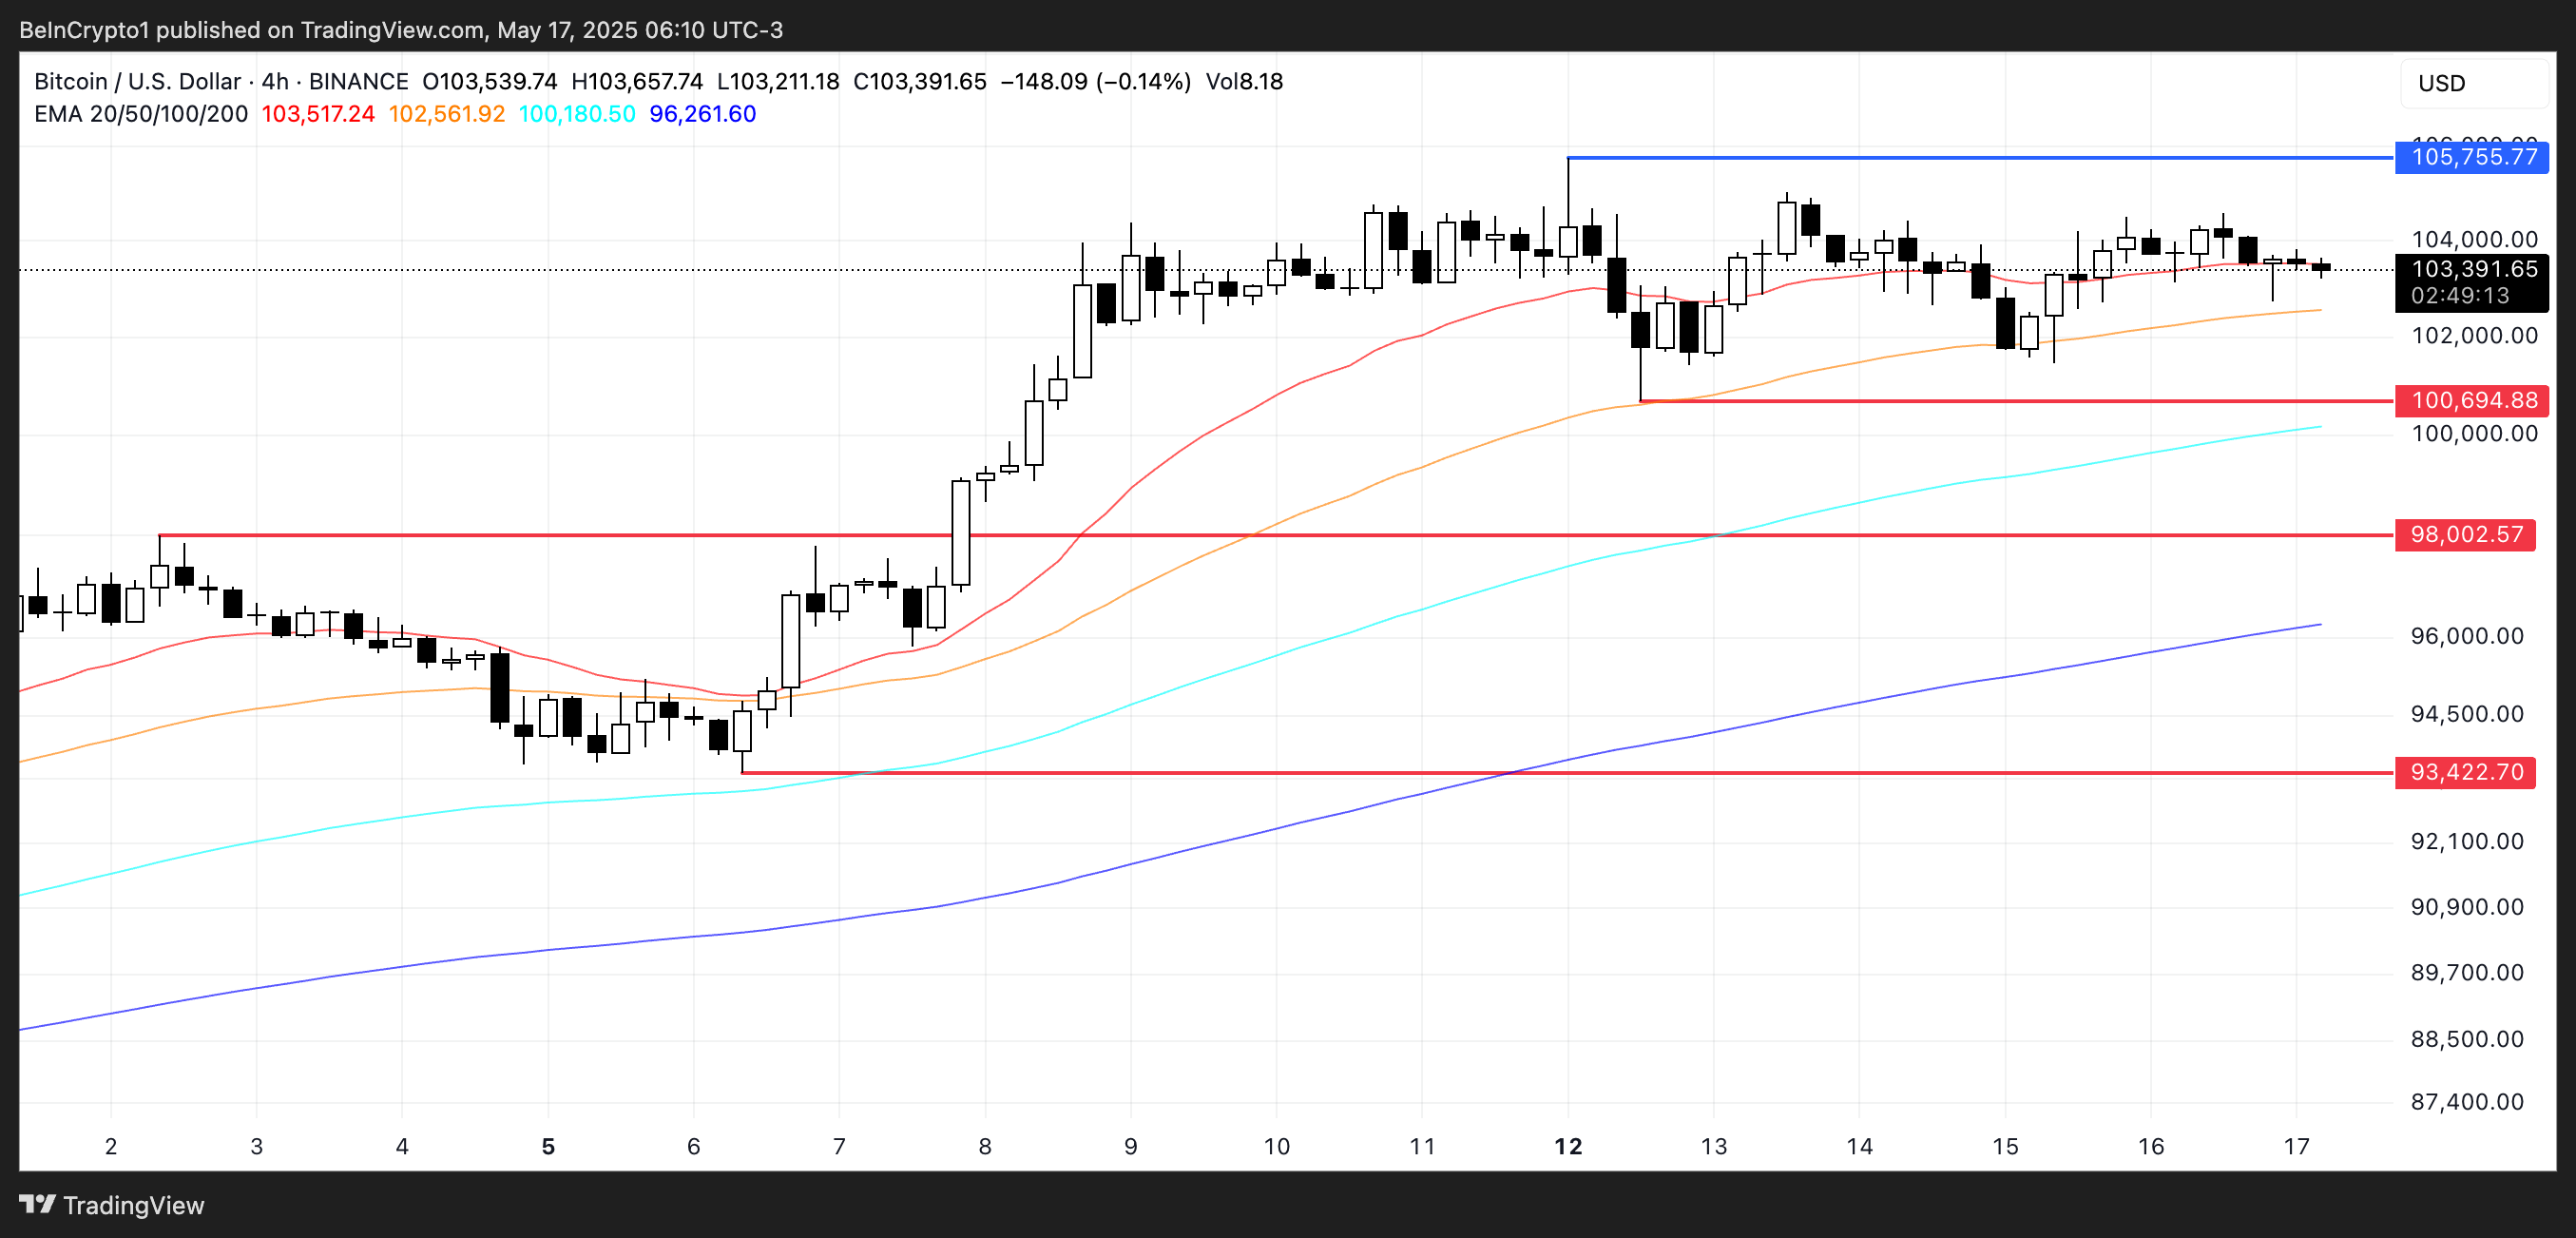
In the short term, however, Bitcoin price remains in a consolidation phase after breaking above $100,000. Its EMA lines are still bullish, with shorter-term averages above longer-term ones, but they are flattening out.
For bullish momentum to resume, BTC would need to push past the $105,755 resistance.
On the downside, holding above the $100,694 support is crucial—losing it could open the door for declines toward $98,002 and potentially $93,422.