As companies race to innovate with quantum computing, Elon Musk has probed Bitcoin’s safety in the near term from emerging risks. Musk’s AI chatbot Grok disclosed that Bitcoin will remain impervious to quantum computing threats till the end of the decade. Quantum Computing Will Not Crack Bitcoin In This Decade World’s richest man Elon Musk
XRP price has reversed from its recent multi-week high of $2.30 to trade at $2.18 at press time. Despite this slip, Ripple still eyes gains past $3 after the first spot XRP ETF offered by Teucrium amassed over $40M in net assets, barely a month after launching. The ETF’s success comes after Teucrium’s CEO told Bloomberg that XRP has the most utility among other crypto coins.
XRP Price Eyes Further Gains Amid ETF Success
According to the Teucrium website, the 2x Long Daily XRP ETF has amassed more than $40M in net assets. This is a commendable milestone considering that the product launched on April 8 and has been trading for less than three weeks.
Teucrium’s XXRP leveraged product is the first XRP ETF to launch in the US, and the amount of interest it is amassing from investors despite ongoing market anxiety is a bullish sign for the Ripple price and could aid a breakout past the key resistance hurdle of $2.20 to all-time highs.
At the same time, Teucrium’s CEO appeared in an interview with Bloomberg, stating that XRP has the most utility in the crypto industry. He opined that Ripple has amassed utility across payments, tokenization, and most recently, brokerage services after the acquisition of Hidden Road.
Besides institutions, whales are also rapidly accumulating XRP and possibly positioning themselves for further gains. Data from Santiment shows that as XRP price broke out to multi-week highs, the addresses holding between 1M and 100M Ripple purchased 260M tokens.
XRP Whale Balances
The high interest from whales and institutions shows a bullish outlook towards XRP value today and confidence among traders that the altcoin will extend its gains and smash the $3 price level to create a new record high in the coming months.
Ripple Teases Breakout From Channel Pattern
After forming a series of lower lows in the last three months, the XRP price is now teasing a breakout from a descending parallel channel, to form a higher low. This breakout will be confirmed if Ripple can make a decisive close above resistance at the upper trendline.
The first resistance level that XRP price needs to overcome if this breakout happens is $2.75. If it flips this level, the uptrend will continue past $3 towards the next hurdle of $3.29. Clearing this hurdle will unlock the rally to all-time highs.
However, traders should take note of the RSI movements, which currently show that the recent buying pressure that pushed Ripple to $2.30 is weakening. The RSI needs to recover and continue rising for a strong upward momentum. The uptrend will also occur if the MACD line crosses above the zero line.
XRP/USDT: 1-day Chart
This bullish XRP price forecast will be invalidated if the RSI falls back below 50, and the MACD rise turns out to be a fake breakout. An extension of the downtrend will happen if the XRP price falls below support at $2.05.
Considering the high institutional interest towards Teucrium’s XRP ETF and whale accumulation, it is likely that Ripple resumes its recent uptrend. However, traders booking profits after the recent rally might stall the uptrend.
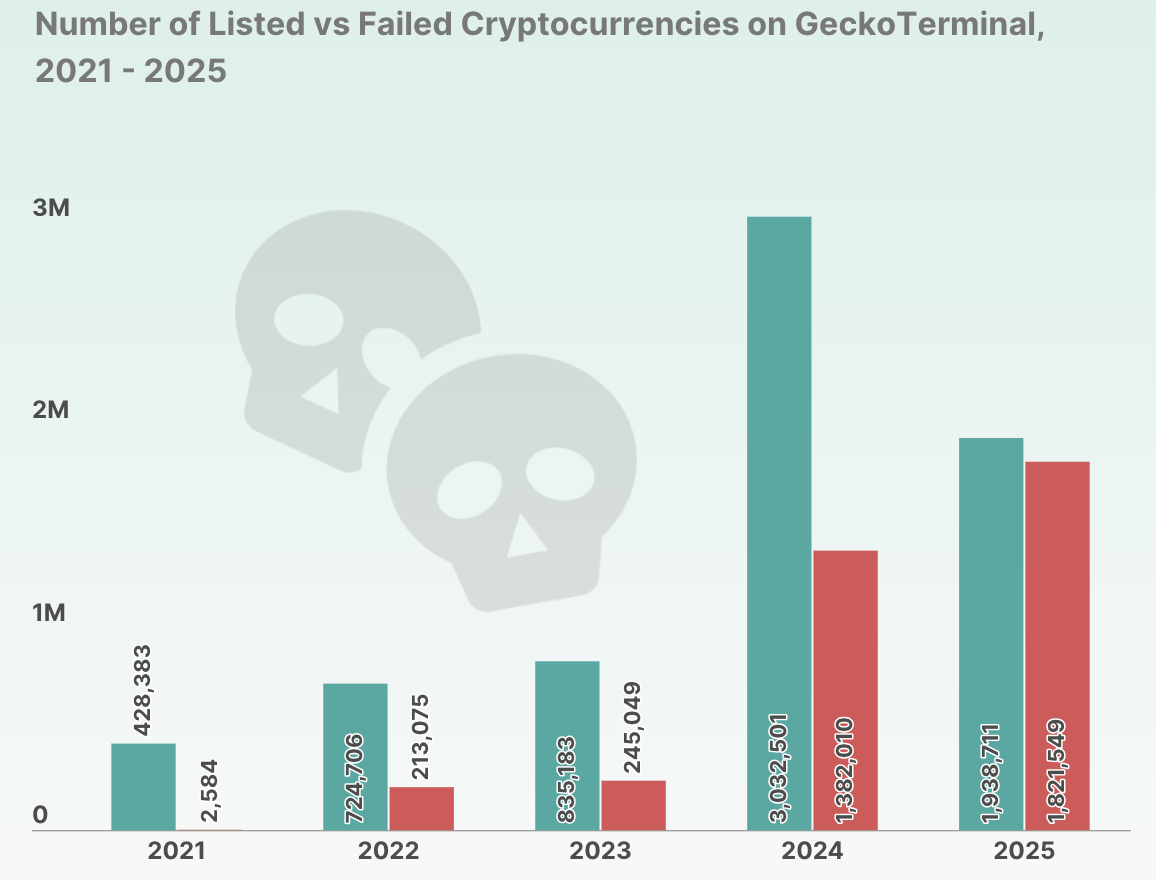
A new report from CoinGecko claims that 2025 has been the worst year for dead crypto projects, with 1.8 million tokens collapsing in Q1 alone. This represents 49.7% of all crypto project failures from 2021 to 2025.
CoinGecko’s analysis focused on the concrete data, not establishing proof of the culprit. Still, it hypothesizes that market volatility under Trump’s Presidency is responsible for this extreme failure rate.
CoinGecko’s latest report shows that 2025 has been an exceptional year in this respect. Compared to 2024, there have been fewer token launches and many more crypto project failures in Q1 alone.
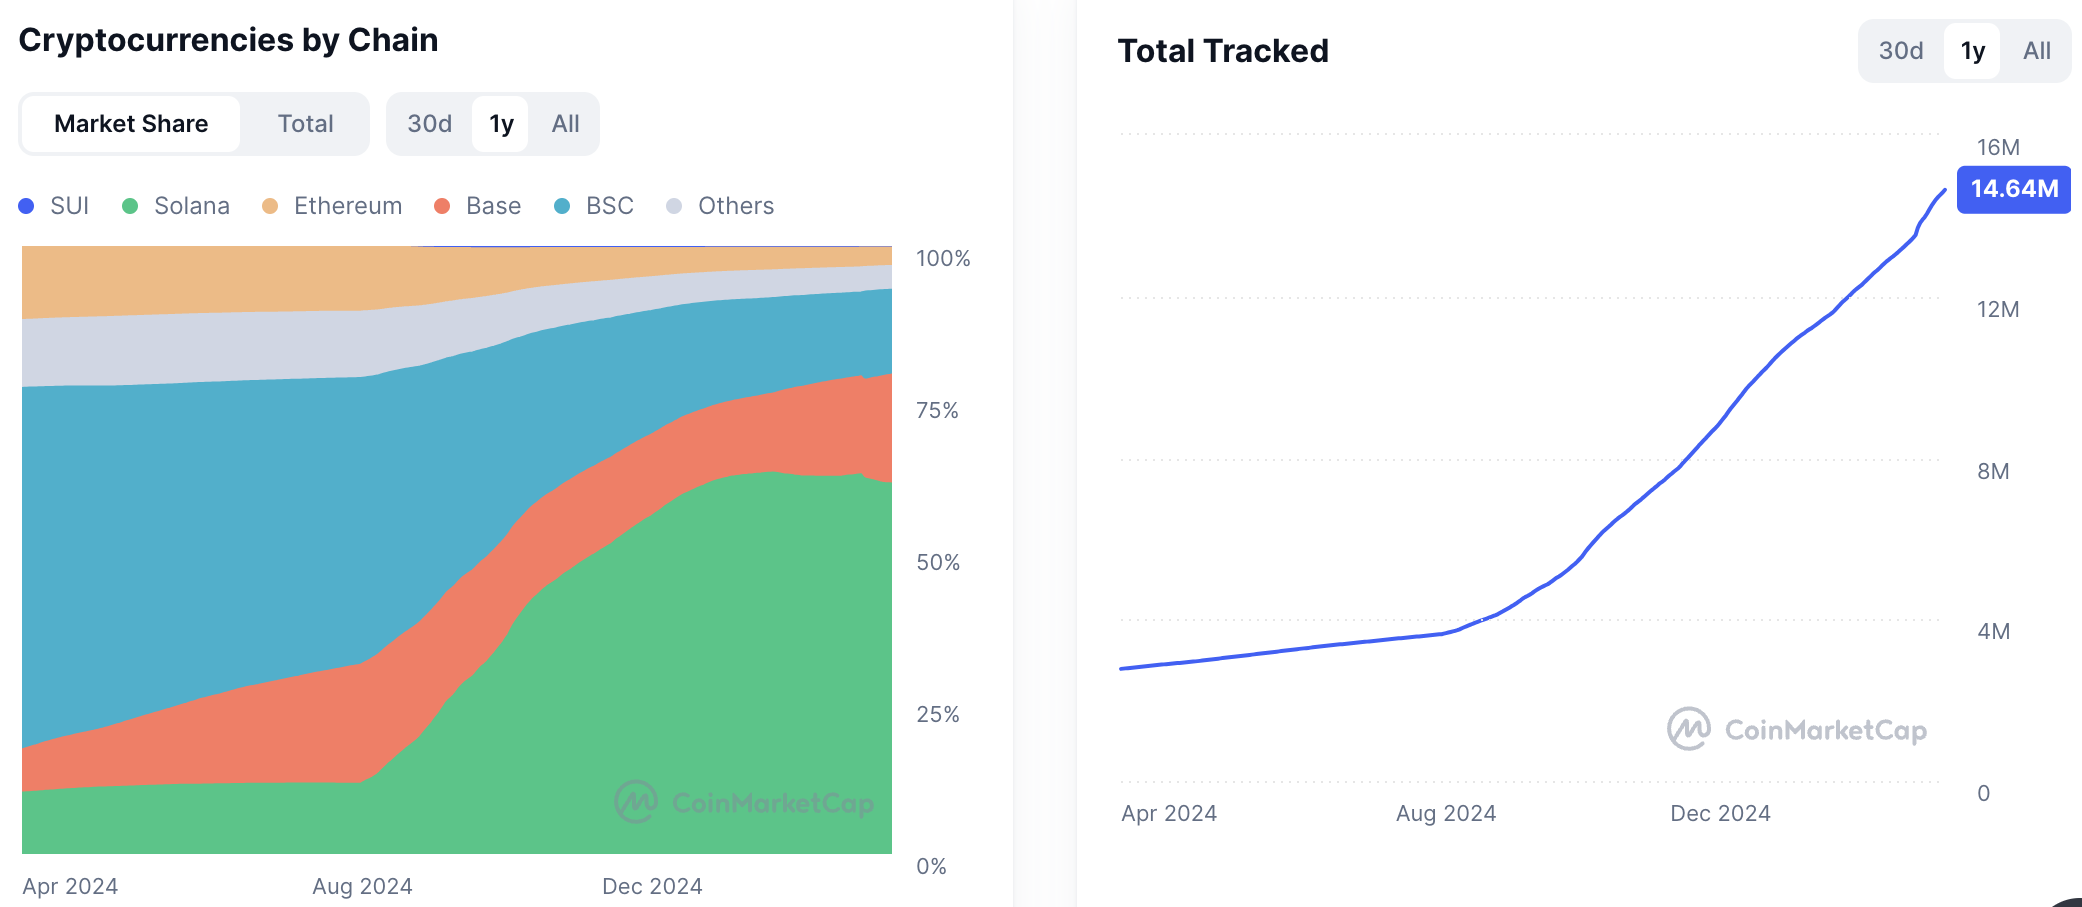
Data from CoinMarketCap shows that over 14.65 million different tokens are active right now, and the number has been rising steadily.
One year ago, the site only tracked 2.7 million. The biggest contributor to this growth has been Solana meme coins, as that blockchain’s ecosystem now accounts for more than 60% of all tokens.
Solana Meme Coins on the Rise. Source: CoinMarketCap
Moreover, a glut of project launches can dilute meme coins’ overall market potential, sinking prominent projects due to quality fears and diminishing returns.
CoinGecko also revealed another disturbing fact: by its reckoning, most crypto projects active since 2021 are now dead. It claims that 52.7% of all such tokens have failed and that the failure rate is increasing.
New launches still outweigh collapses, but the trend does not look sustainable.
The report proposes a clear hypothesis for this behavior. CoinGecko believes it credible that Trump’s tariff threats and ensuing recession fears are responsible for these dead crypto projects. Meme coin launches rose dramatically after his election, and market turbulence is killing them off.
To be clear, CoinGecko’s study did not attempt to prove a cause; it just analyzed the failures themselves. Complicated factors may be creating all these dead crypto projects.
Still, it identified the trends, and the hard data is convincing in its own right. The meme coin industry, as currently defined, may not last at this rate.
Ethereum price declined 8% in the last 24-hours, plunging below the $2,100 as as US Non-Farm Payroll (NFP) data introduces fresh volatility. The market reaction has kept ETH pinned below $2,142, struggling to establish a bullish recovery as sellers remain in control.
Ethereum price dropped below $2,100 on Friday, amid inflation readings in US NFP
Ethereum’s price decline below $2,100 on Friday underscores bearish dominance, exacerbated by heightened macroeconomic uncertainty stemming from the latest US NFP report. The payroll data, which came in hotter than expected, showing rising unemployment which raised concerns over persistent inflation, strengthening the case for a hawkish Federal Reserve stance.
Ethereum Price Analysis: 4-hourly Chart
Bears eyeing $2,000 on 4-Hour Chart
Ethereum price remains under downward pressure on the 4-hour chart after failing to break past the $2,319 resistance level. The rejection at this key price ceiling has reinforced bearish momentum, with the latest candlesticks showing increased selling pressure near the $2,156 pivot. A confluence of technical indicators signals potential downside risk toward the $2,000 psychological support level.
The Donchian Channel (DC) highlights the recent price contraction, with the upper boundary at $2,319 and the lower support band at $1,993.
Ethereum Price Analysis: 4-hourly Chart
The failed breakout attempt near the upper band suggests that bulls lack the strength to sustain a move higher, leaving the door open for further declines.
The price action is currently hovering around the middle DC line, signaling indecision, but with a tilt toward the downside as volume spikes on red candles. Bearish momentum is further evident in the breakdown from the highlighted price cluster, where Ethereum shed 7.53% over six consecutive 4-hour candles.
The red zone illustrates a liquidity flush, likely triggering stop-loss cascades from leveraged long positions, adding to the selling pressure. If the $2,156 support fails, Ethereum could slide toward $2,000, aligning with the lower Donchian boundary. On the flip side, a reclaim of $2,200 could reignite bullish sentiment and set up another test of the $2,319 resistance.
Ethereum Price Forecast: Daily time frame chart
Bulls Struggles Below $2,142—Will $2,009 Support Hold?
Ethereum price forecast signals continue to lean bearish on the 24-hour chart, struggling to hold above the $2,142 level after facing strong resistance at $2,258.
The latest daily candle reflects increased selling pressure, with ETH losing 2.73% in the session, confirming persistent bearish sentiment. The Keltner Channel (KC) highlights this downside momentum, as the price remains close to the lower band at $2,009, signaling the potential for further declines if the current support structure collapses.
Ethereum Price Analysis: 24-hourly Chart
A clear downward trajectory is evident as ETH price has remained below the middle KC line of $2,417, reinforcing the bearish control of market structure.
The sharp -7.53% drop over a single daily candle suggests that leverage liquidations could be playing a role in accelerating the selloff. If Ethereum fails to defend $2,100, a deeper retracement toward the $2,009 support appears likely, where buyers might attempt to reestablish control.
Despite the bearish setup, a bounce from current levels could shift momentum in favor of the bulls.
If Ethereum reclaims $2,200 and sustains a move above the $2,258 resistance, it could target the $2,417 mid-KC level, with an extended rally opening the door for a potential retest of $2,825. However, with volatility increasing and bears dominating, Ethereum risks further downside unless demand steps in decisively.
Ethereum Price Outlook Today
Ethereum’s technical landscape reflects conflicting signals balance between bearish macroeconomic pressures and potential short-term rebounds.
The 24-hour chart highlights key support at $2,009, while the 4-hour ETH price chart signals immediate downside risks following the rejection at $2,319. With NFP data suggesting sustained inflationary pressures, traders remain cautious, leading to liquidity-driven price swings.