After facing a cascading crash at the beginning of the year, Toncoin (TON) is gaining traction in the present market. Due to Pavel Durov’s detainment sparking panic, this crypto’s price went into a complete spiral, losing nearly half of its value from December 2024 peak to March 2025 crash. However, things took a different turn
Amidst various developments within the Ripple ecosystem, the community is eagerly awaiting the much-anticipated XRP lawsuit settlement. This excitement is further amplified by Ripple co-founder Chris Larsen’s meeting with SEC Chair Paul Atkins. Scheduled for today, the meeting sparks speculation about swift action in the Ripple case.
Let’s unveil how this meeting will reshape the Ripple case and how it will impact the future of the XRP price.
Chris Larsen to Meet Paul Atkins: How It Will Impact XRP Lawsuit?
In the latest update within the Ripple network, co-founder Chris Larsen is meeting SEC Chair Paul Atkins today. Reportedly, experts see this meeting as a significant development for Ripple, XRP, and the prolonged lawsuit. Though the meeting’s agenda remains undisclosed, analysts believe that the XRP lawsuit will be one of the main topics of discussion.
Although both the US SEC and Ripple withdrew their appeals in the case, the SEC’s official confirmation of the lawsuit’s conclusion is still pending. Recently, the US Court of Appeals has granted the joint motion by Ripple and the SEC to suspend their appeal while they finalize the settlement.
Clarifications on XRP’s Legal Status
As per expert anticipations, today’s meeting may play a key role in providing clarity to the legal status of Ripple’s XRP token. Though Judge Analisa Torres ruled XRP a non-security, debate persists about its status, particularly in light of the Oregon AG’s Coinbase lawsuit.
Recently, Oregon Attorney General Dan Rayfield filed a case against Coinbase, a top crypto exchange, alleging that the firm offered unregistered securities like XRP. However, lawyers like John Deaton slammed the suit as “dystopian nonsense,” highlighting Judge Torres’ ruling.
Significantly, gaining legal clarity on the token’s status could lead to a swift resolution in the XRP lawsuit. It could also trigger a major rally in the XRP price.
Potential Approval of XRP ETF
Besides the XRP lawsuit and Ripple’s legal status, another major topic of concern is the exchange-traded fund (ETF). With the SEC’s current positive stance on the crypto industry, all eyes are on the commission’s potential approval of multiple crypto ETFs. As major asset managers have filed for an XRP ETF, the commission is awaiting its launch, alongside the XRP lawsuit settlement.
According to Bloomberg analysts Eric Balchunas and James Seyffart, the odds of an ETF approval for XRP lie at 85%, whereas Solana and Litecoin boast 90%.
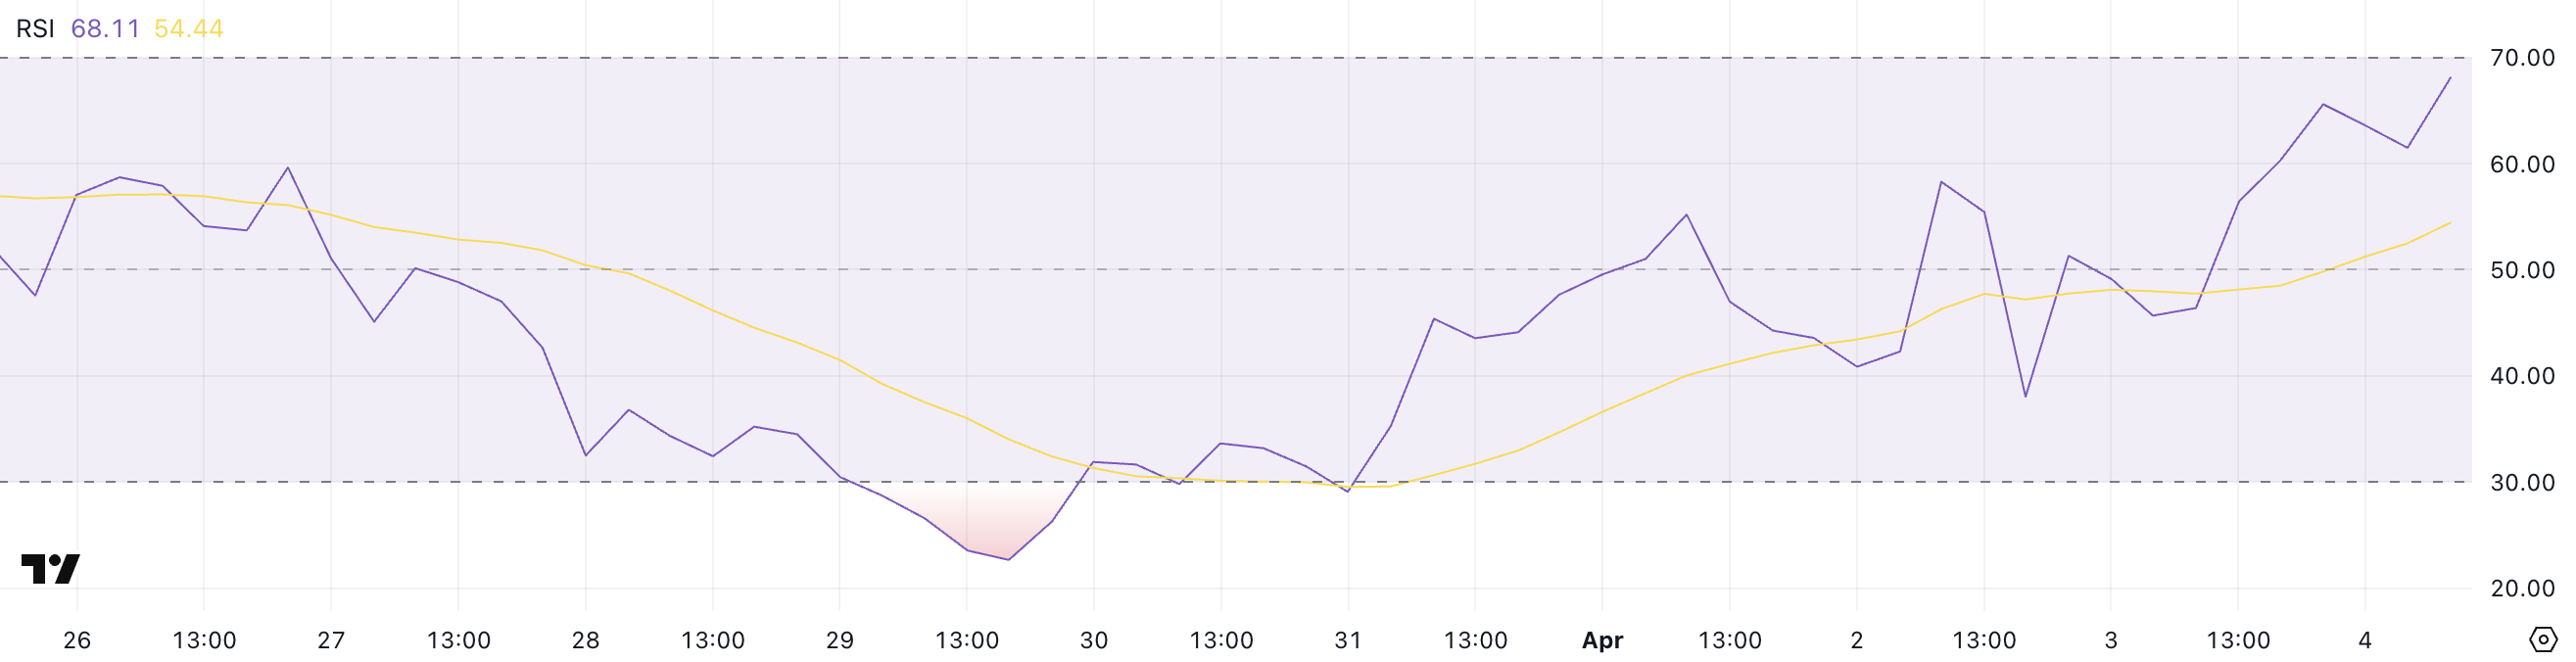
Cosmos (ATOM) is gaining strong bullish momentum, jumping over 14% in the last 24 hours as technical indicators flash potential for further upside. The token’s Relative Strength Index (RSI) has surged from deeply oversold levels to nearly overbought territory, highlighting an aggressive wave of buying pressure.
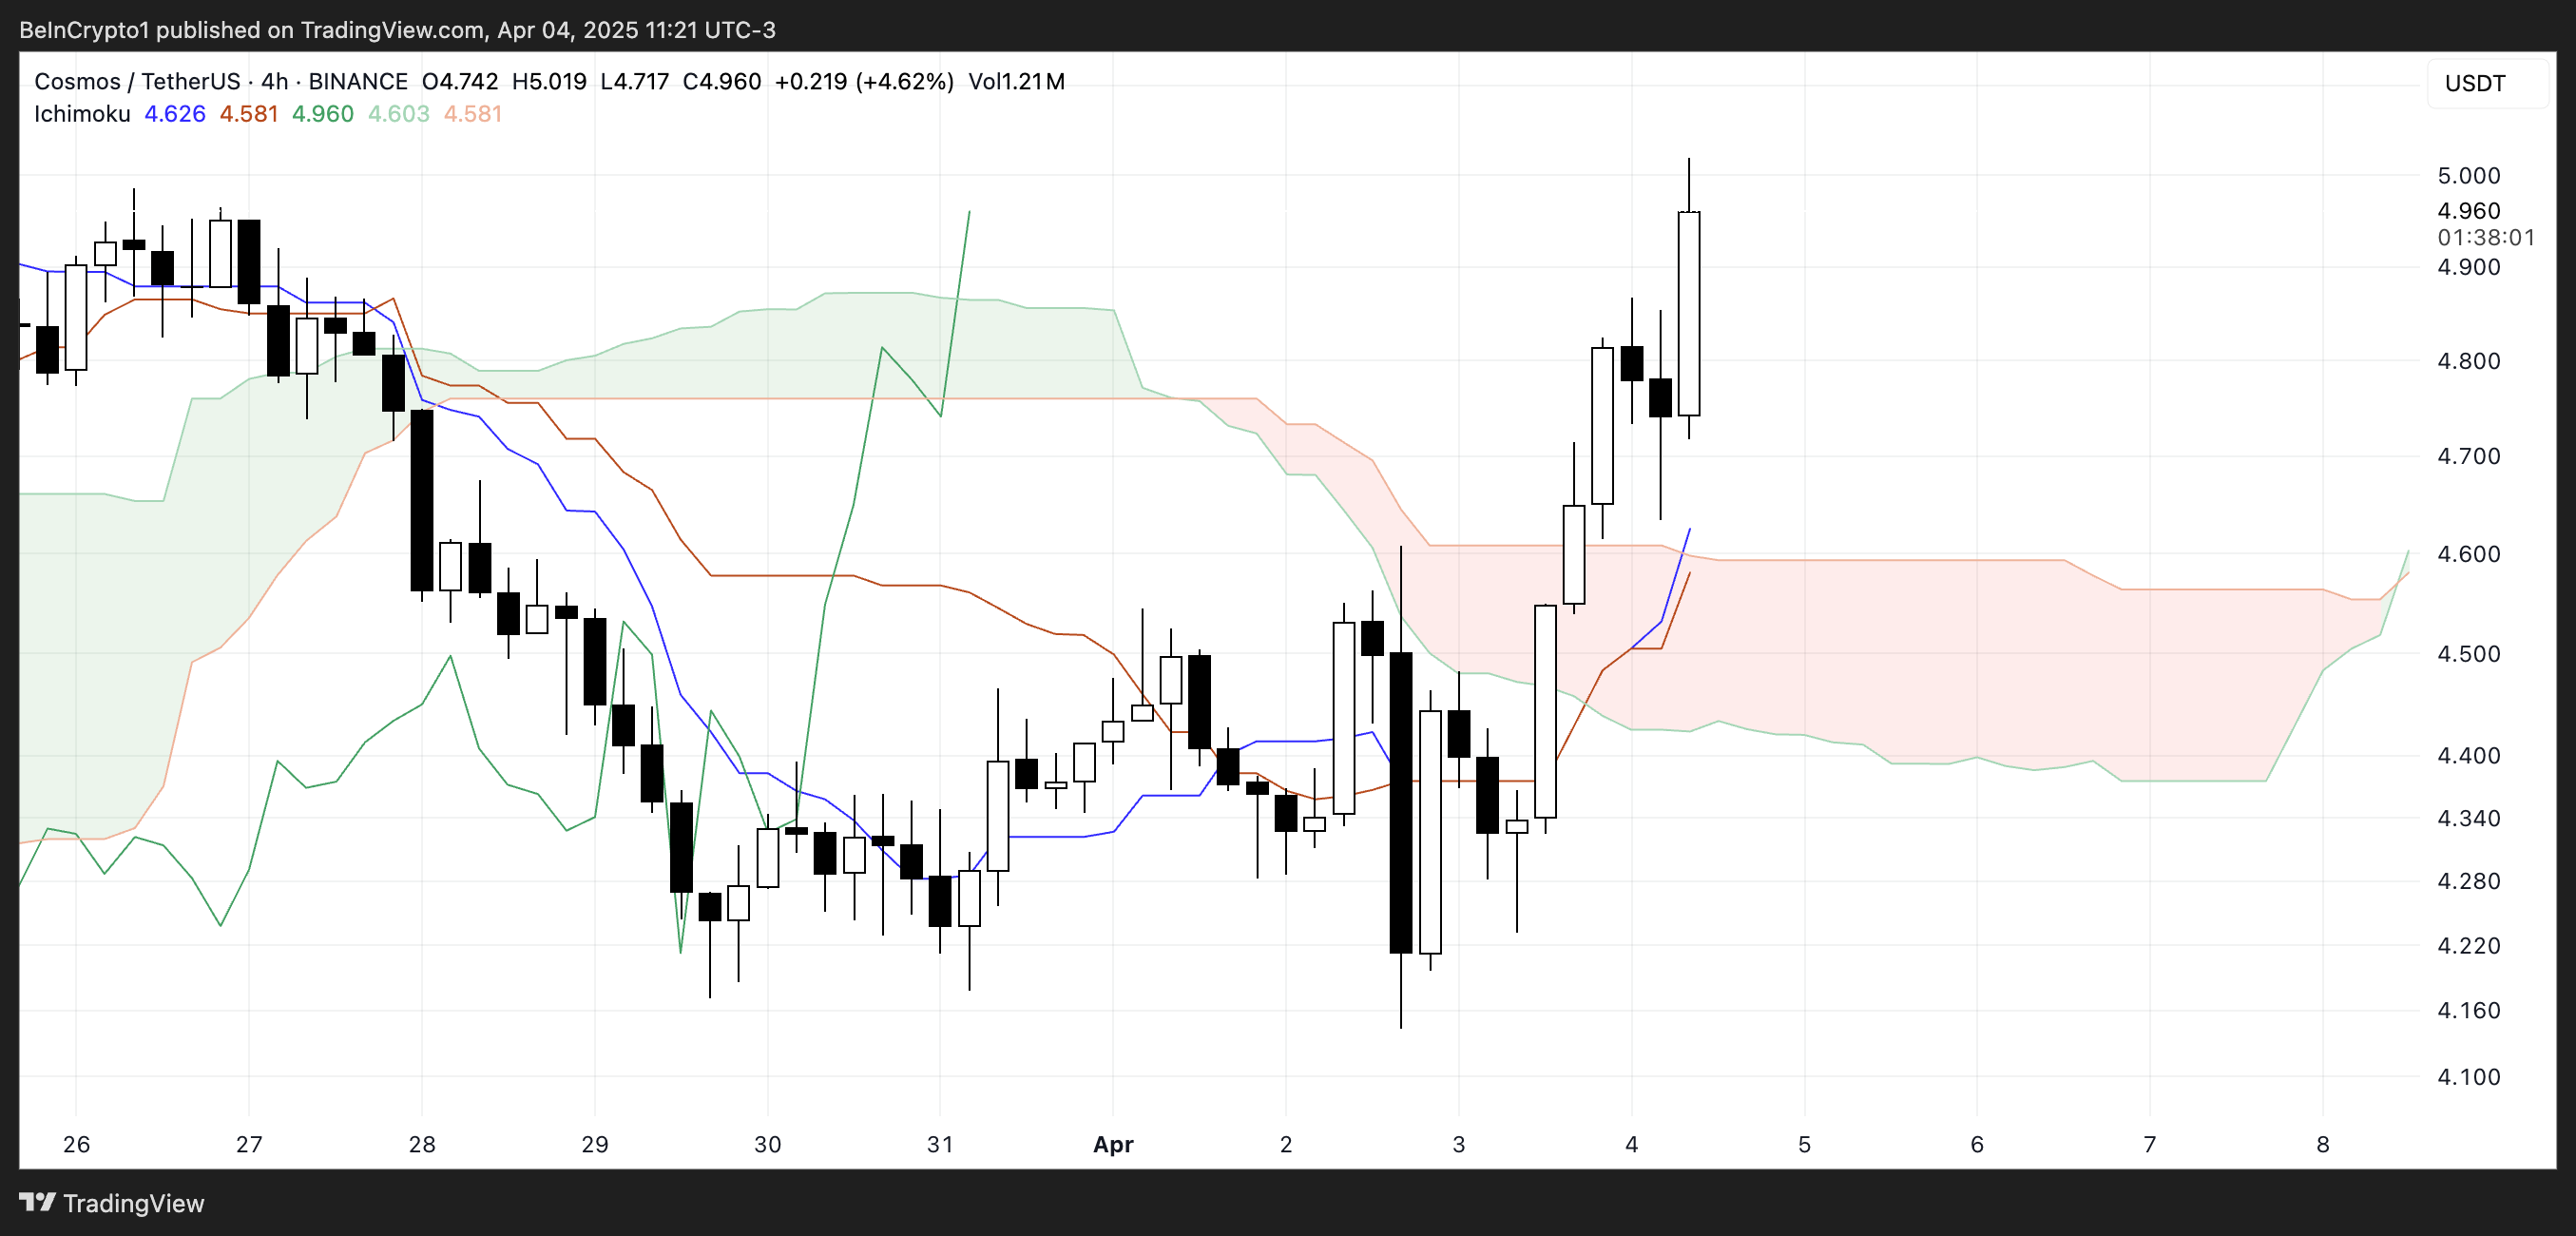
On the Ichimoku Cloud chart, ATOM has broken above the cloud with bullish crossovers forming, suggesting a possible trend reversal is underway. As the price nears a key resistance zone, traders are watching closely to see if ATOM can maintain this breakout and push toward the $6 mark in April.
This rapid rise suggests strong buying pressure over a short period, signaling a dramatic shift in sentiment. The RSI is a momentum oscillator that measures the speed and change of price movements, with values ranging from 0 to 100.
Typically, a reading below 30 indicates an asset is oversold and may be due for a bounce, while a reading above 70 suggests it’s overbought and could be primed for a pullback.
With ATOM’s RSI now nearing the overbought threshold at 70, it indicates that the recent price run-up may be nearing exhaustion—at least in the short term.
While a breakout above 70 could signal a strong bullish continuation, such high RSI levels also come with caution, as traders may begin to take profits or reassess entry points.
If momentum holds, ATOM could push into overbought territory and extend its gains. However, if buyers begin to fade, the price could see some short-term cooling as the market digests the recent surge.
ATOM Ichimoku Cloud Shows A Bullish Setup
Cosmos is showing a bullish breakout on the Ichimoku Cloud chart. The price has decisively moved above the cloud, indicating a potential trend reversal.
The blue conversion line (Tenkan-sen) has sharply turned upward and now sits above the red baseline (Kijun-sen), which is a classic bullish crossover.
This alignment reflects growing short-term momentum and could support further upside if it holds.
Additionally, the Leading Span A (green cloud boundary) has started to curve upward, while Leading Span B (red boundary) is beginning to flatten.
This shift is causing the cloud ahead to thin out, signaling that bearish pressure is weakening. With the price above the cloud and the lagging span (Chikou) clear of recent price action, the overall setup leans bullish.
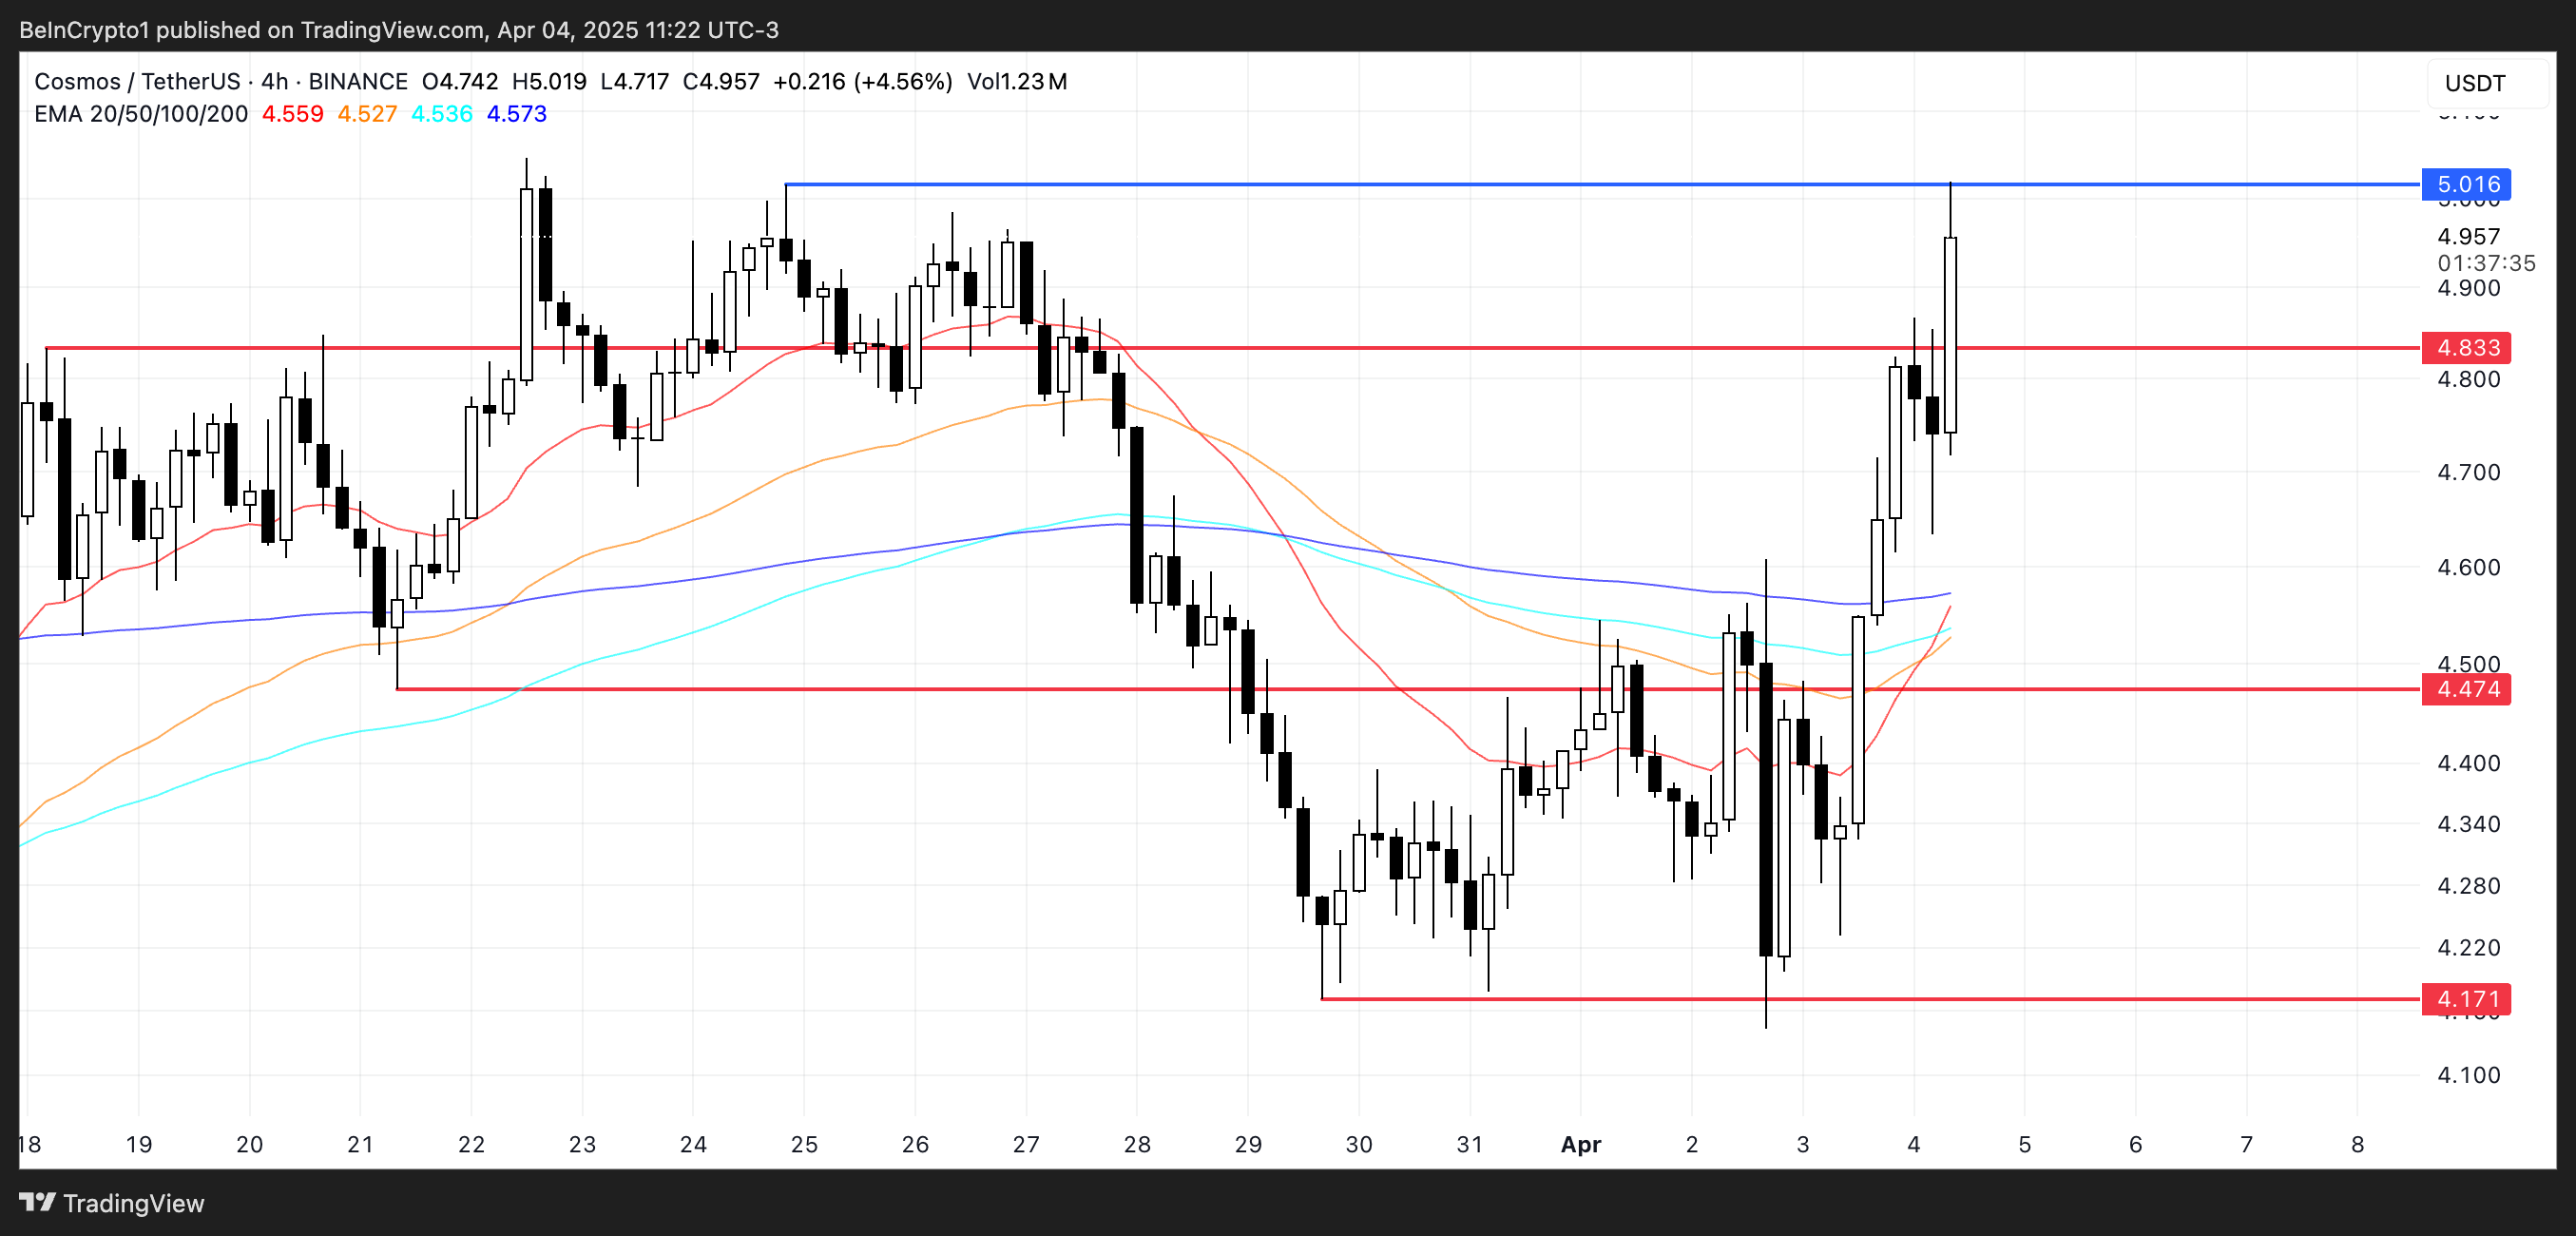
The current alignment of the EMA lines shows growing bullish momentum, and a golden cross—where a short-term EMA crosses above a longer-term EMA—appears to be forming. If confirmed, this signal could attract more buyers and reinforce the potential for a continued upward move, especially if volume supports the breakout.
Despite recent volatility, prominent analysts argue XRP’s technical setup is not bearish yet. They highlight specific price levels crucial for confirming the trend.
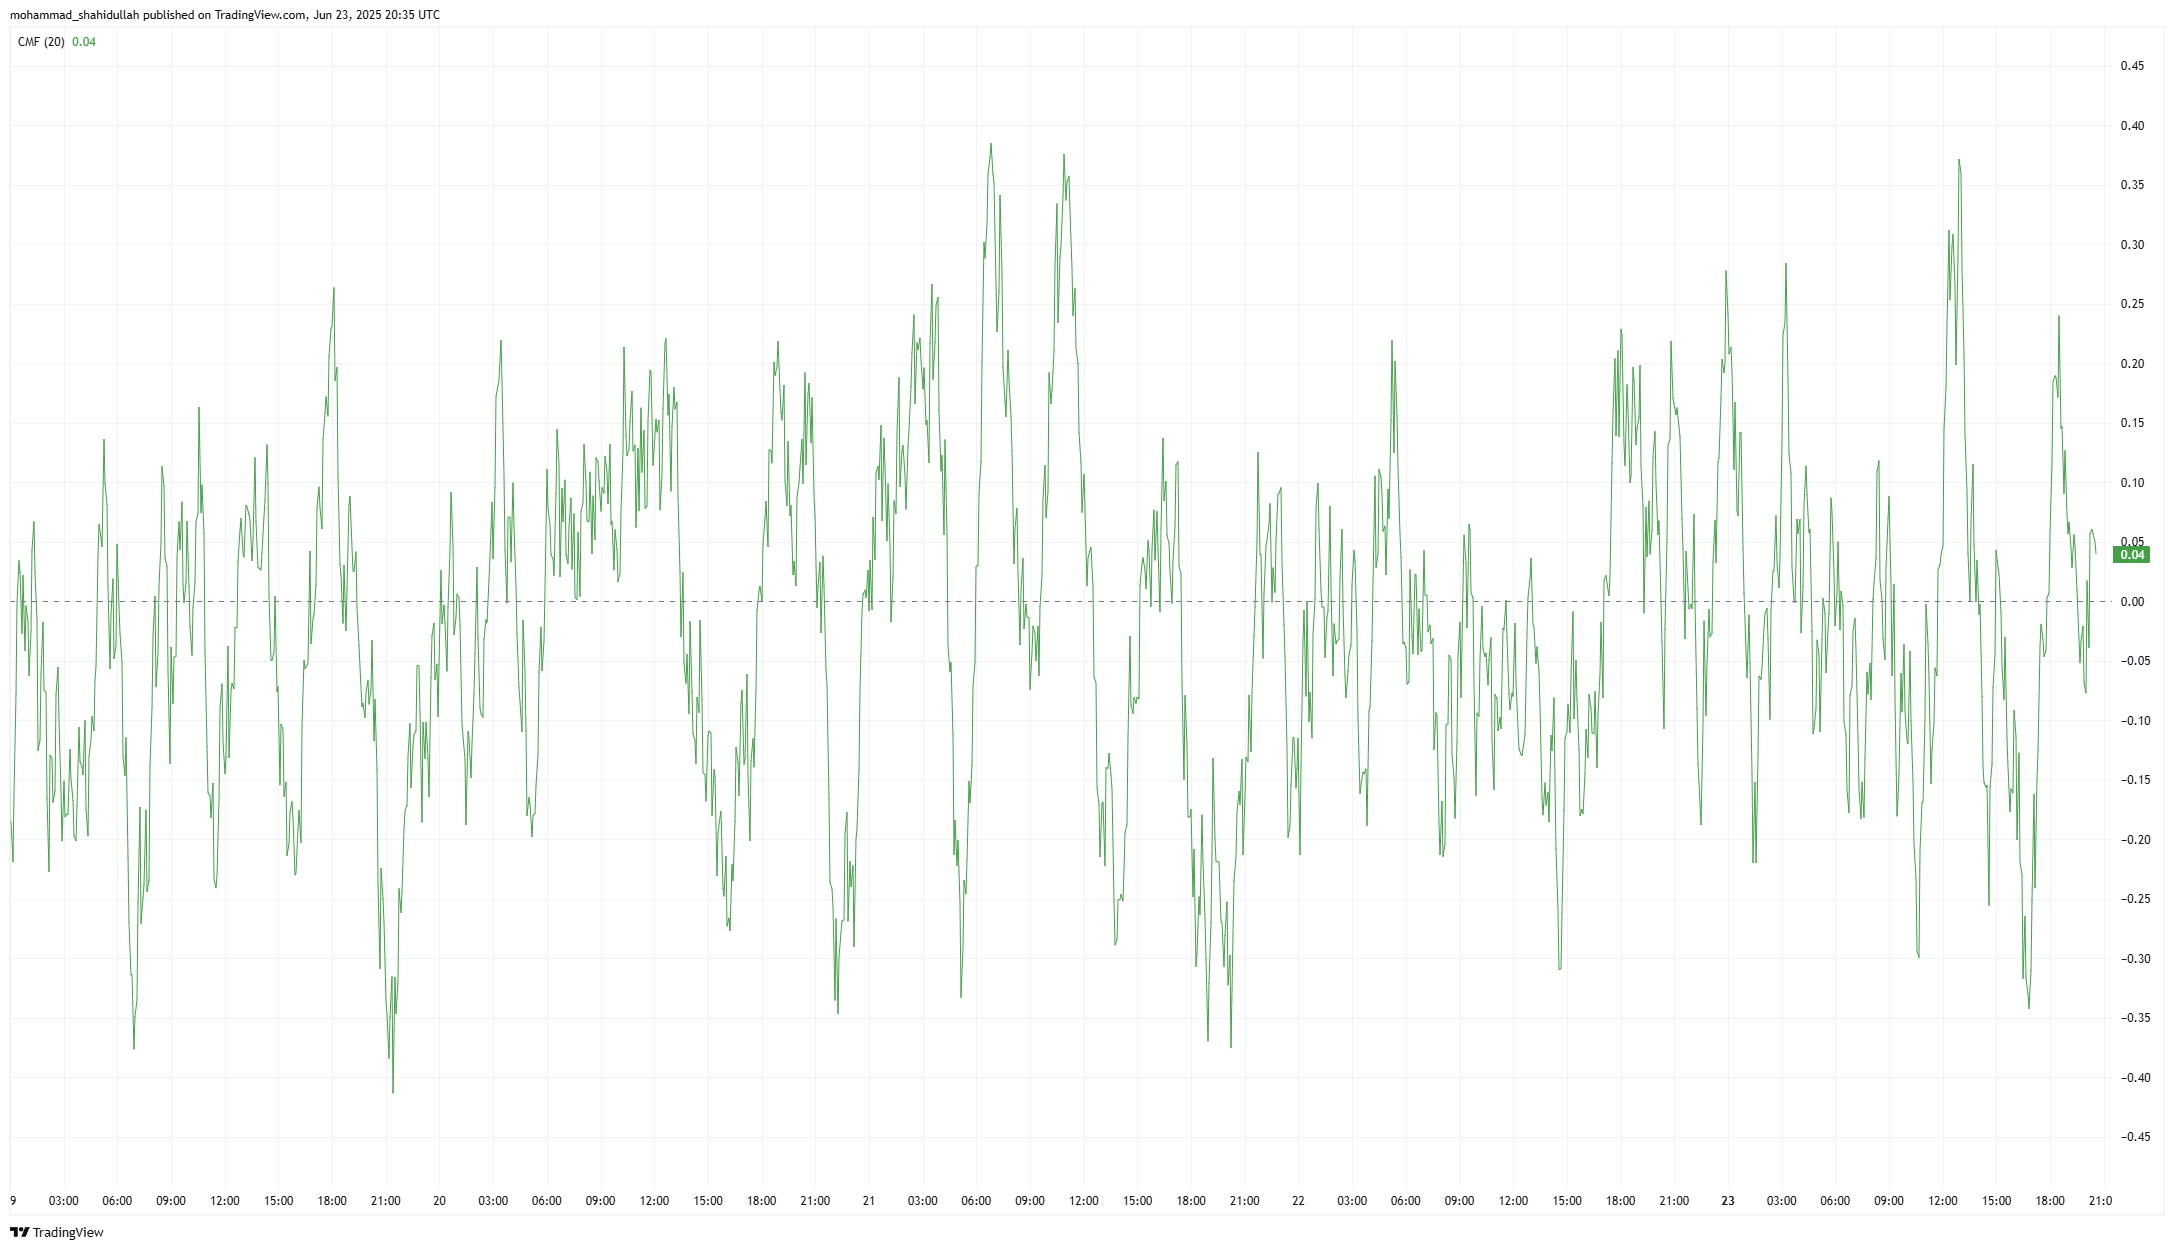
A technical evaluation of XRP’s recent 5-day chart adds context to these analyst views.
Analysts Remain Cautiously Optimistic About XRP Price
Veteran trader Peter Brandt highlighted a potential Head-and-Shoulders (H&S) pattern on XRP’s chart. This is traditionally a bearish indicator that signals a reversal from bullish to bearish if key support levels break.
However, Brandt emphasizes caution against premature bearish conclusions. He explicitly notes the importance of XRP maintaining support above $1.80.
Treat the Apr 7 overshoot as an out-of-line movement and we have a possible H&S top in $XRP For the sake of the uneducated trolls among you, this chart need NOT be interpreted as bearish Price is at support right now I will review if price closes below 1.8xxxx pic.twitter.com/YlsqLi2SzN
A decisive weekly close below that critical level would be needed to confirm a bearish scenario.
Meanwhile, analyst EGRAG CRYPTO provided a detailed bullish perspective using multiple technical indicators.
The Gaussian Channel is a volatility indicator used to identify trend strength and potential reversals. Closing within this channel boundary, around $1.75 currently, could signal weakening momentum and possible downward pressure.
Additionally, the 21-week EMA acts as a critical moving average that traders use to identify macro trends.
A close above the EMA level of $2.33 would signify strong bullish momentum.
Moreover, breaking above the resistance at $2.65 would confirm a robust long-term bullish trend.
EGRAG also applies Elliott Wave analysis, a technical approach that identifies repeating patterns (waves) in market prices to forecast potential targets.
Analyzing XRP Price with Elliott Wave Indicators. Source: X/EGRAG
Using Elliott Wave ratios, the analyst projects XRP could reach between $9 and $10 if the altcoin successfully completes its anticipated fifth wave, provided current support levels hold firm.
Short-Term Technical Analysis Supports Caution
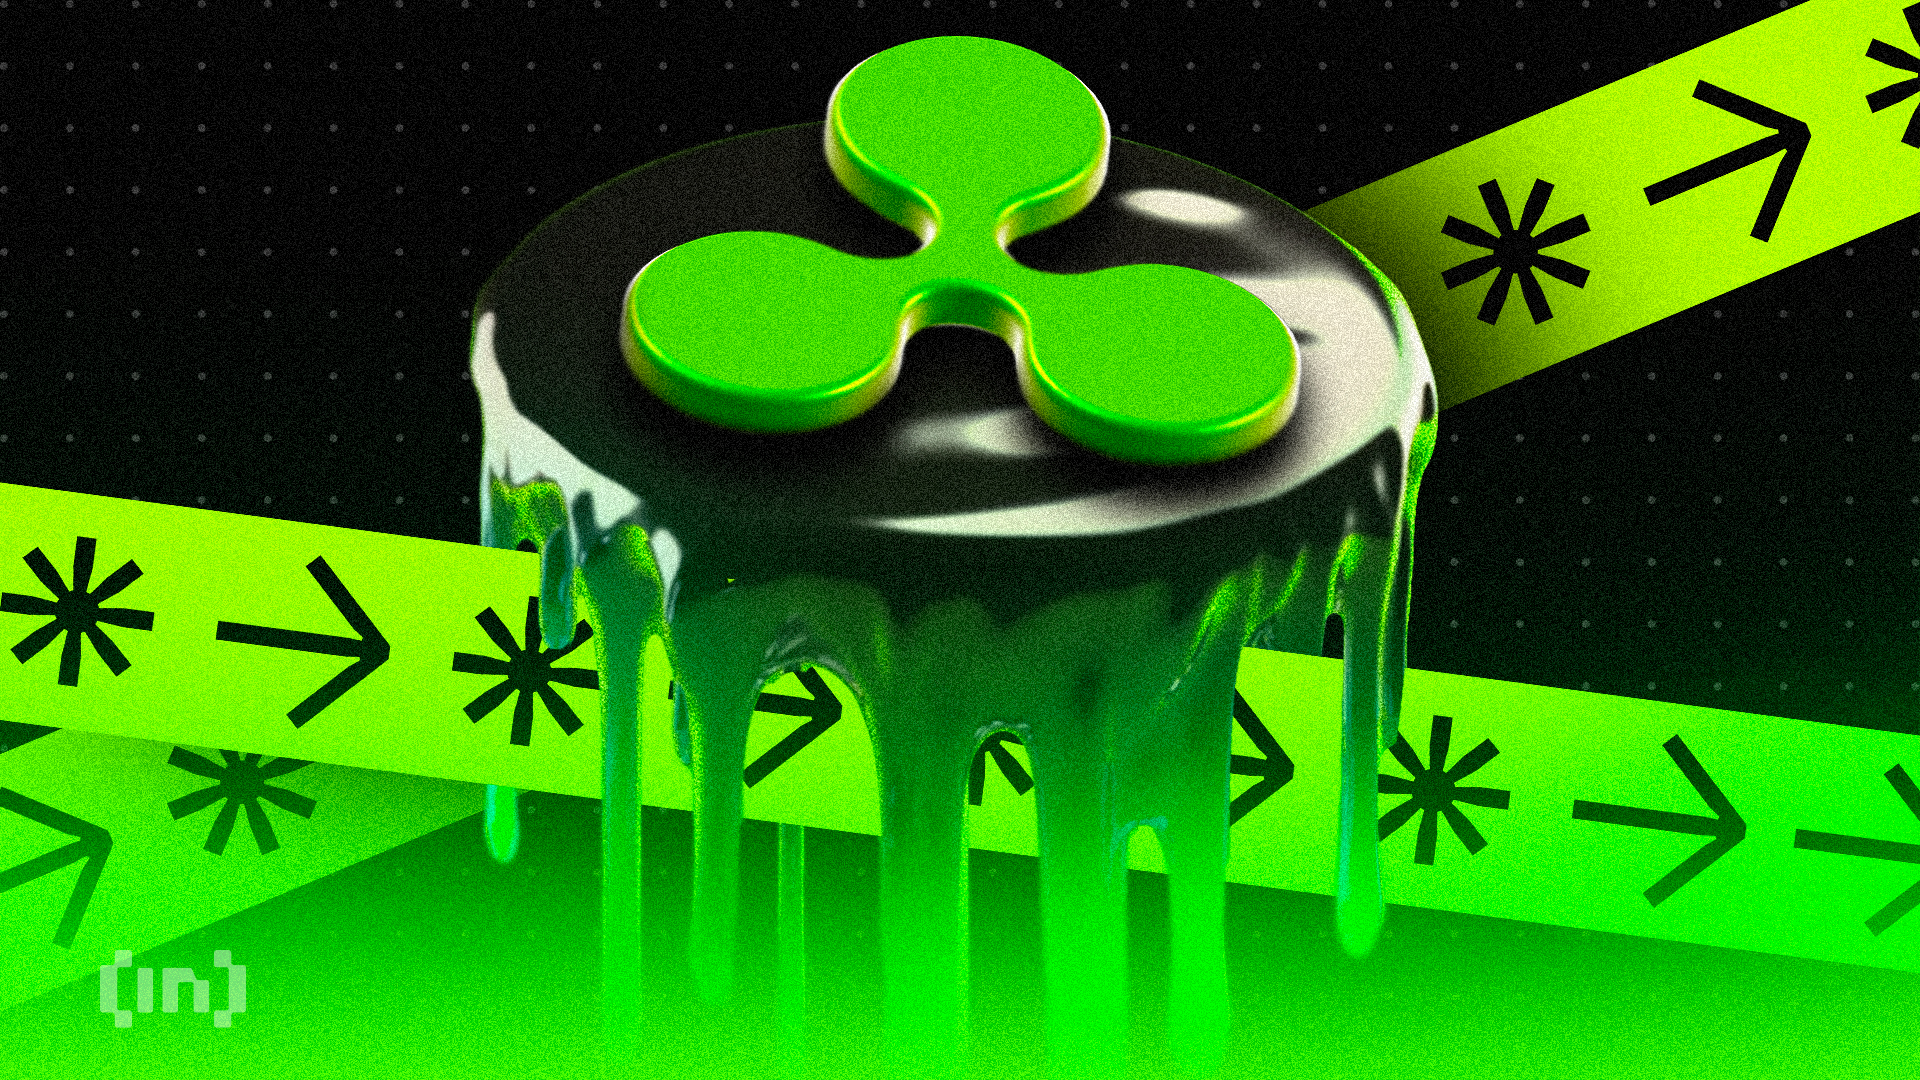
XRP faced significant selling pressure as prices declined sharply towards $1.90, confirmed by the Accumulation/Distribution (A/D) line dropping notably.
The A/D line measures cumulative buying and selling pressure, and its decline indicates higher trading volume on price decreases, reflecting strong seller activity.
As XRP price reached support near $1.90, the A/D line stabilized and began a modest climb during the rebound, indicating renewed buyer activity.
XRP Accumulation/Distribution Chart Over the Past 5 Days. Source: TradingView
Nevertheless, the accumulation during this rebound has not yet fully neutralized the earlier distribution, suggesting caution remains warranted.
Consolidation and Critical Levels to Watch for XRP
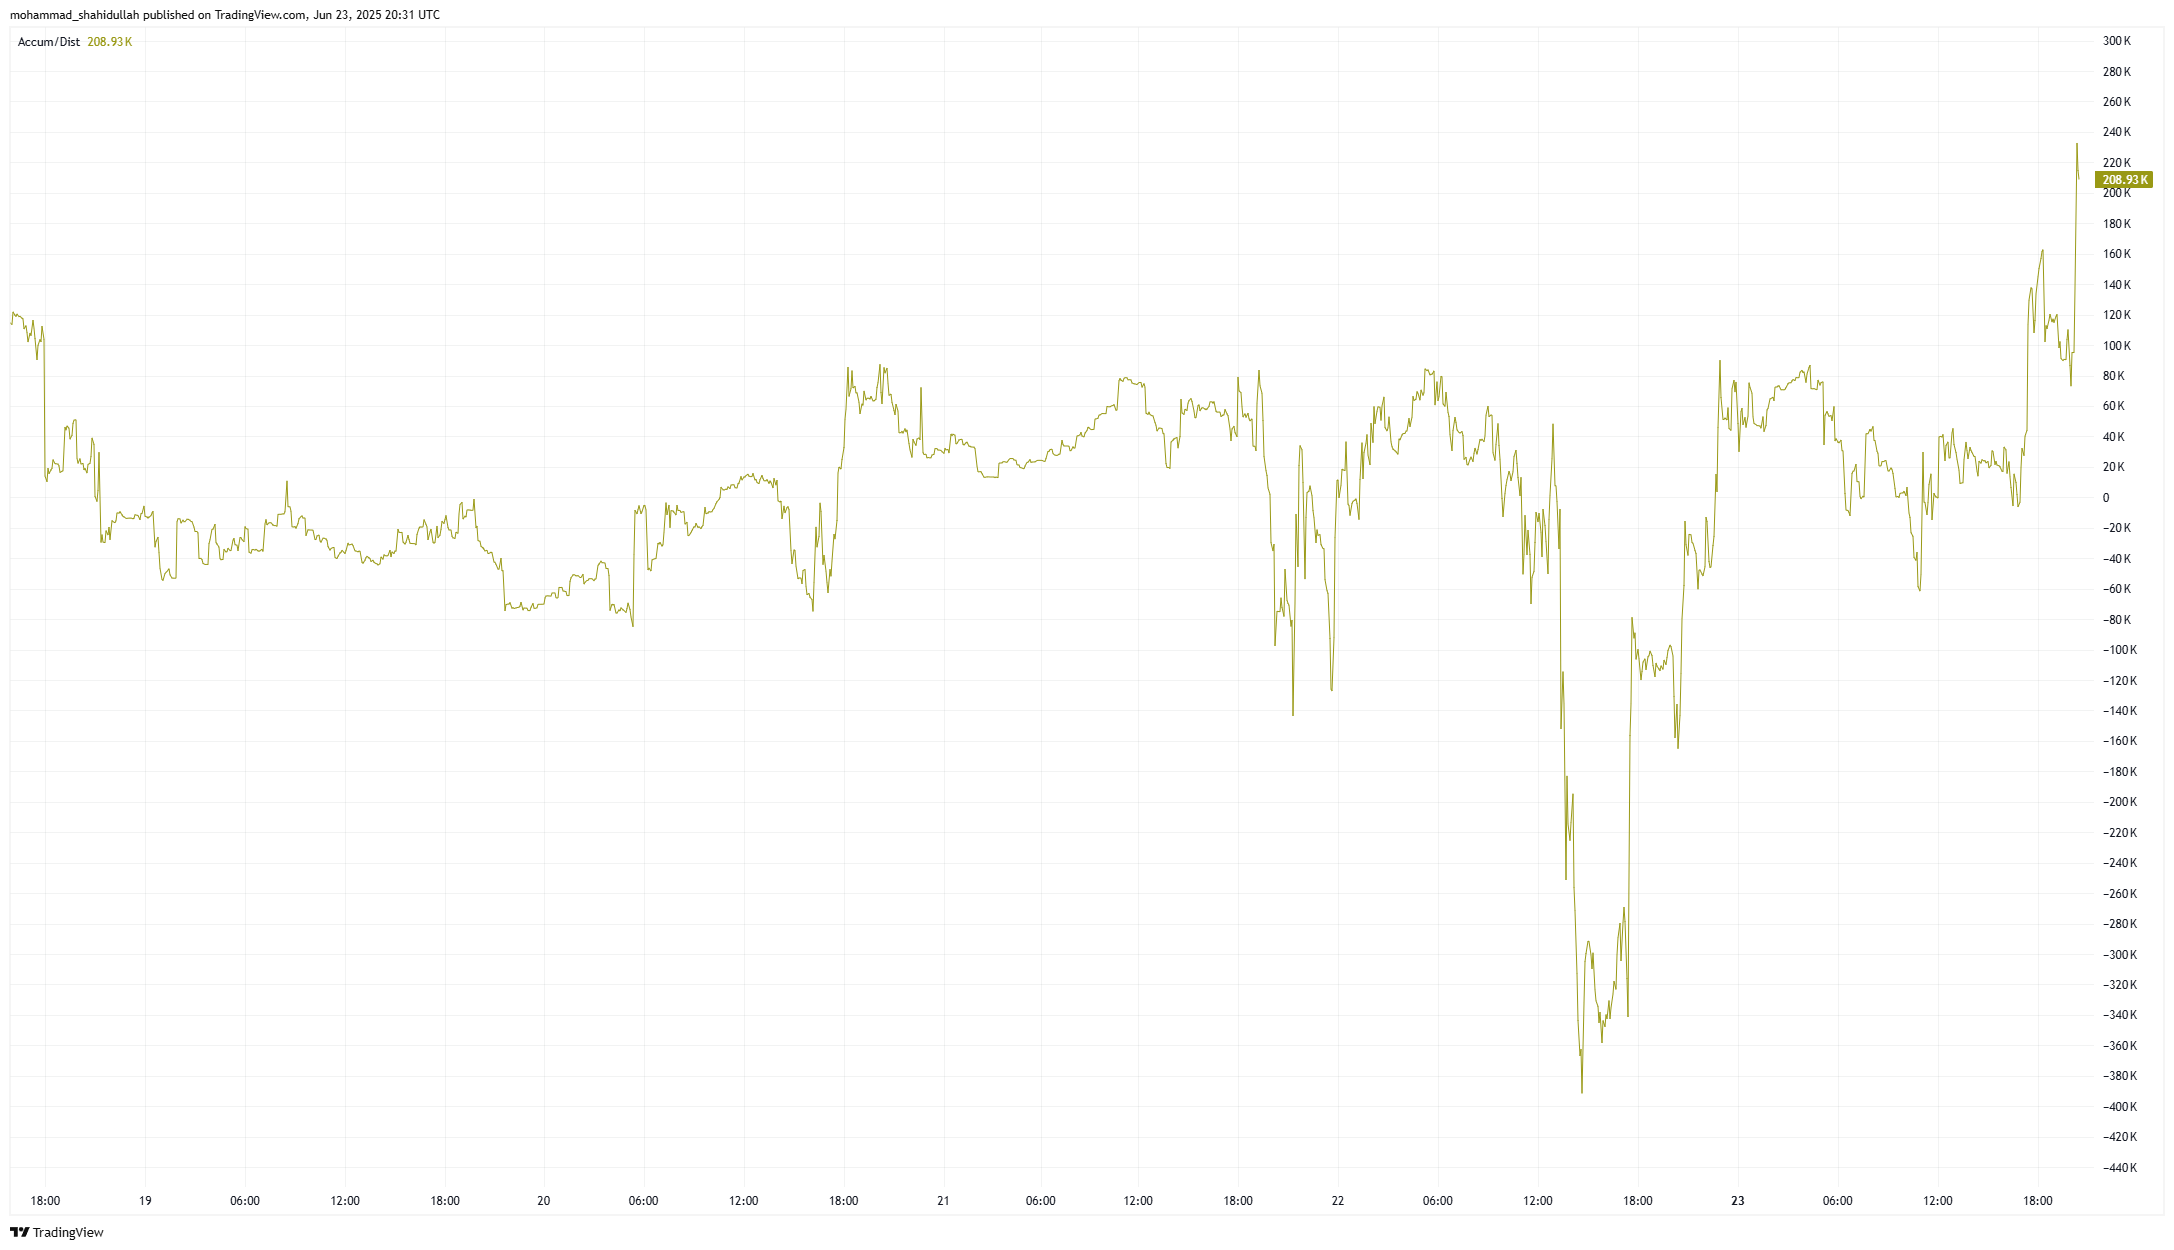
These technical indicators suggest XRP is currently in cautious consolidation. While support near $1.90 proved strong, the limited improvement in CMF indicates ongoing market uncertainty.
Overall, this analysis aligns with analyst views that key support around $1.75 to $1.80 remains intact. Only a decisive weekly close below these supports would validate a bearish outlook.
Traders should closely monitor XRP’s interaction with critical support and resistance levels.
Specifically, a confirmed breakout above $2.33 and then $2.65 would signal bullish continuation, while a decisive breach of $1.75-$1.80 support would indicate increased bearish risk.