It took a few years for the idea to catch on, but it’s fair to say the world knows all about Bitcoin now. The days when viral pranksters would hold up signs behind Janet Yellen in Congress or wield placards on Wall Street are gone. Bitcoin has won, along with everyone bold enough to have
XRP has been consolidating over the last few days, managing to stay above the $2 mark. However, after validating a four-month-long downtrend earlier this month, the altcoin is struggling to sustain its current position.
As investor interest wanes, XRP may face challenges in maintaining upward momentum.
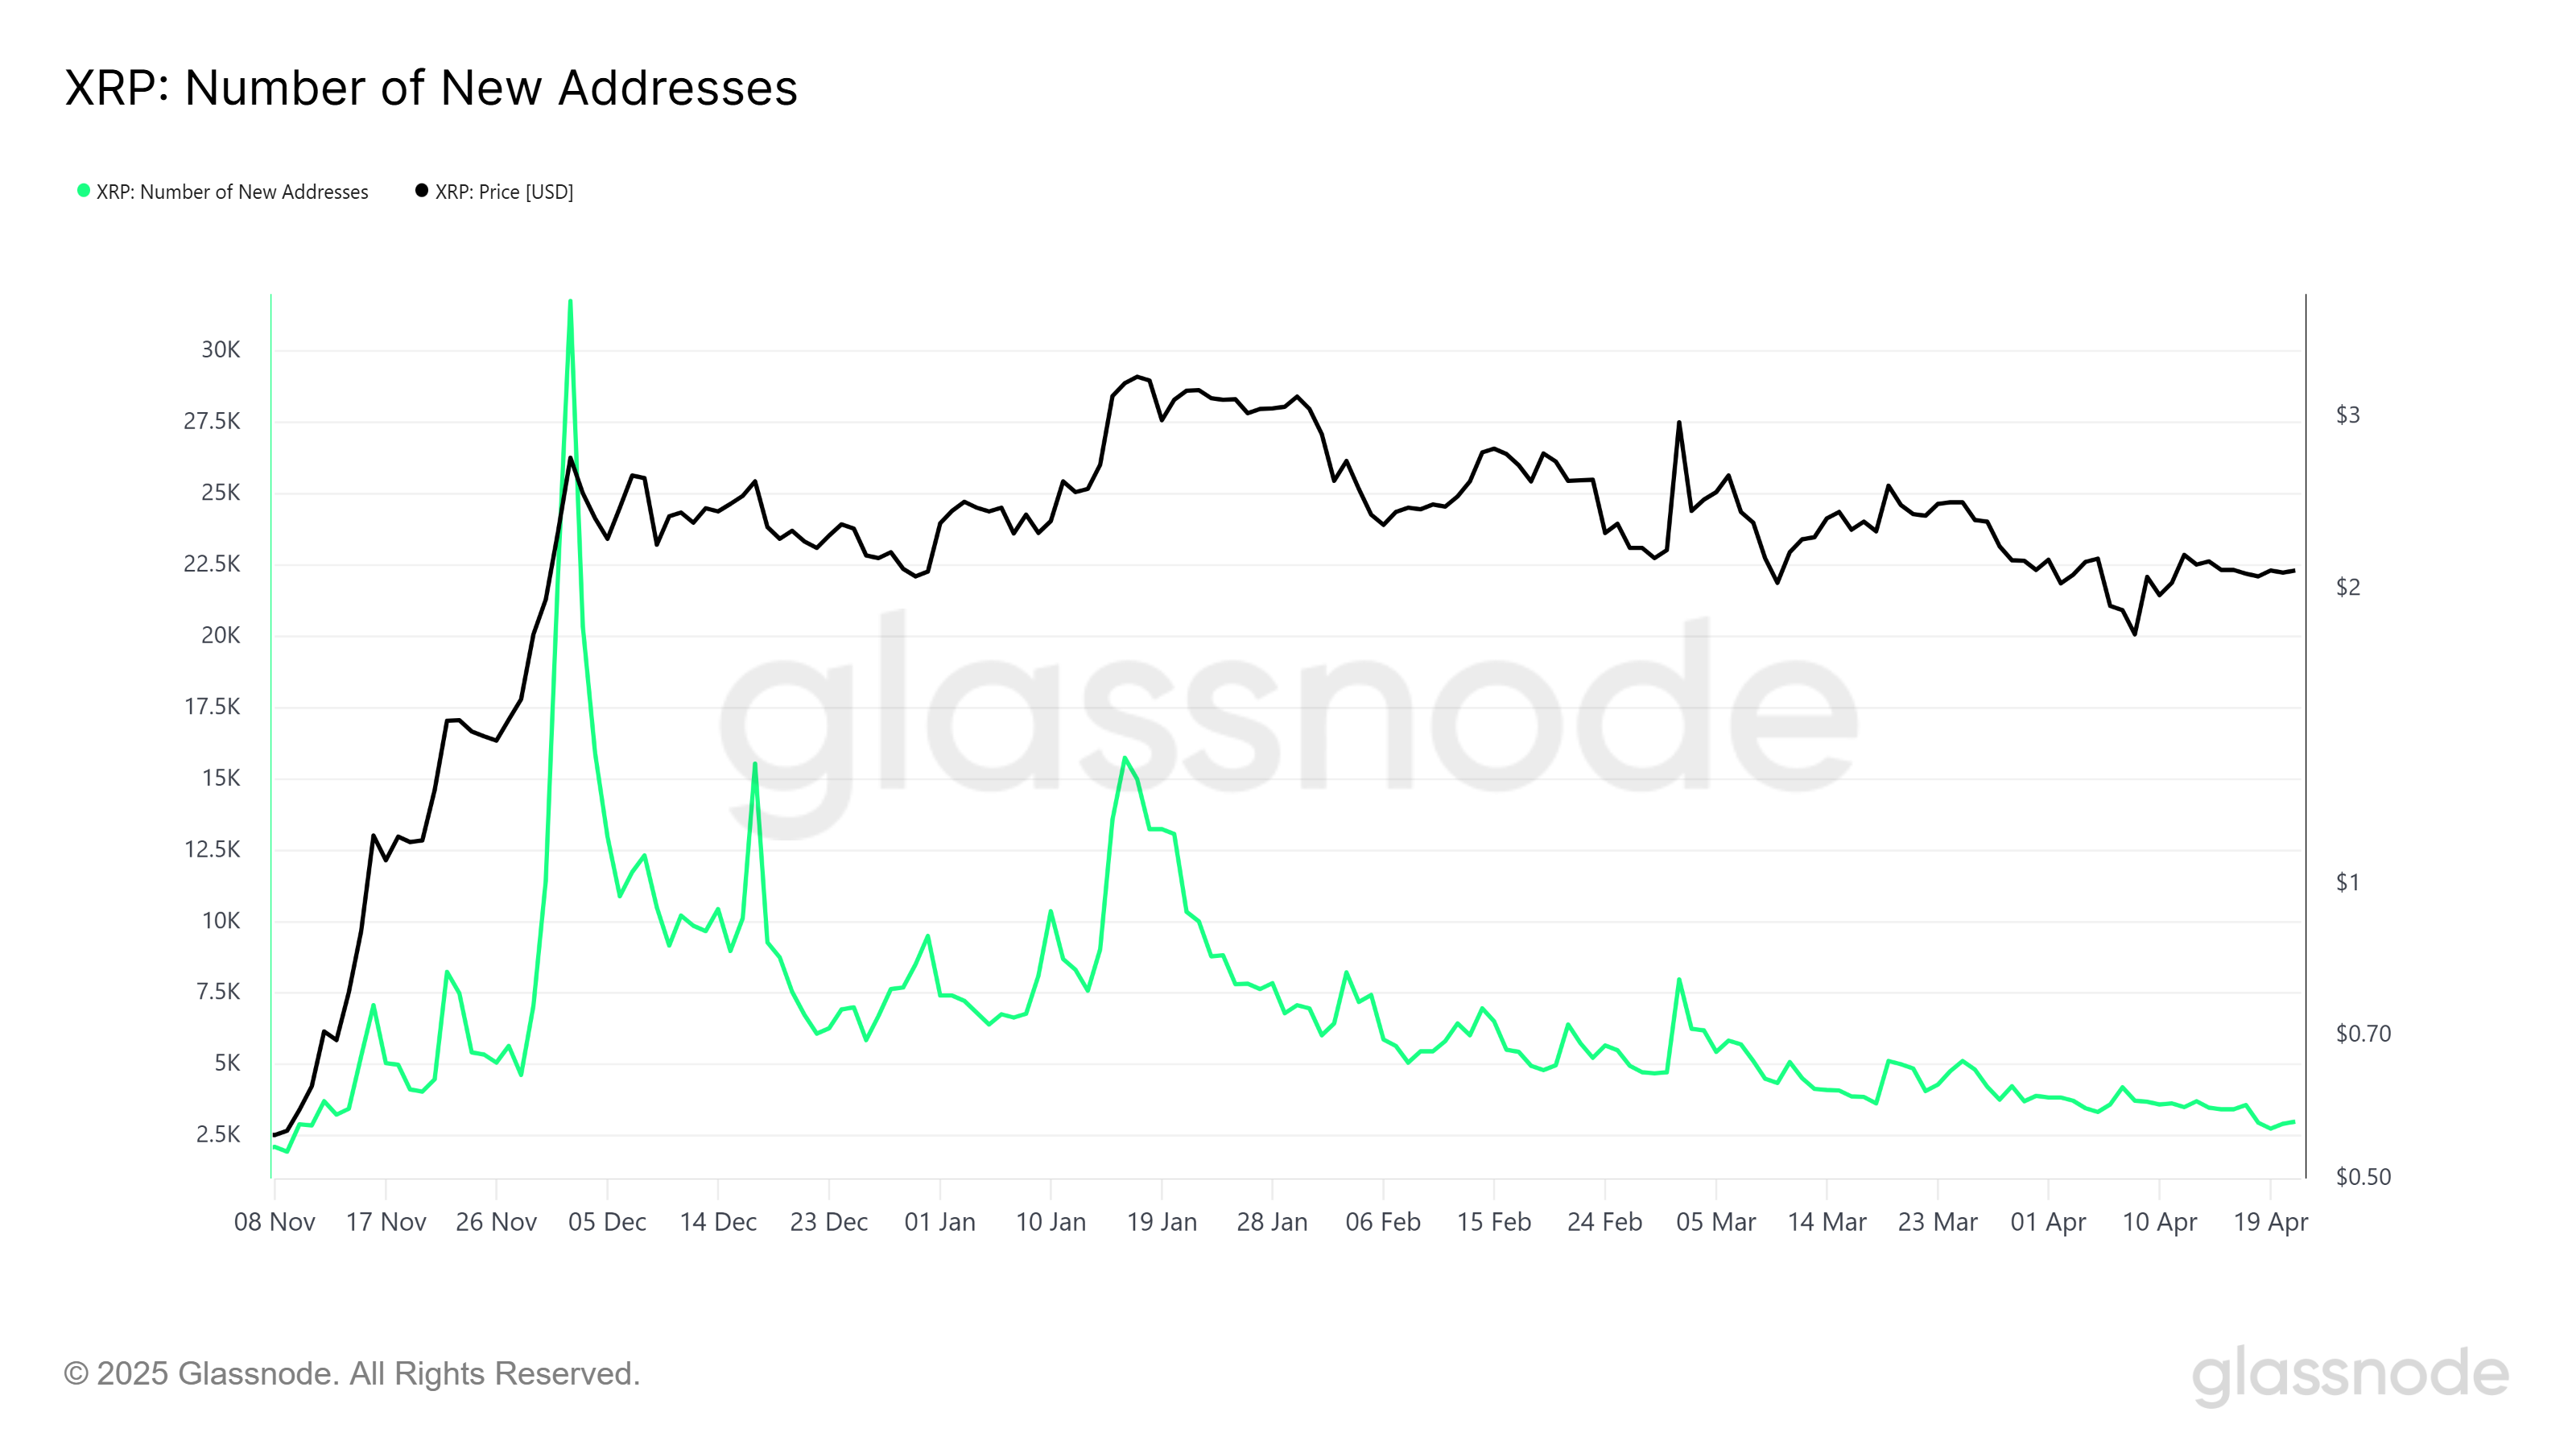
XRP Is Losing Investors’ Interest
New addresses associated with XRP have hit a 5-month low, signaling a decline in new investor interest. This suggests that XRP is losing traction within the market as fresh capital fails to flow into the asset. The absence of new buyers could make it difficult for XRP to maintain its position above $2.
The falling demand is concerning as XRP’s price growth is often supported by new market participants. With fewer investors entering the market, the altcoin may face a prolonged period of stagnation. Unless there is a shift in demand, XRP’s ability to maintain its price level could be compromised.
The overall macro momentum for XRP remains weak, as reflected by technical indicators like the RSI. Currently stuck below the neutral line of 50.0, the RSI suggests that XRP is still in the bearish zone. This indicates a lack of bullish momentum, which could prevent the altcoin from seeing any significant rallies in the near term.
In addition, the broader market sentiment continues to be bearish, which further impacts XRP’s potential for recovery. Unless the market turns around or the altcoin finds new sources of demand, XRP’s price will likely remain suppressed.
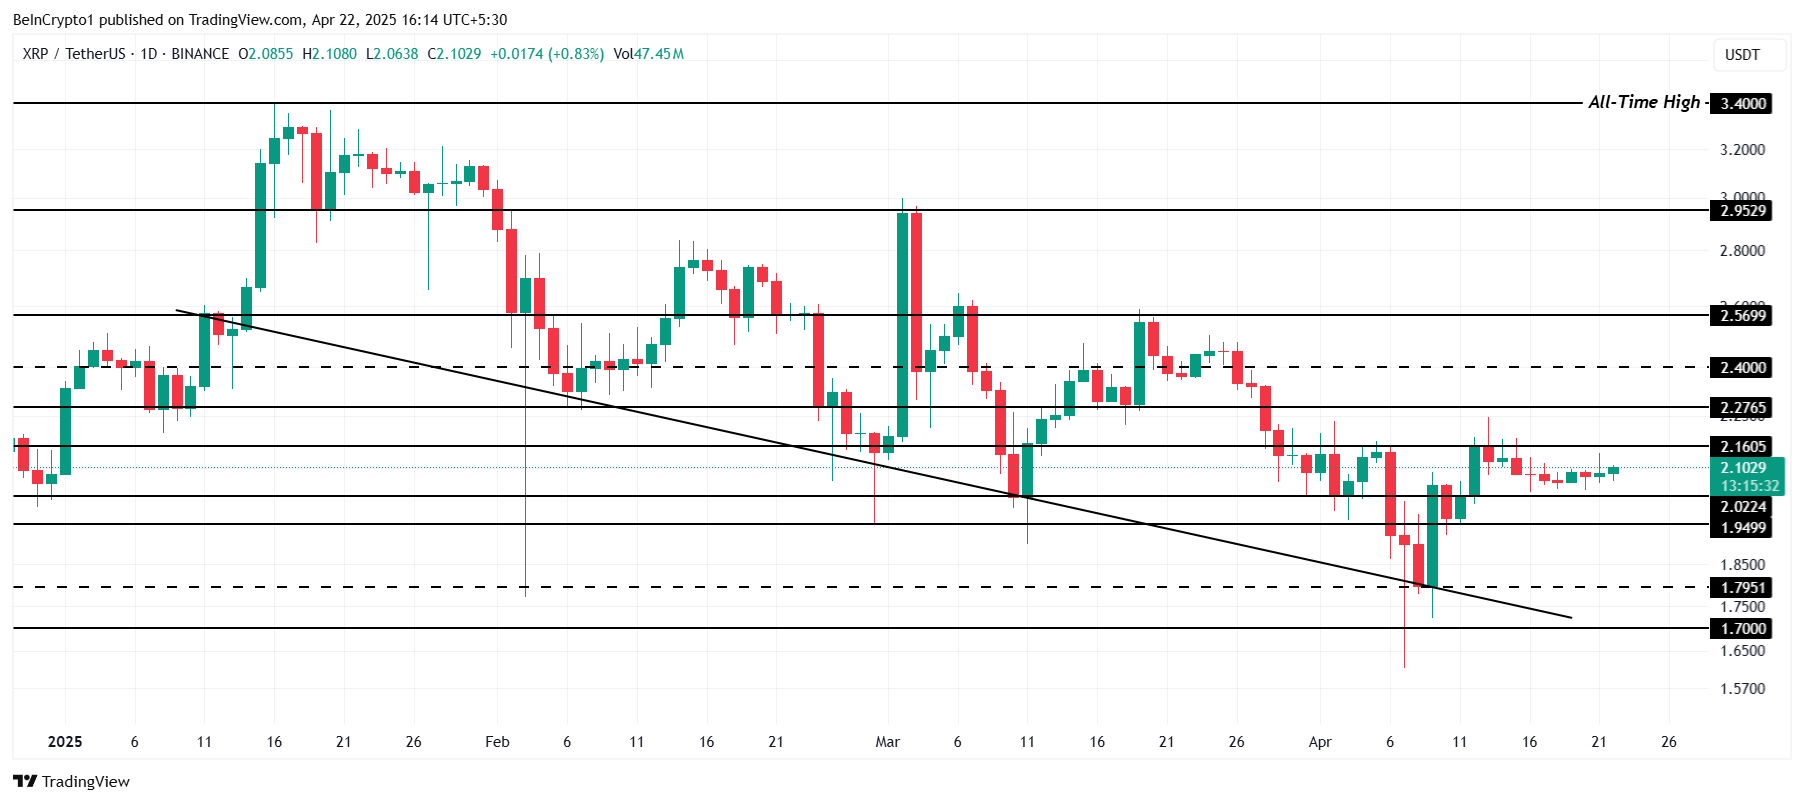
XRP’s price is currently at $2.10, holding above the $2.02 support level but facing resistance at $2.16. The ongoing downtrend that has persisted since the beginning of the year continues to weigh heavily on the altcoin. If the price fails to break through the resistance level, XRP may try to push higher.
The current market conditions could prevent XRP from surpassing $2.16. However, if the price loses the $2.02 support, it may drop to the next support level of $1.94. Should this happen, the altcoin could experience a more significant decline, potentially reaching as low as $1.79.
Alternatively, if XRP manages to breach the $2.16 resistance, it could rally towards $2.27. With a change in investor sentiment and market conditions, this could propel the altcoin to $2.40, invalidating the bearish outlook.
According to the latest filing in the Harper Vs IRS case, the US government argued that the individual has no right to block the IRS from accessing his crypto records. While the user alleged that the IRS unlawfully accessed his private financial information, the government is urging the Supreme Court to rule in favor of the IRS. US Government Sides with IRS in Coinbase User’s Privacy Case US Solicitor General D. John Sauer argued in a May 30 filing that James Harper, a Coinbase user, lacks Fourth Amendment protection for his financial records stored with the exchange. The government claims Harper voluntarily shared his data with Coinbase, and the IRS followed proper procedures, like judicially approved summons, to obtain it. The filing also referenced Coinbase’s own privacy policy, which notified users that their information might be disclosed to law enforcement agencies. “The IRS may ‘examine any books, papers, records, or… Read More at Coingape.com
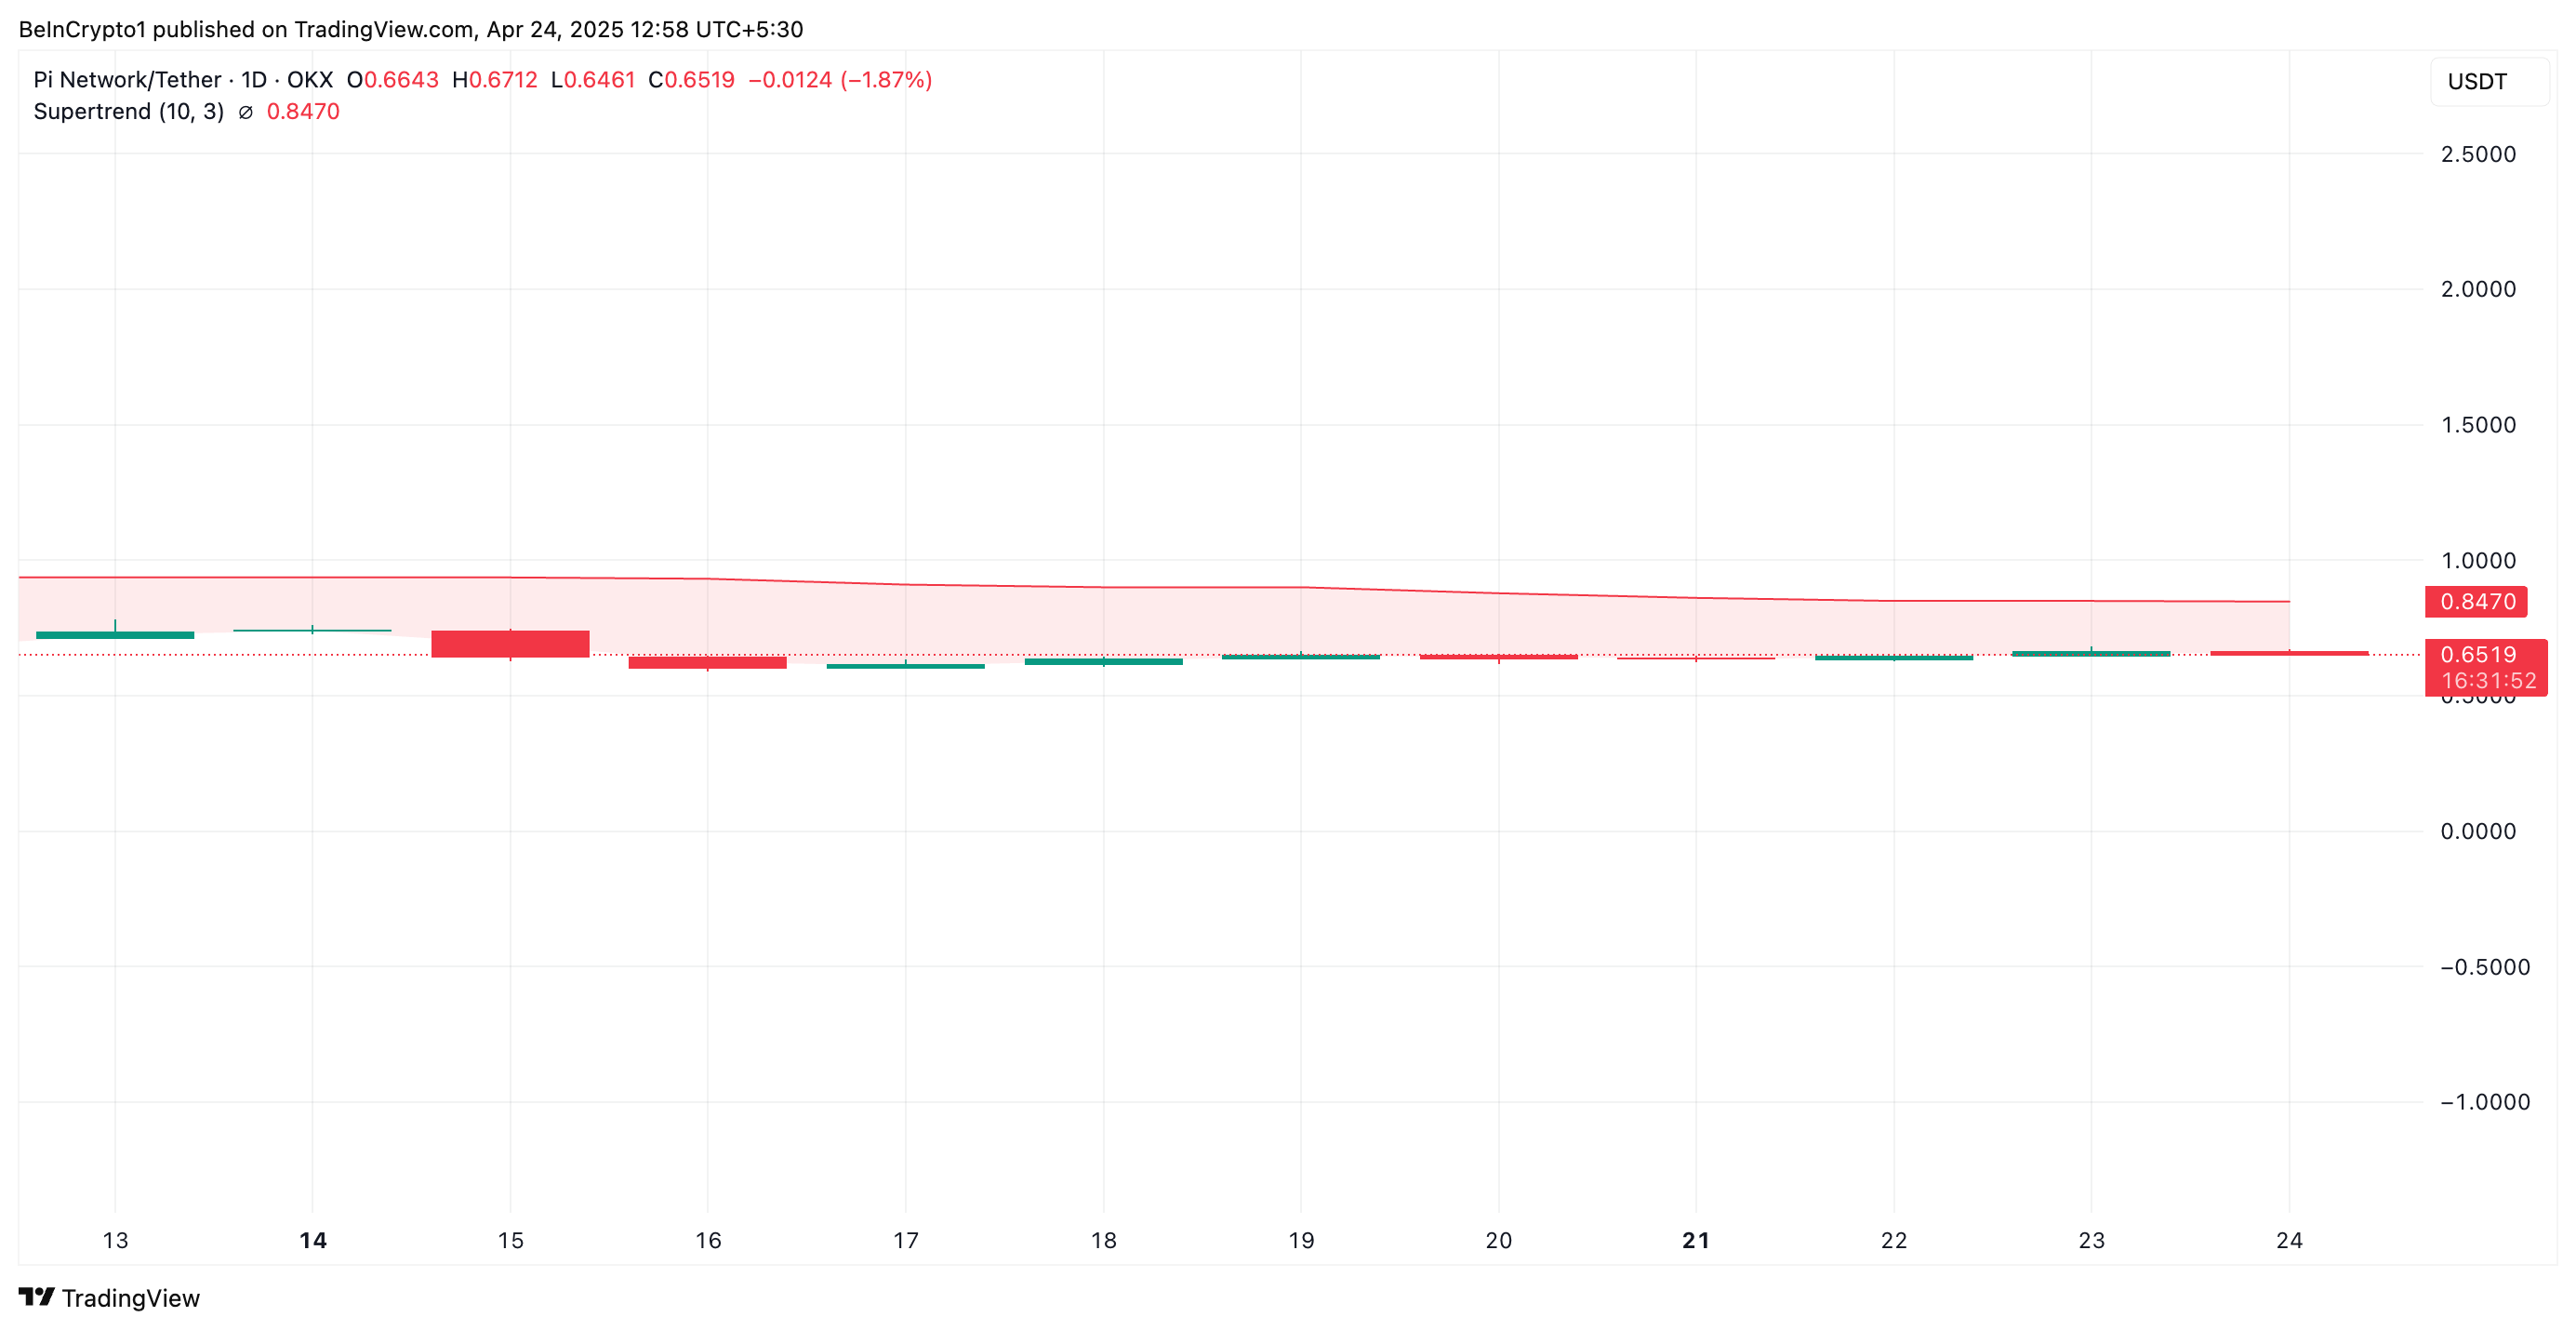
PI’s price has climbed 7% over the last seven days, signaling modest upward momentum. It currently trades at $0.65.
However, technical readings reveal that the rally largely lacks conviction from bullish traders, suggesting the price growth is more reflective of overall market growth than demand for PI.
PI Climbs, But Momentum Stalls
A key indicator supporting this outlook is the Relative Strength Index (RSI), which has remained largely flat despite the price uptick. This indicates a balance between PI’s buying and selling pressure, rather than a surge in bullish sentiment that typically accompanies sustainable rallies.
The RSI indicator measures an asset’s overbought and oversold market conditions. It ranges between 0 and 100. Values above 70 suggest that the asset is overbought and due for a price decline, while values under 30 indicate that the asset is oversold and may witness a rebound.
When it is flat like this, there is a balance between buying and selling pressure, with no clear momentum in either direction. This signals market indecision or consolidation, rather than a strong trend, despite PI’s price hike.
Further, PI’s Super Trend indicator, which continues to act as dynamic resistance above the token’s price, adds to the cautious outlook. This is currently at $0.85
The indicator helps traders identify the market’s direction by placing a line above or below the price chart based on the asset’s volatility.
As with PI, when an asset’s price trades below the Super Trend line, it signals a bearish trend, indicating that the market is in a downtrend and selling pressure is dominant.
As PI struggles to break above this level, the trend line reinforces bearish sentiment and suggests pushing the asset higher in the short term will be difficult.
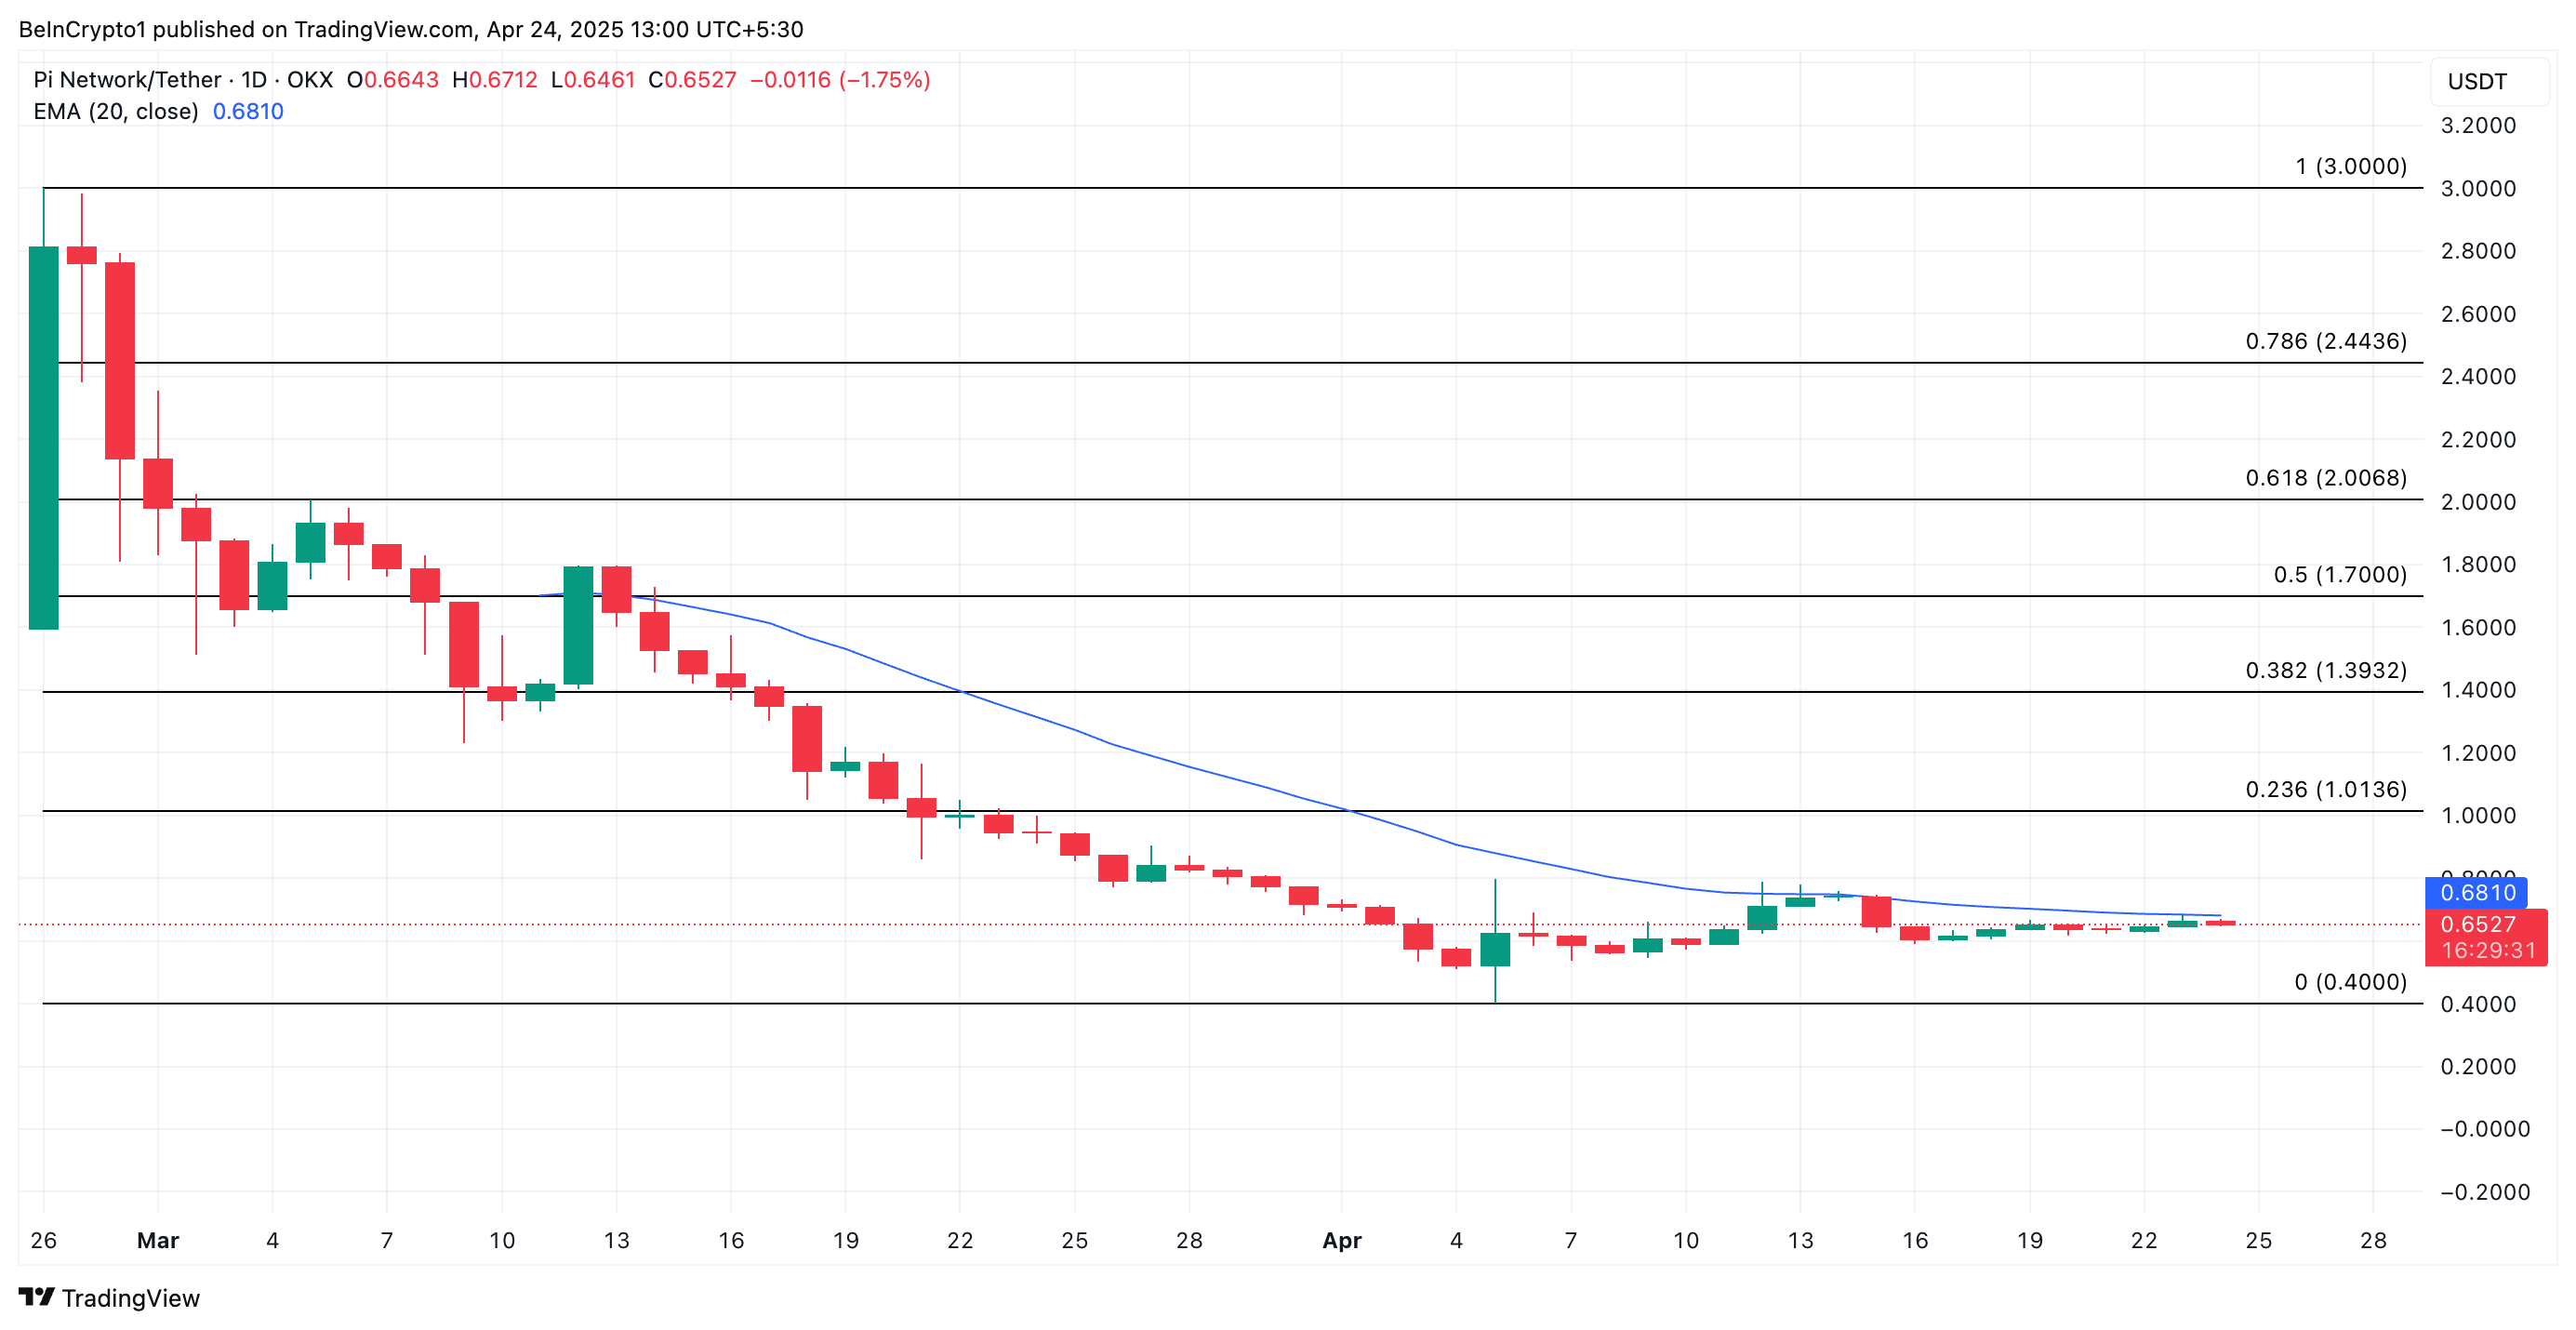
PI Risks Drop to $0.40 Without Renewed Demand
PI currently trades at $0.65, resting below its 20-day exponential moving average (EMA). This indicator measures an asset’s average price over the past 20 trading days, giving more weight to recent prices.
When the EMA is positioned above the asset’s current price, it signals a short-term downtrend, indicating that recent prices are lower than the average of the past 20 days. If demand wanes further, PI could extend its losses and revisit its all-time low of $0.40.