Hyperliquid users reported a brief outage today, primarily impacting the frontend. Several users were momentarily unable to withdraw funds, place, or close orders. The cause of this outage remains unclear.
Although the glitch was repaired within minutes, some community members reacted with FUD. Many feared unjust liquidations of their short positions, while others speculated that Hyperliquid’s recent growth caused the issue.
Hyperliquid’s Frontend Outage
Decentralized exchange Hyperliquid has been one of the most popular platforms among the crypto community in 2025. Despite its surging popularity, Hyperliquid has experienced a few bumps in the road.
Several high-profile trades, the whole James Wynn saga, and the JELLYJELLY short squeeze kept the platform in crypto headlines recently. Today, the exchange faced another minor setback.
Bad news: the Hyperliquid API is down
Good news: Hyperliquid appears to still be producing blocks
Bad news: you cannot short HYPE because all frontends are down
Good news: you also cannot get liquidated because the API is down (i actually don’t know if this is true) pic.twitter.com/NmIeD2kx98
According to Discord messages from Hyperliquid developers, this outage only lasted a few minutes. Nonetheless, the fan community showed displeasure with the decentralized exchange, worrying about their accounts.
Some accounts even theorized that this mishap could disrupt billions in short positions. So far, however, those fears seem overblown.
The platform didn’t release any public statements on the matter, but given the nature of the outage, it was likely an API issue.
Social media reports suggest that several customers couldn’t place or close orders, the entire frontend seemed dysfunctional, and more.
However, Hyperliquid continued producing blocks during the outage, and it doesn’t look like the backend suffered. The malfunction only lasted a few minutes, not causing any lasting damage.
Technical outages in crypto are not new, especially among new blockchain networks and platforms.
Moreover, the exchange quickly fixed the problems from other crises this year. For all we know, today’s outage could give Hyperliquid developers a better chance to future-proof their frontend.
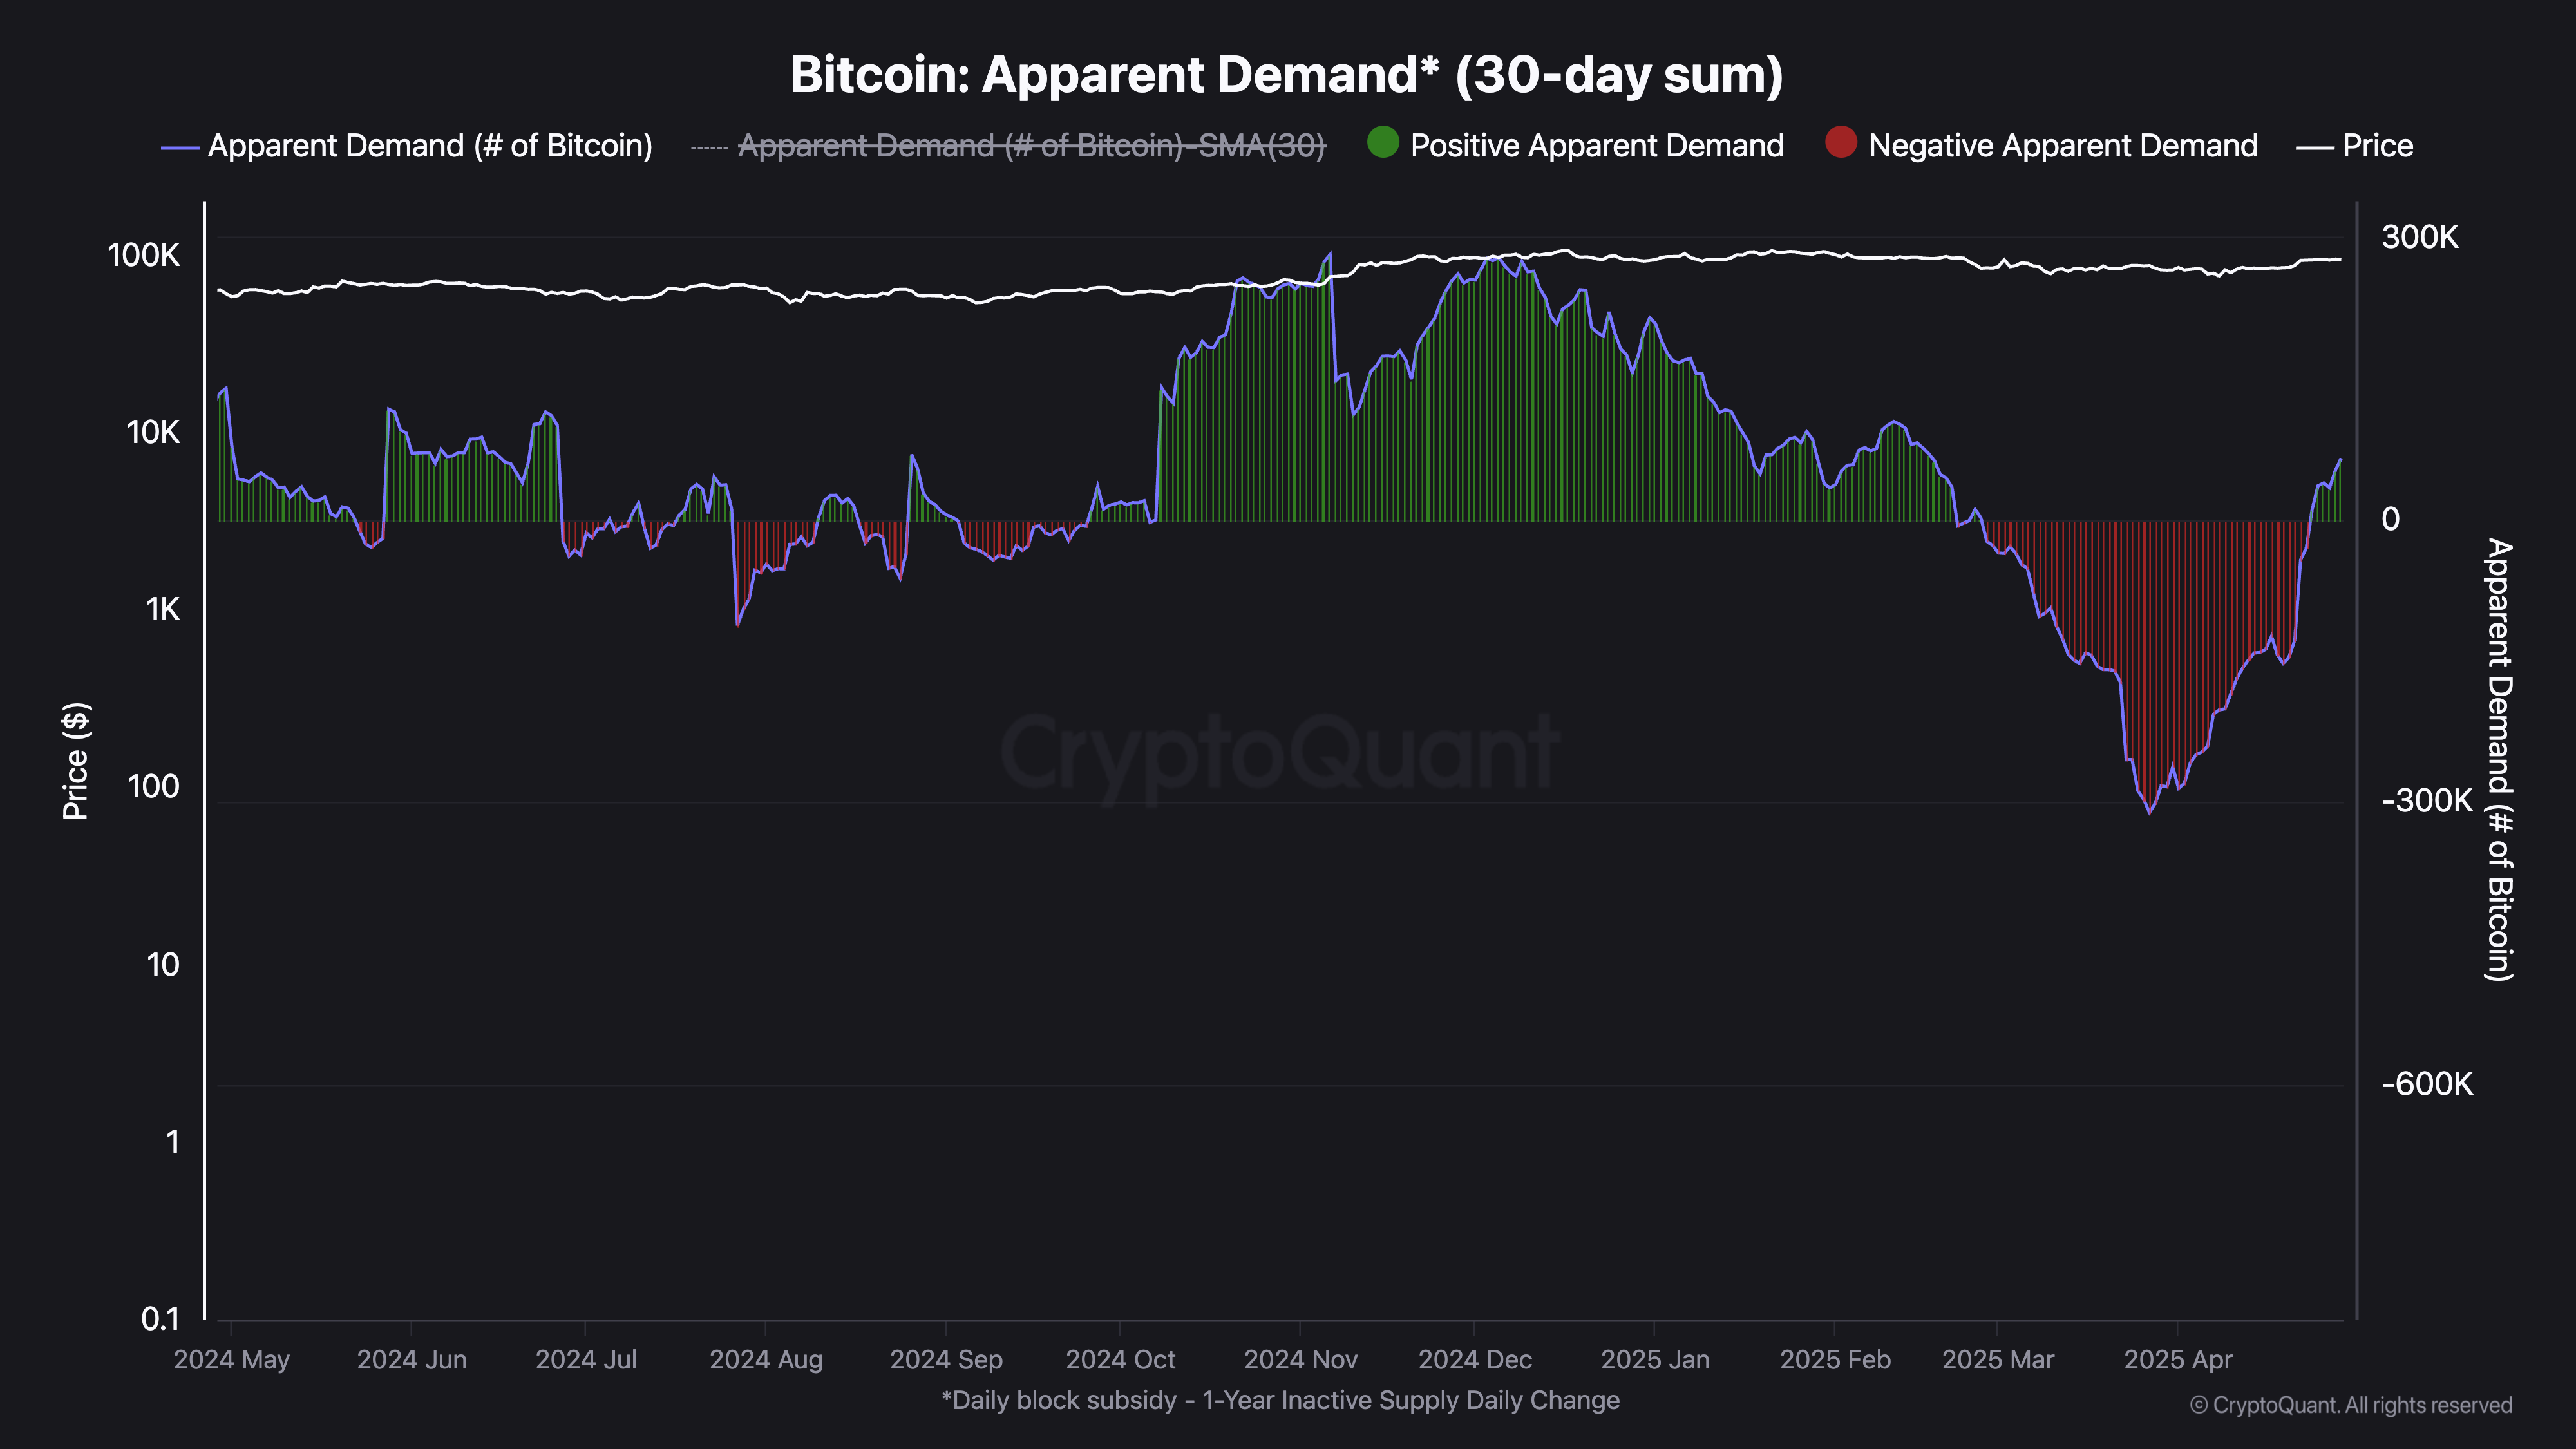
Bitcoin (BTC) enters May 2025 with renewed momentum, gaining over 14% in the past 30 days and trading just 6.3% below the key $100,000 mark. Behind the price action, Bitcoin’s apparent demand has turned positive for the first time since late February, signaling a shift in on-chain behavior.
However, fresh inflows—especially from US-based ETFs—remain subdued compared to 2024 levels, suggesting institutional conviction has yet to fully return. According to MEXC COO Tracy Jin, if current conditions hold, a summer rally toward $150,000 is plausible, with sentiment turning increasingly bullish.
Bitcoin Apparent Demand Turns Positive, But Fresh Inflows Still Lacking
Bitcoin’s apparent demand has shown clear signs of recovery recently, rising to 65,000 BTC over the past 30 days. This marks a sharp rebound from the trough on March 27, when apparent demand—defined as the net 30-day change in holdings across all investor cohorts—reached a deeply negative level of -311,000 BTC.
Apparent demand reflects the aggregated balance shifts across wallets and provides insight into whether capital is entering or exiting the Bitcoin network.
While the current demand level is still well below earlier peaks in 2024, a meaningful inflection point occurred on April 24: Bitcoin’s apparent demand turned positive and has remained positive for six consecutive days after nearly two months of sustained outflows.
Despite this improvement, broader demand momentum remains weak.
The continued lack of significant new inflows suggests that most of the recent accumulation may be driven by existing holders rather than fresh capital entering the market.
For Bitcoin to mount a sustainable rally, both apparent demand and demand momentum must show consistent and synchronized growth. Until that alignment occurs, the current stabilization may not support a strong or prolonged price breakout.
US Spot Bitcoin ETF Inflows Still Far Below 2024 Levels
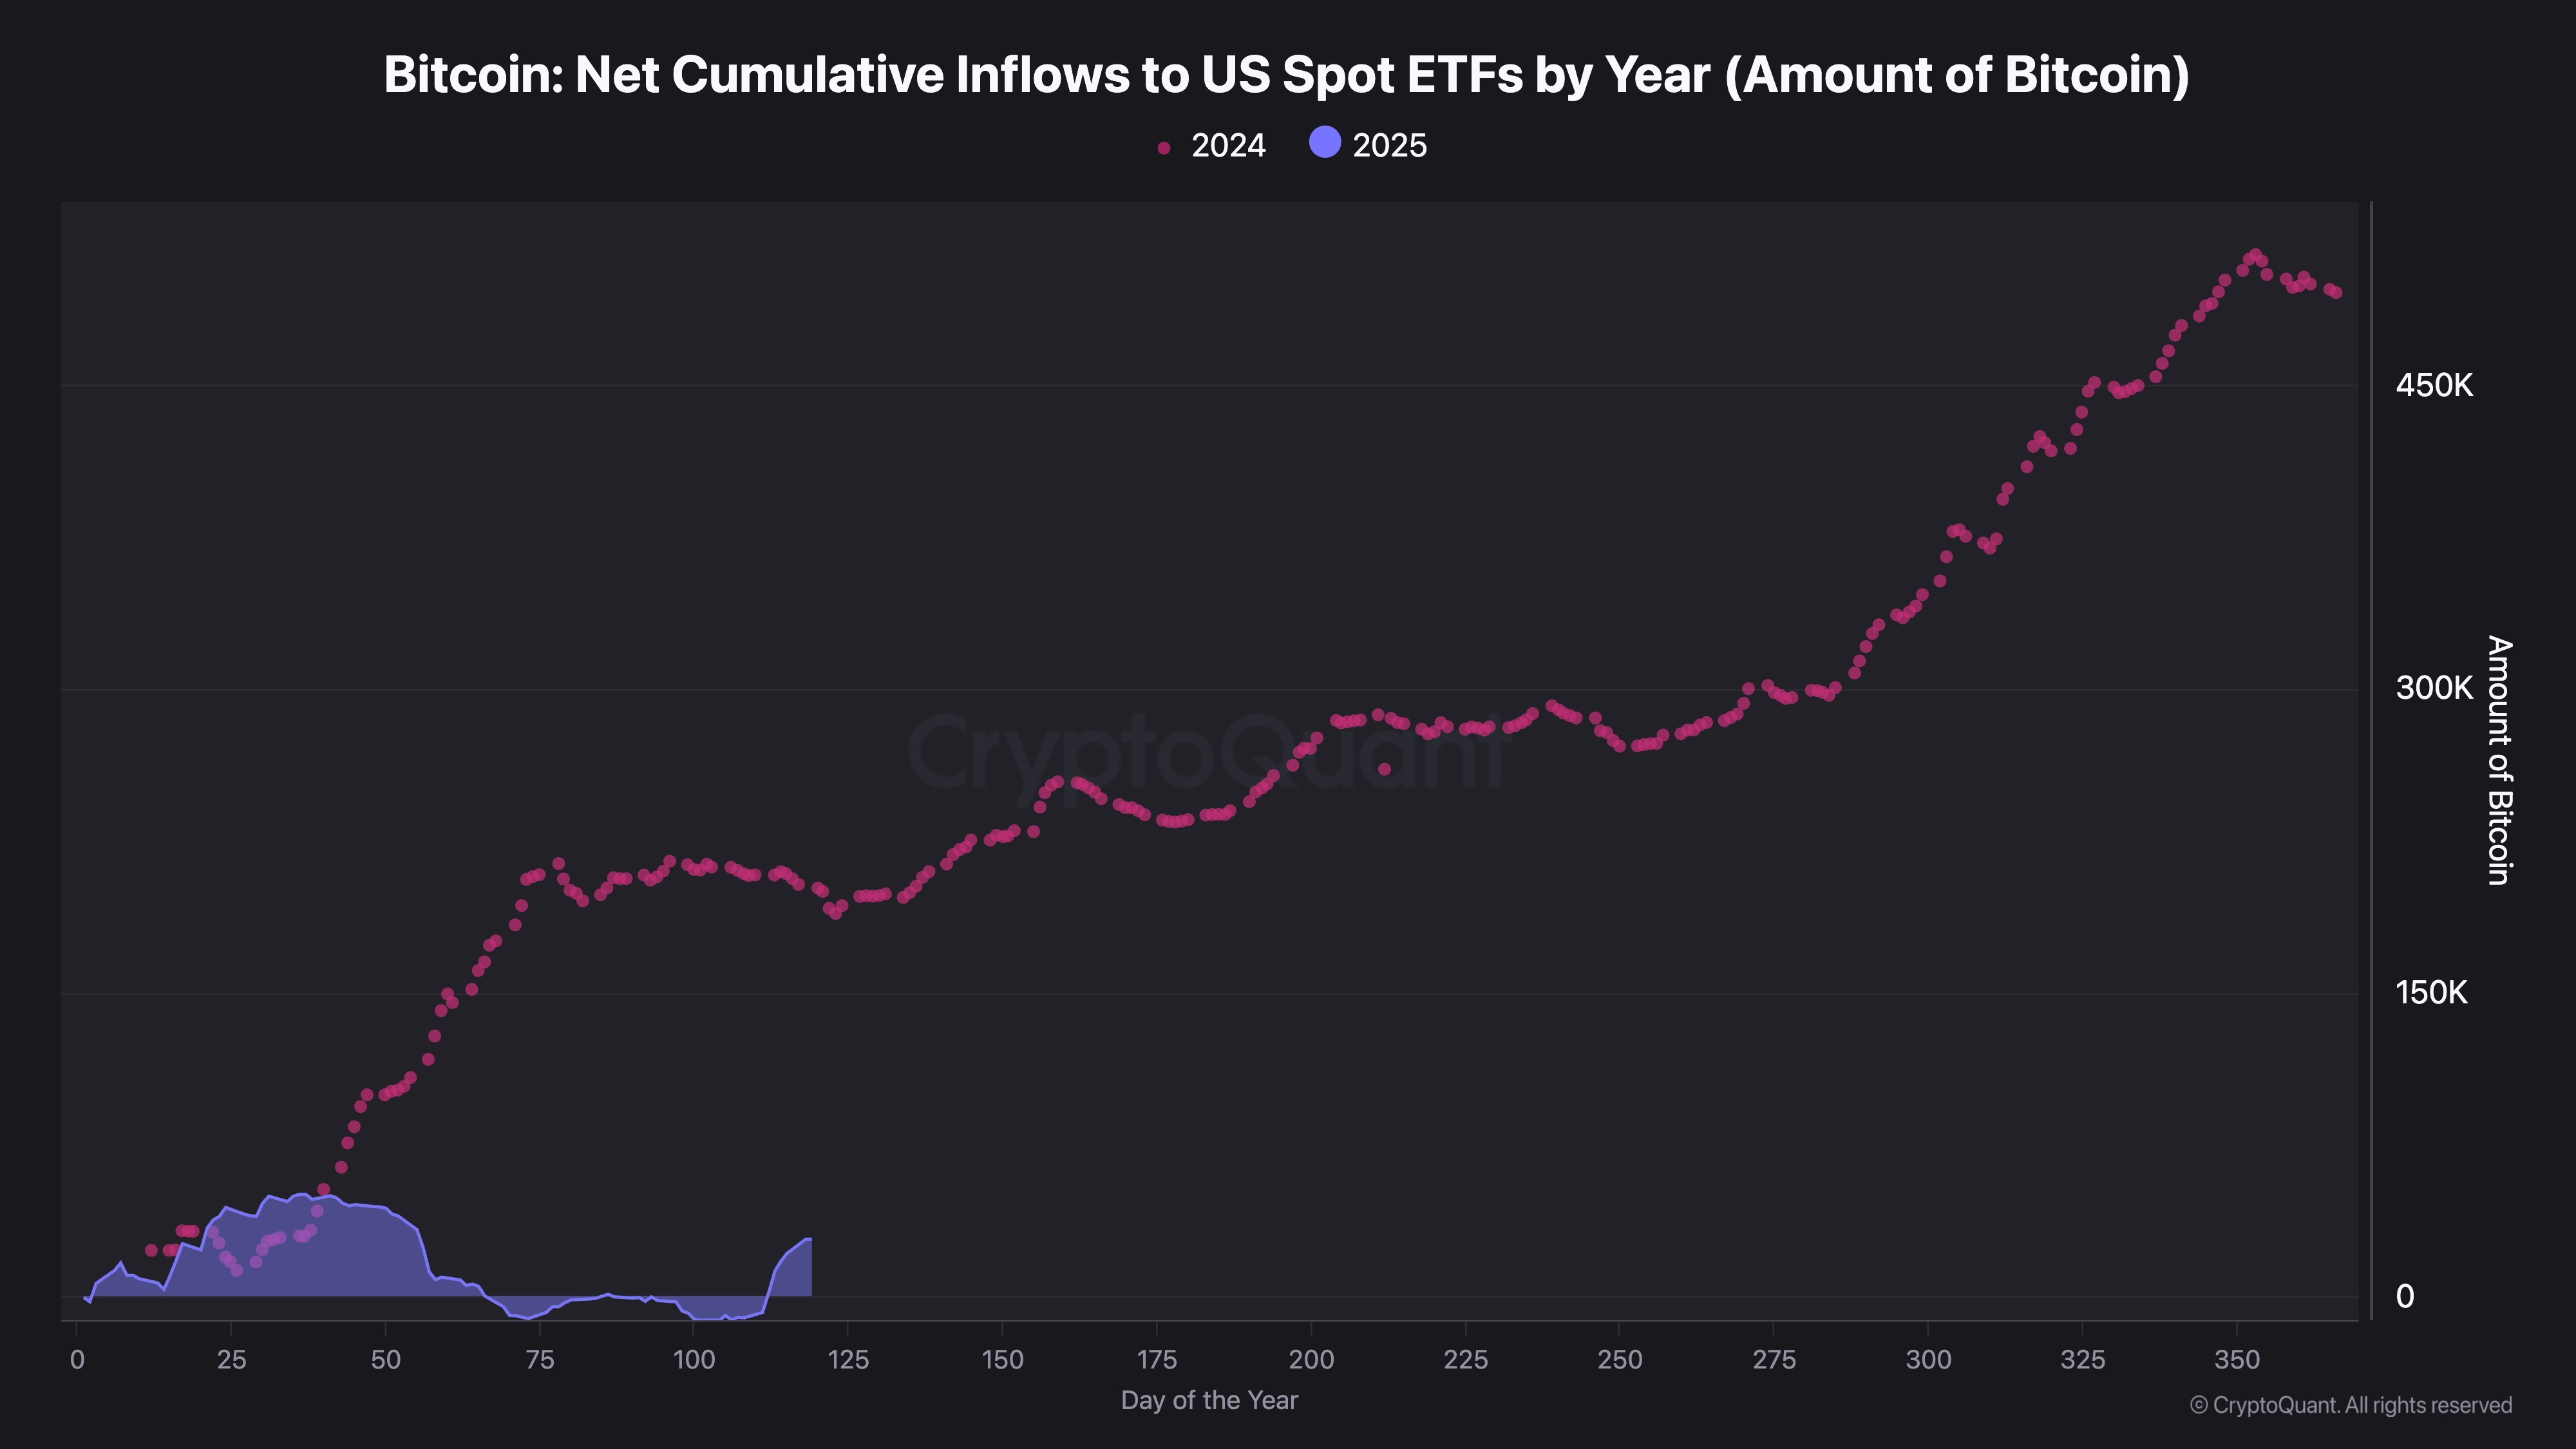
Bitcoin purchases from U.S.-based ETFs have remained largely flat since late March, fluctuating between daily net flows of -5,000 to +3,000 BTC.
This activity level sharply contrasts with the strong inflows seen in late 2024, when daily purchases frequently exceeded 8,000 BTC and contributed to Bitcoin’s initial rally toward $100,000.
So far in 2025, BTC ETFs have collectively accumulated a net total of 28,000 BTC, well below the more than 200,000 BTC they had purchased by this point last year.
This decline shows a slowdown in institutional demand, which has historically been key in driving major price movements.
Bitcoin: Net Cumulative Inflows to US Spot ETFs by Year. Source: CryptoQuant.
There are early signs of a modest rebound, with ETF inflows beginning to tick higher recently. However, current levels remain insufficient to fuel a sustained uptrend.
ETF activity is often viewed as a proxy for institutional conviction, and a notable increase in purchases would likely signal renewed confidence in Bitcoin’s medium-term trajectory.
Until those inflows return in force, the broader market may struggle to generate the momentum needed for a prolonged rally.
Bitcoin Nears $100,000 as Momentum Builds Despite Macro Pressure
Bitcoin price has gained over 14% in the past 30 days, rebounding strongly after dipping below $75,000 in April.
This renewed momentum comes as BTC shows relative resilience amid broader macroeconomic volatility and policy-driven pressures, including Trump’s tariff measures that have weighed on risk assets.
While the entire crypto market has felt the impact, Bitcoin appears to be detaching slightly, showing less sensitivity to these external shocks than other digital assets.
BTC now sits just 6.3% below the $100,000 mark and remains under 17% from a potential move toward $110,000. According to Tracy Jin, COO of MEXC, sentiment is turning positive again:
“Beyond immediate price action, the growing institutional appetite and shrinking supply mechanisms against the macroeconomic uncertainty backdrop point to a structural shift in Bitcoin’s role within the global financial market. BTC is used to hedging against inflation and the fiat-based financial model. Its liquidity, scalability, programmability, and global accessibility offer a reliable modern alternative to traditional financial instruments for many corporations,” Jin said.
According to Jin, a summer rally towards $150,000 is plausible. She stressed that the $95,000 range will likely become a launch point for the brewing decisive breakout above $100,000 in the coming days.
” Should global trade tensions stabilize further and institutional accumulation continues, a summer rally towards $150,000 is plausible, potentially extending towards $200,000 by 2026. Overall, the external background remains favorable for the continuation of the upward movement, especially given the growth of stock indices on Friday, which could support Bitcoin over the weekend.”
Solana has posted a 7% increase in the past 24 hours, aligning with the broader market’s recovery. While this surge may appear promising, technical and on-chain data suggest that the coin could face significant resistance.
Despite the recent rally, SOL risks shedding these gains and could fall below the $100 mark if bearish pressures dominate.
Solana’s Price Surge Lacks Momentum
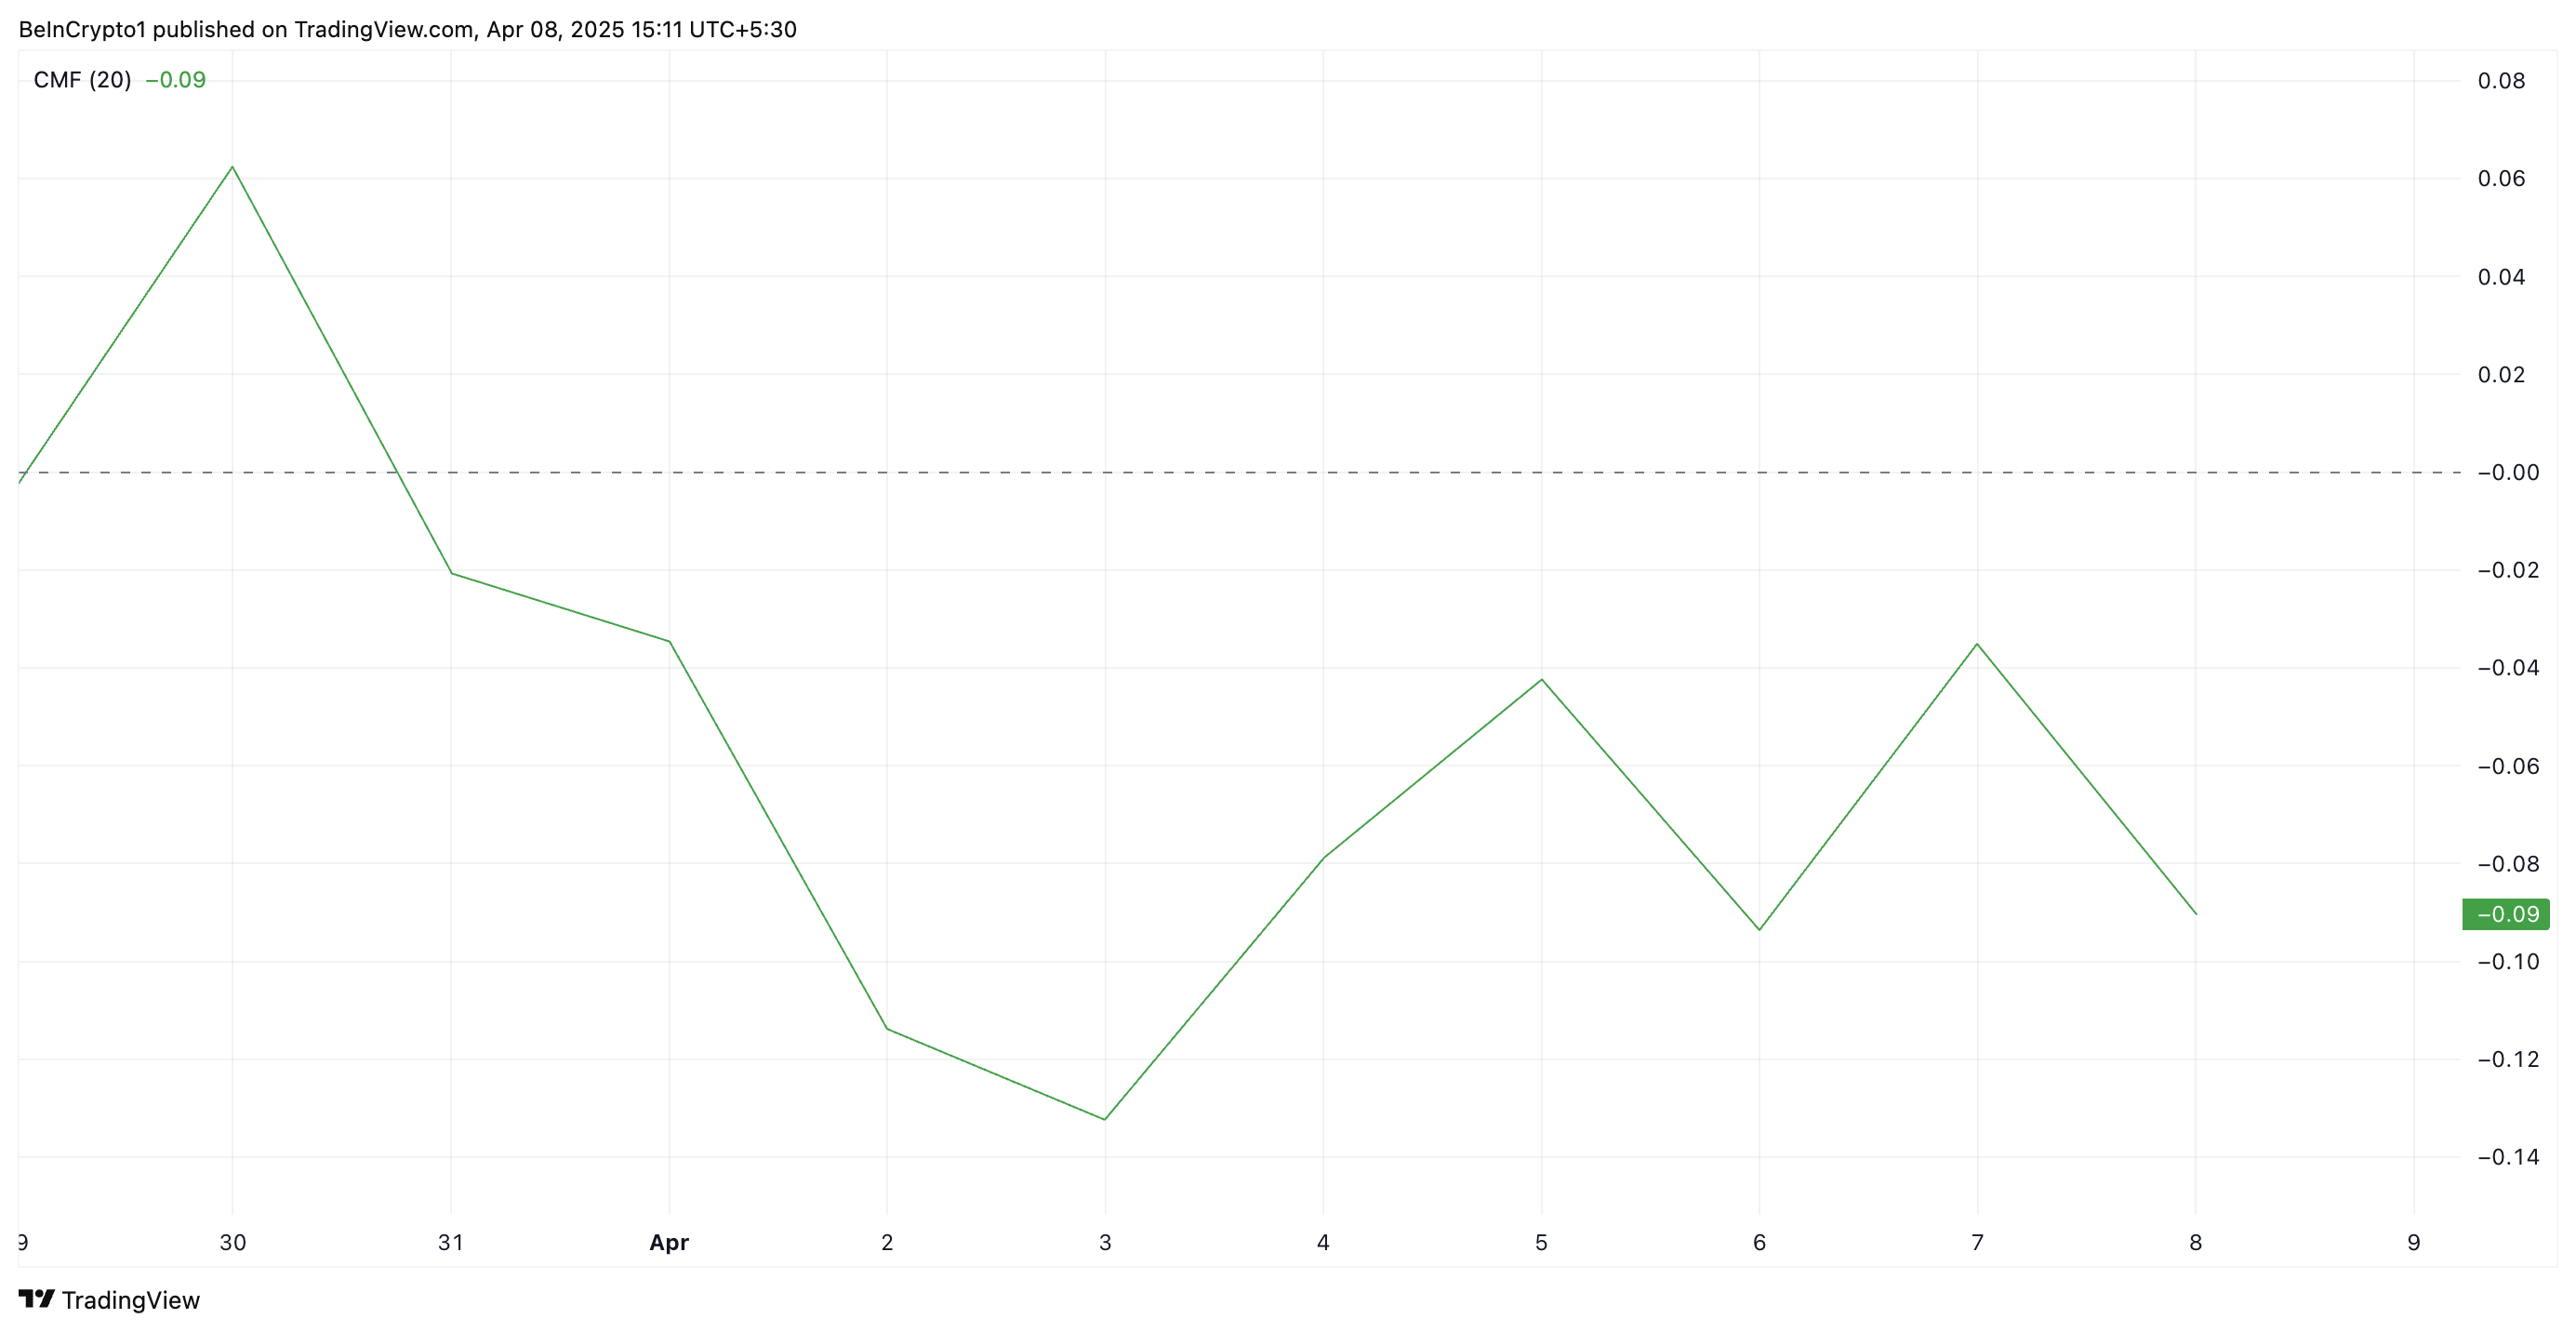
While impressive, SOL’s current rally largely reflects the broader market trend rather than demand for the altcoin. The bearish divergence formed by its Chaikin Money Flow (CMF) shows this.
At press time, SOL’s CMF is below the zero line at -0.09, indicating a lack of buying momentum among SOL market participants.
The CMF indicator measures money flow into and out of an asset. A bearish divergence emerges when the CMF is negative while the price is climbing. The divergence signals that despite the upward movement, there is more selling pressure than buying interest, suggesting weak bullish momentum.
This indicates that SOL’s current price rally may lack sustainability and could be at risk of reversing or stalling as new demand remains scarce.
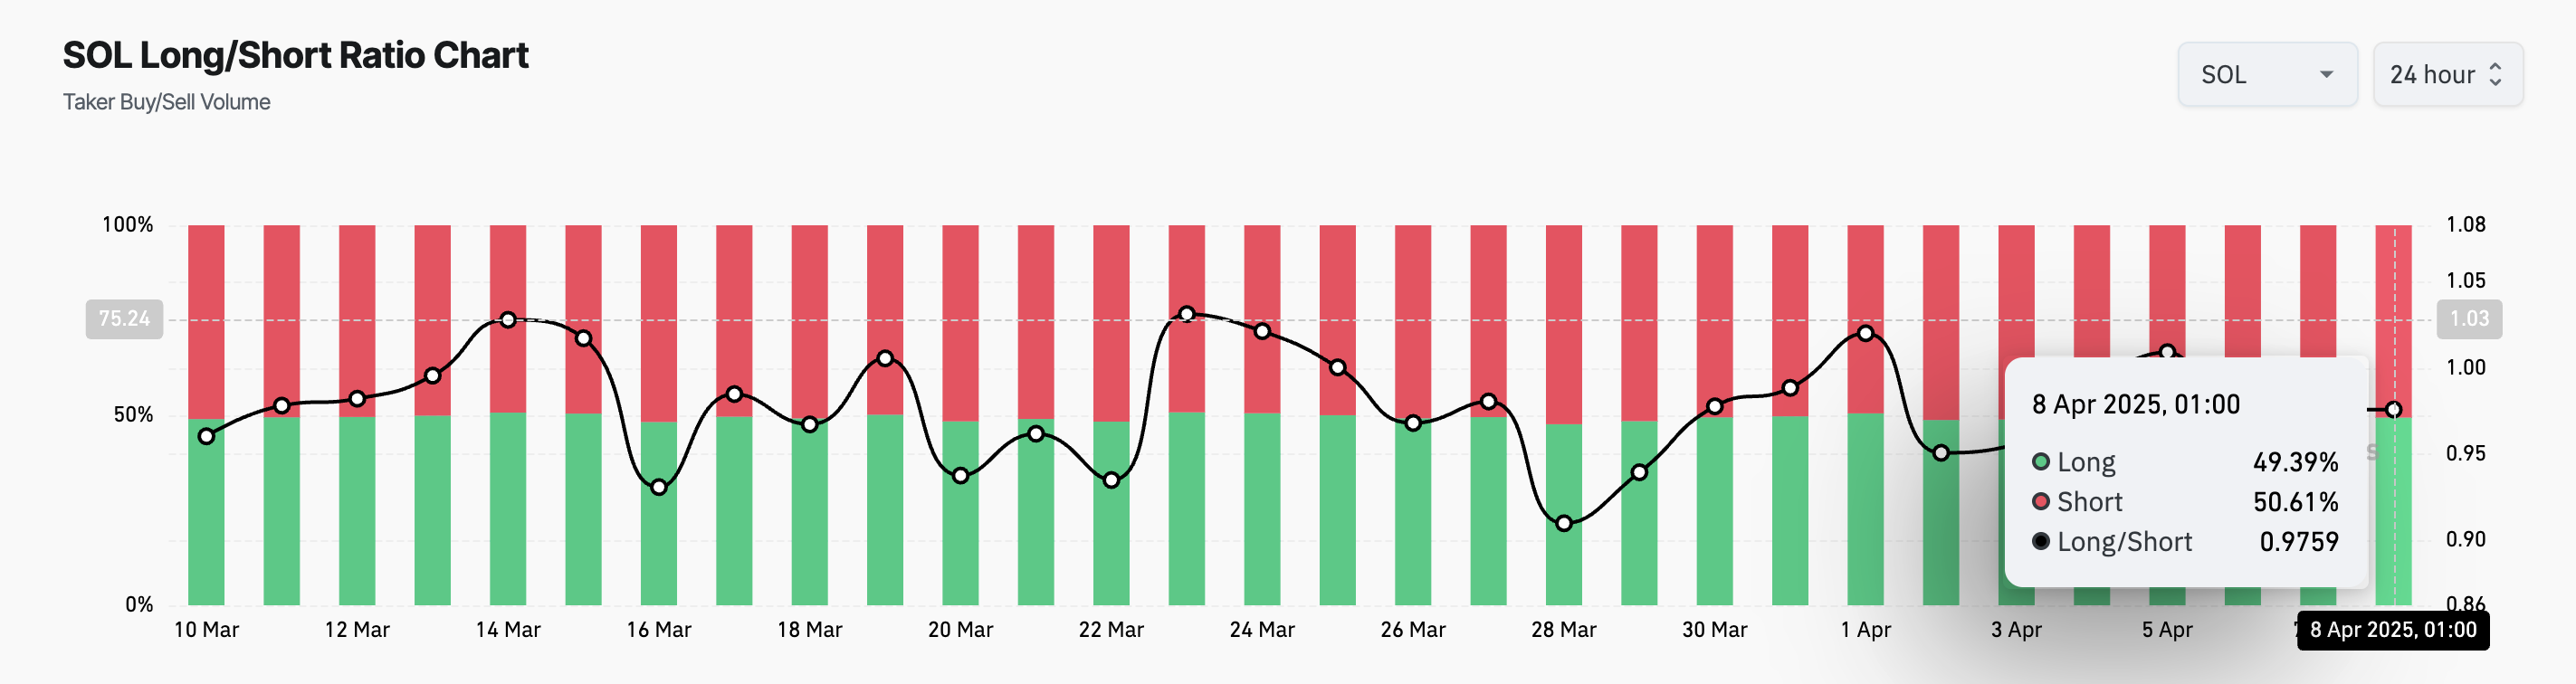
Further, the coin’s long/short ratio highlights that its market participants lean more heavily toward the short side. At press time, this stands at 0.97.
The long/short ratio measures the balance between long positions (betting on price increases) and short positions (betting on price decreases) in the market. When the ratio is below zero like this, it indicates that there are more short positions than long positions.
This suggests that bearish sentiment remains dominant in the SOL market, and its futures traders are anticipating a decline in the asset’s price.
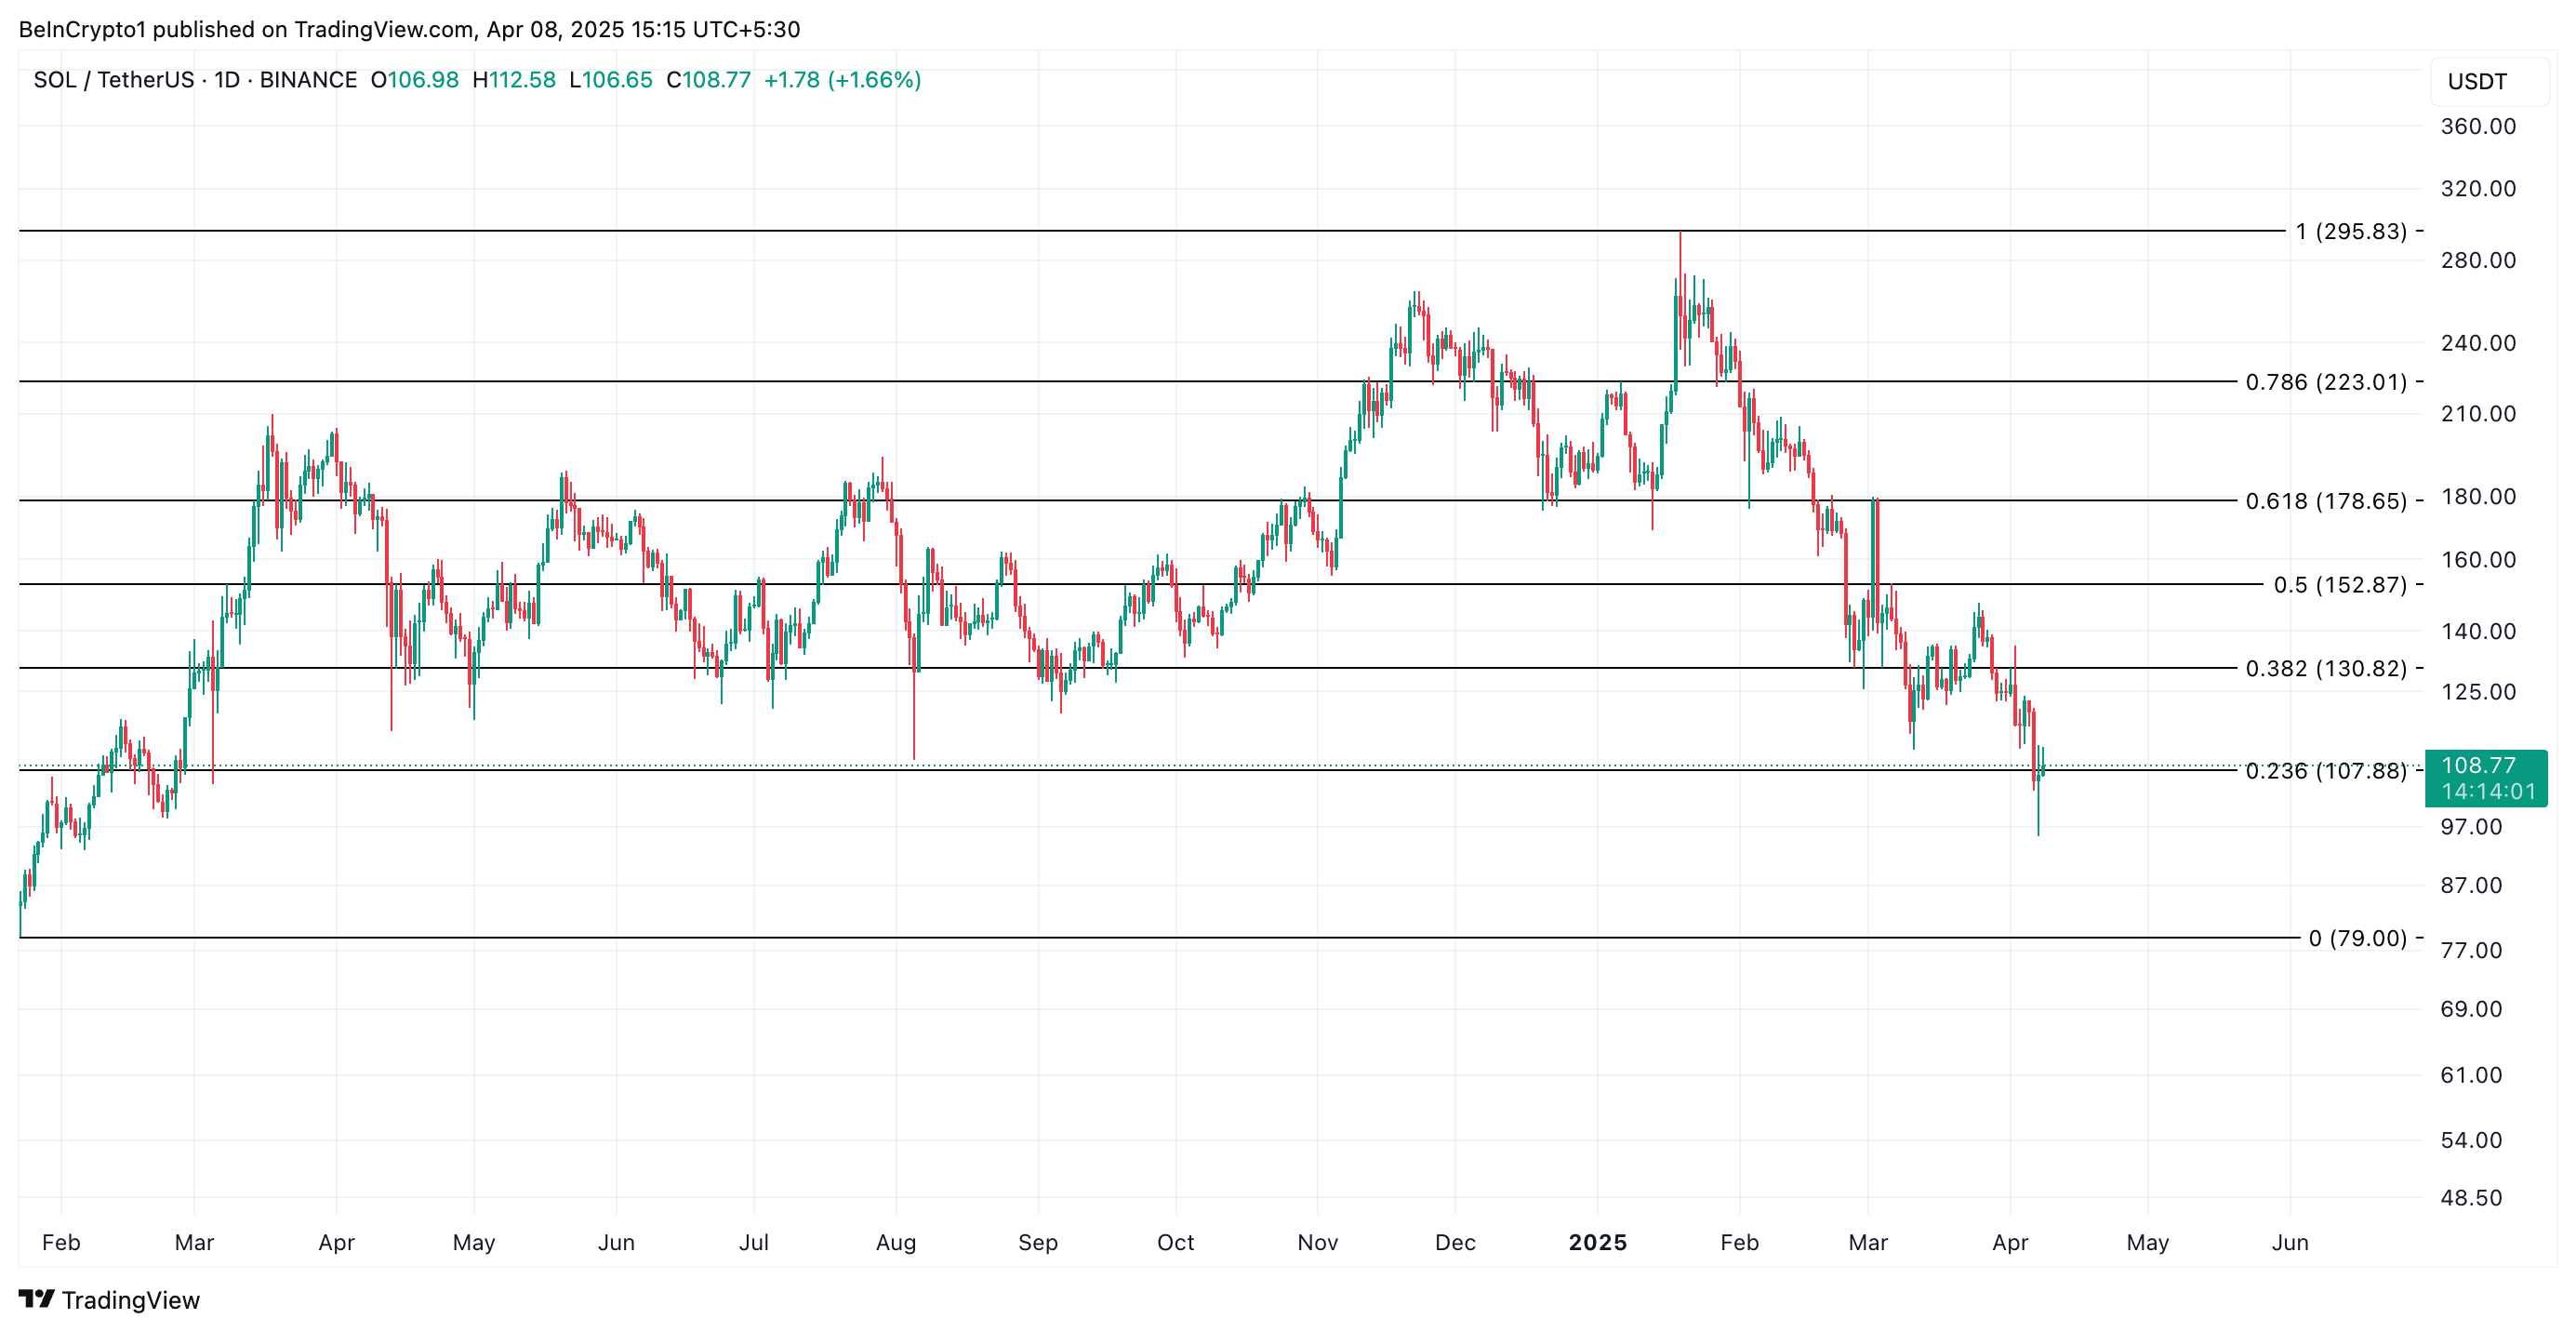
Solana in Crucial Zone: Will $95 Hold or Lead to a Steeper Decline?
During Monday’s intraday trading session, SOL plummeted to a 12-month low of $95.26. Although it has since rebounded to trade at $108.77 at press time, the lingering bearish bias leaves the coin at risk of shedding these gains.
If SOL witnesses a pullback, it could break below the support at $107.88. If it falls back below $100, the coin’s price could fall toward $79.
On the other hand, if the uptrend continues, backed by a surge in new demand, SOL’s price could breach the resistance at $111.06 and climb toward $130.82.