OP, the native token of a Layer-2 Ethereum scaling solution Optimism, is seeing strong 10% upside, following the latest listing on South Korea’s crypto exchange Upbit. This new listing has resulted in a massive liquidity boost, pushing the Optimism price above $0.80 with daily trading volumes shooting 200% to more than $340 million. Optimism Price
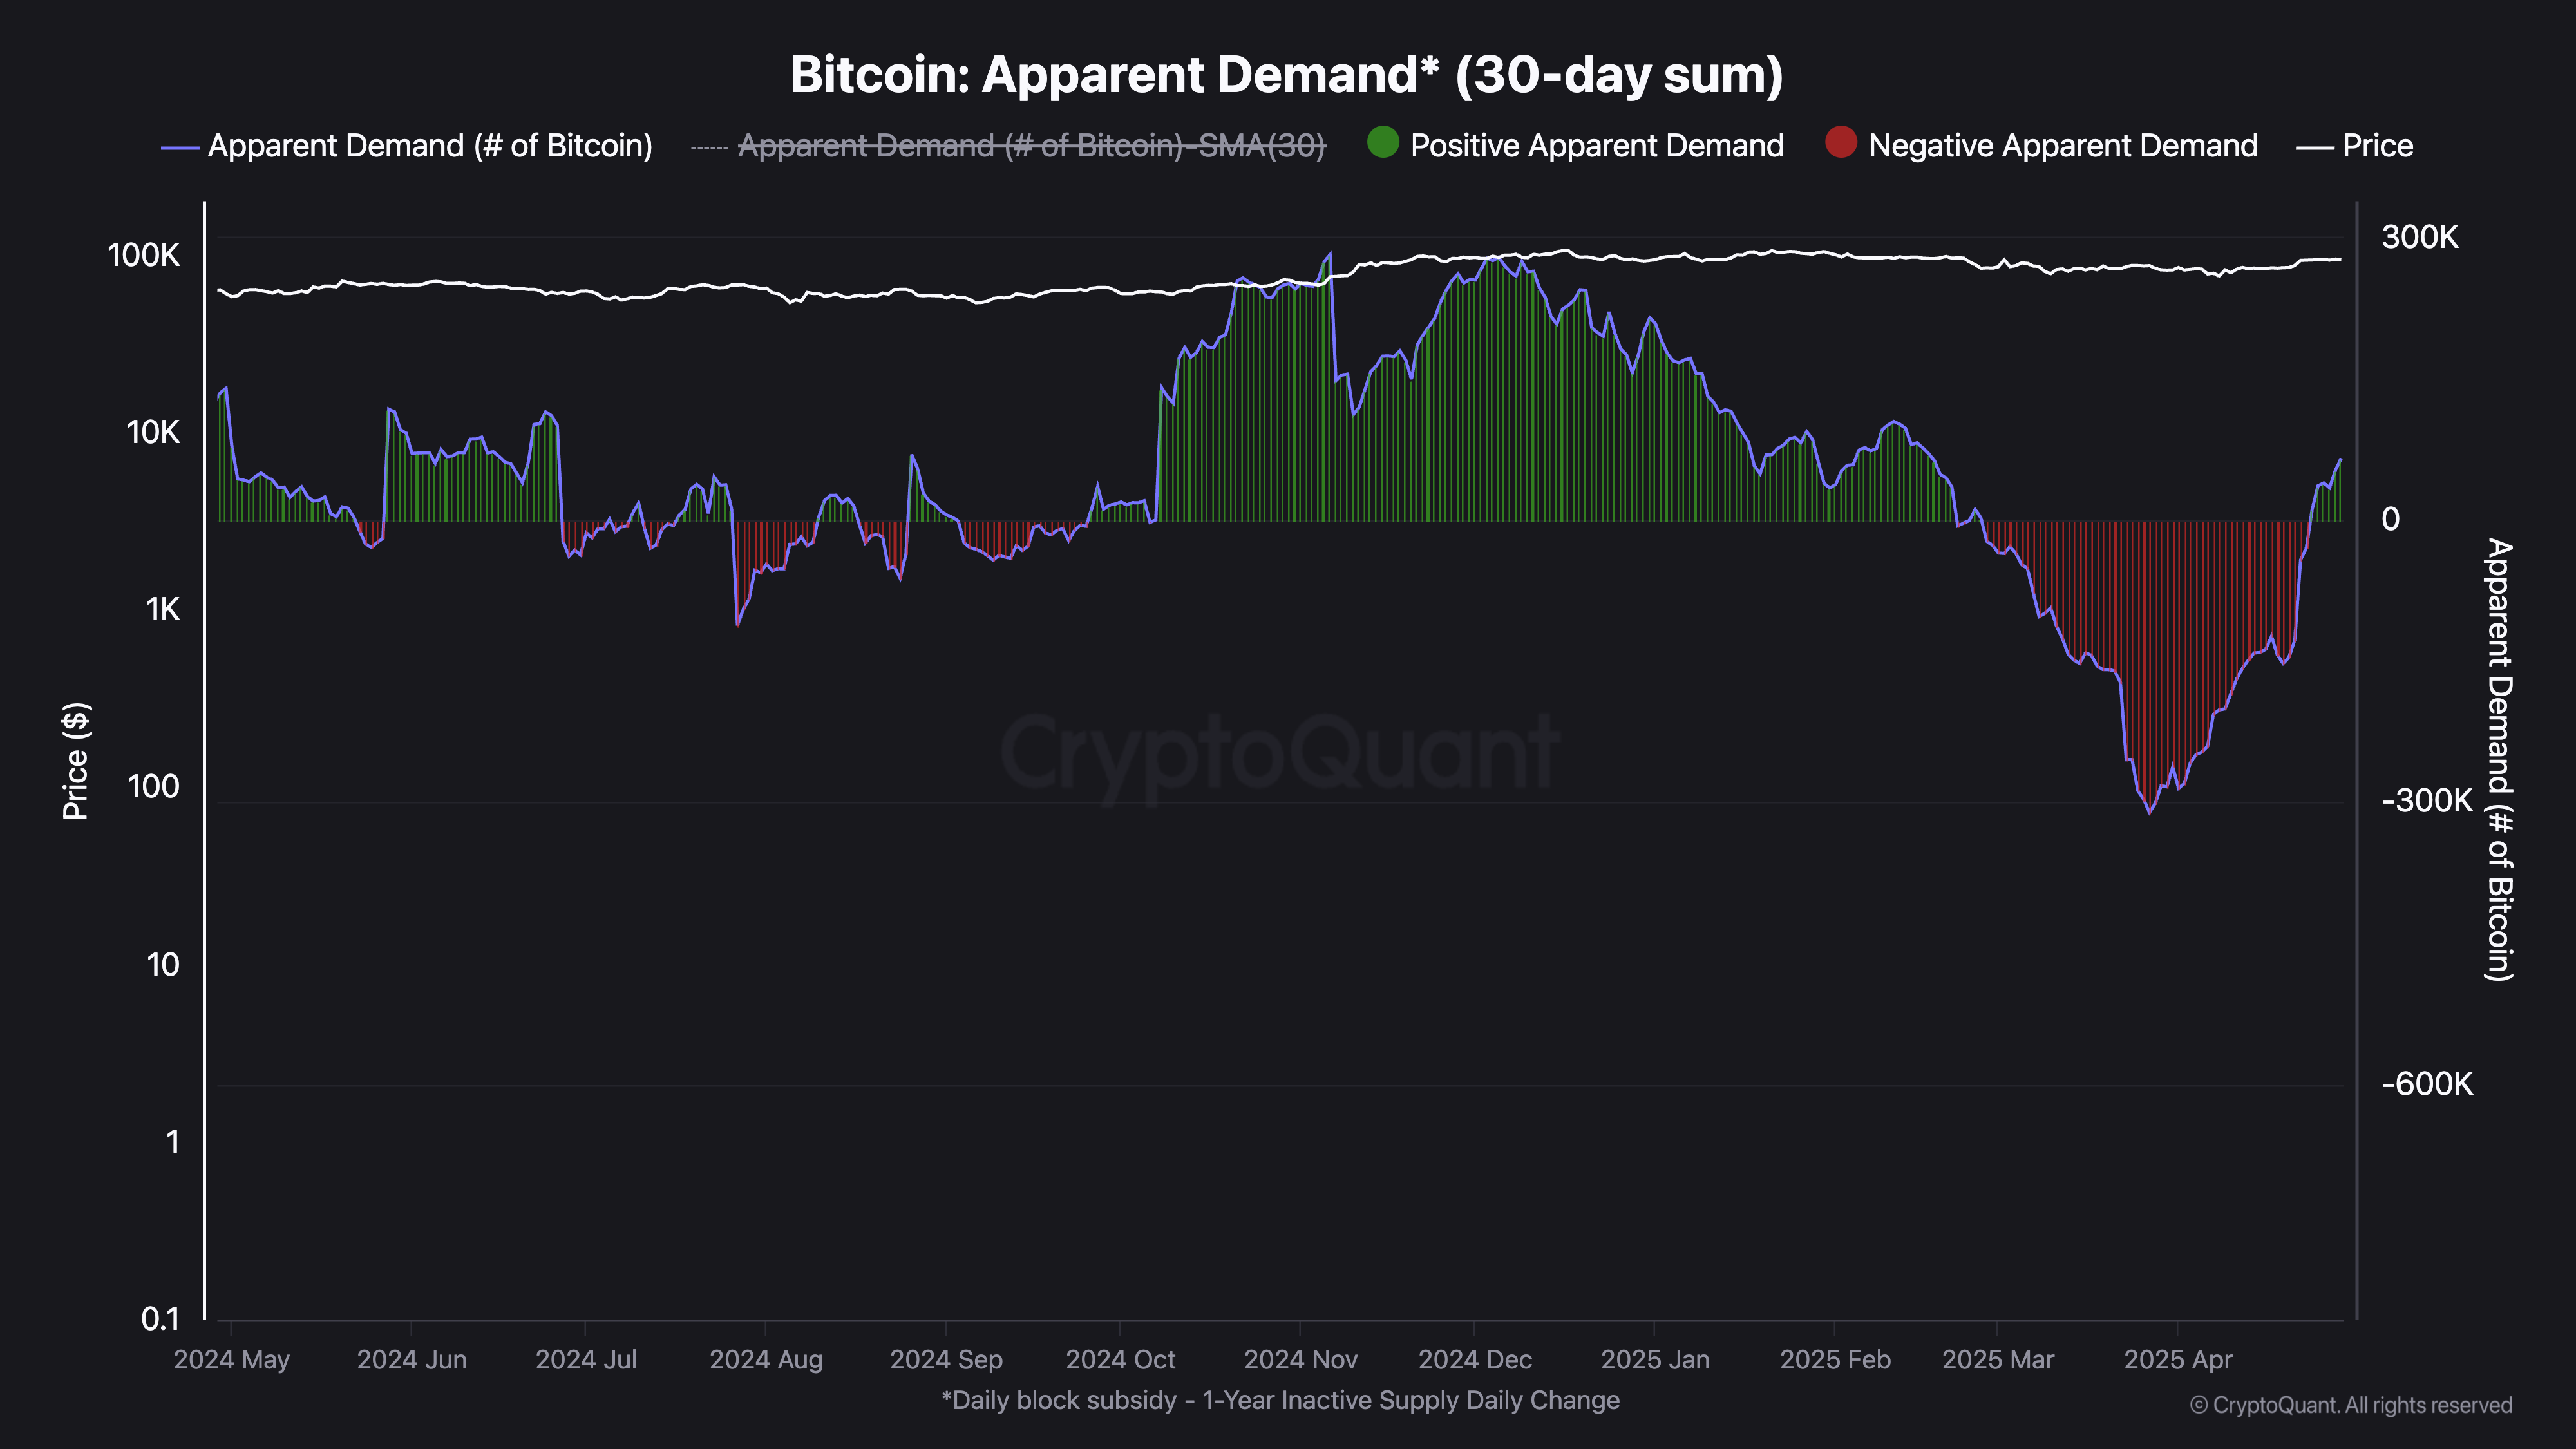
Bitcoin (BTC) enters May 2025 with renewed momentum, gaining over 14% in the past 30 days and trading just 6.3% below the key $100,000 mark. Behind the price action, Bitcoin’s apparent demand has turned positive for the first time since late February, signaling a shift in on-chain behavior.
However, fresh inflows—especially from US-based ETFs—remain subdued compared to 2024 levels, suggesting institutional conviction has yet to fully return. According to MEXC COO Tracy Jin, if current conditions hold, a summer rally toward $150,000 is plausible, with sentiment turning increasingly bullish.
Bitcoin Apparent Demand Turns Positive, But Fresh Inflows Still Lacking
Bitcoin’s apparent demand has shown clear signs of recovery recently, rising to 65,000 BTC over the past 30 days. This marks a sharp rebound from the trough on March 27, when apparent demand—defined as the net 30-day change in holdings across all investor cohorts—reached a deeply negative level of -311,000 BTC.
Apparent demand reflects the aggregated balance shifts across wallets and provides insight into whether capital is entering or exiting the Bitcoin network.
While the current demand level is still well below earlier peaks in 2024, a meaningful inflection point occurred on April 24: Bitcoin’s apparent demand turned positive and has remained positive for six consecutive days after nearly two months of sustained outflows.
Despite this improvement, broader demand momentum remains weak.
The continued lack of significant new inflows suggests that most of the recent accumulation may be driven by existing holders rather than fresh capital entering the market.
For Bitcoin to mount a sustainable rally, both apparent demand and demand momentum must show consistent and synchronized growth. Until that alignment occurs, the current stabilization may not support a strong or prolonged price breakout.
US Spot Bitcoin ETF Inflows Still Far Below 2024 Levels
Bitcoin purchases from U.S.-based ETFs have remained largely flat since late March, fluctuating between daily net flows of -5,000 to +3,000 BTC.
This activity level sharply contrasts with the strong inflows seen in late 2024, when daily purchases frequently exceeded 8,000 BTC and contributed to Bitcoin’s initial rally toward $100,000.
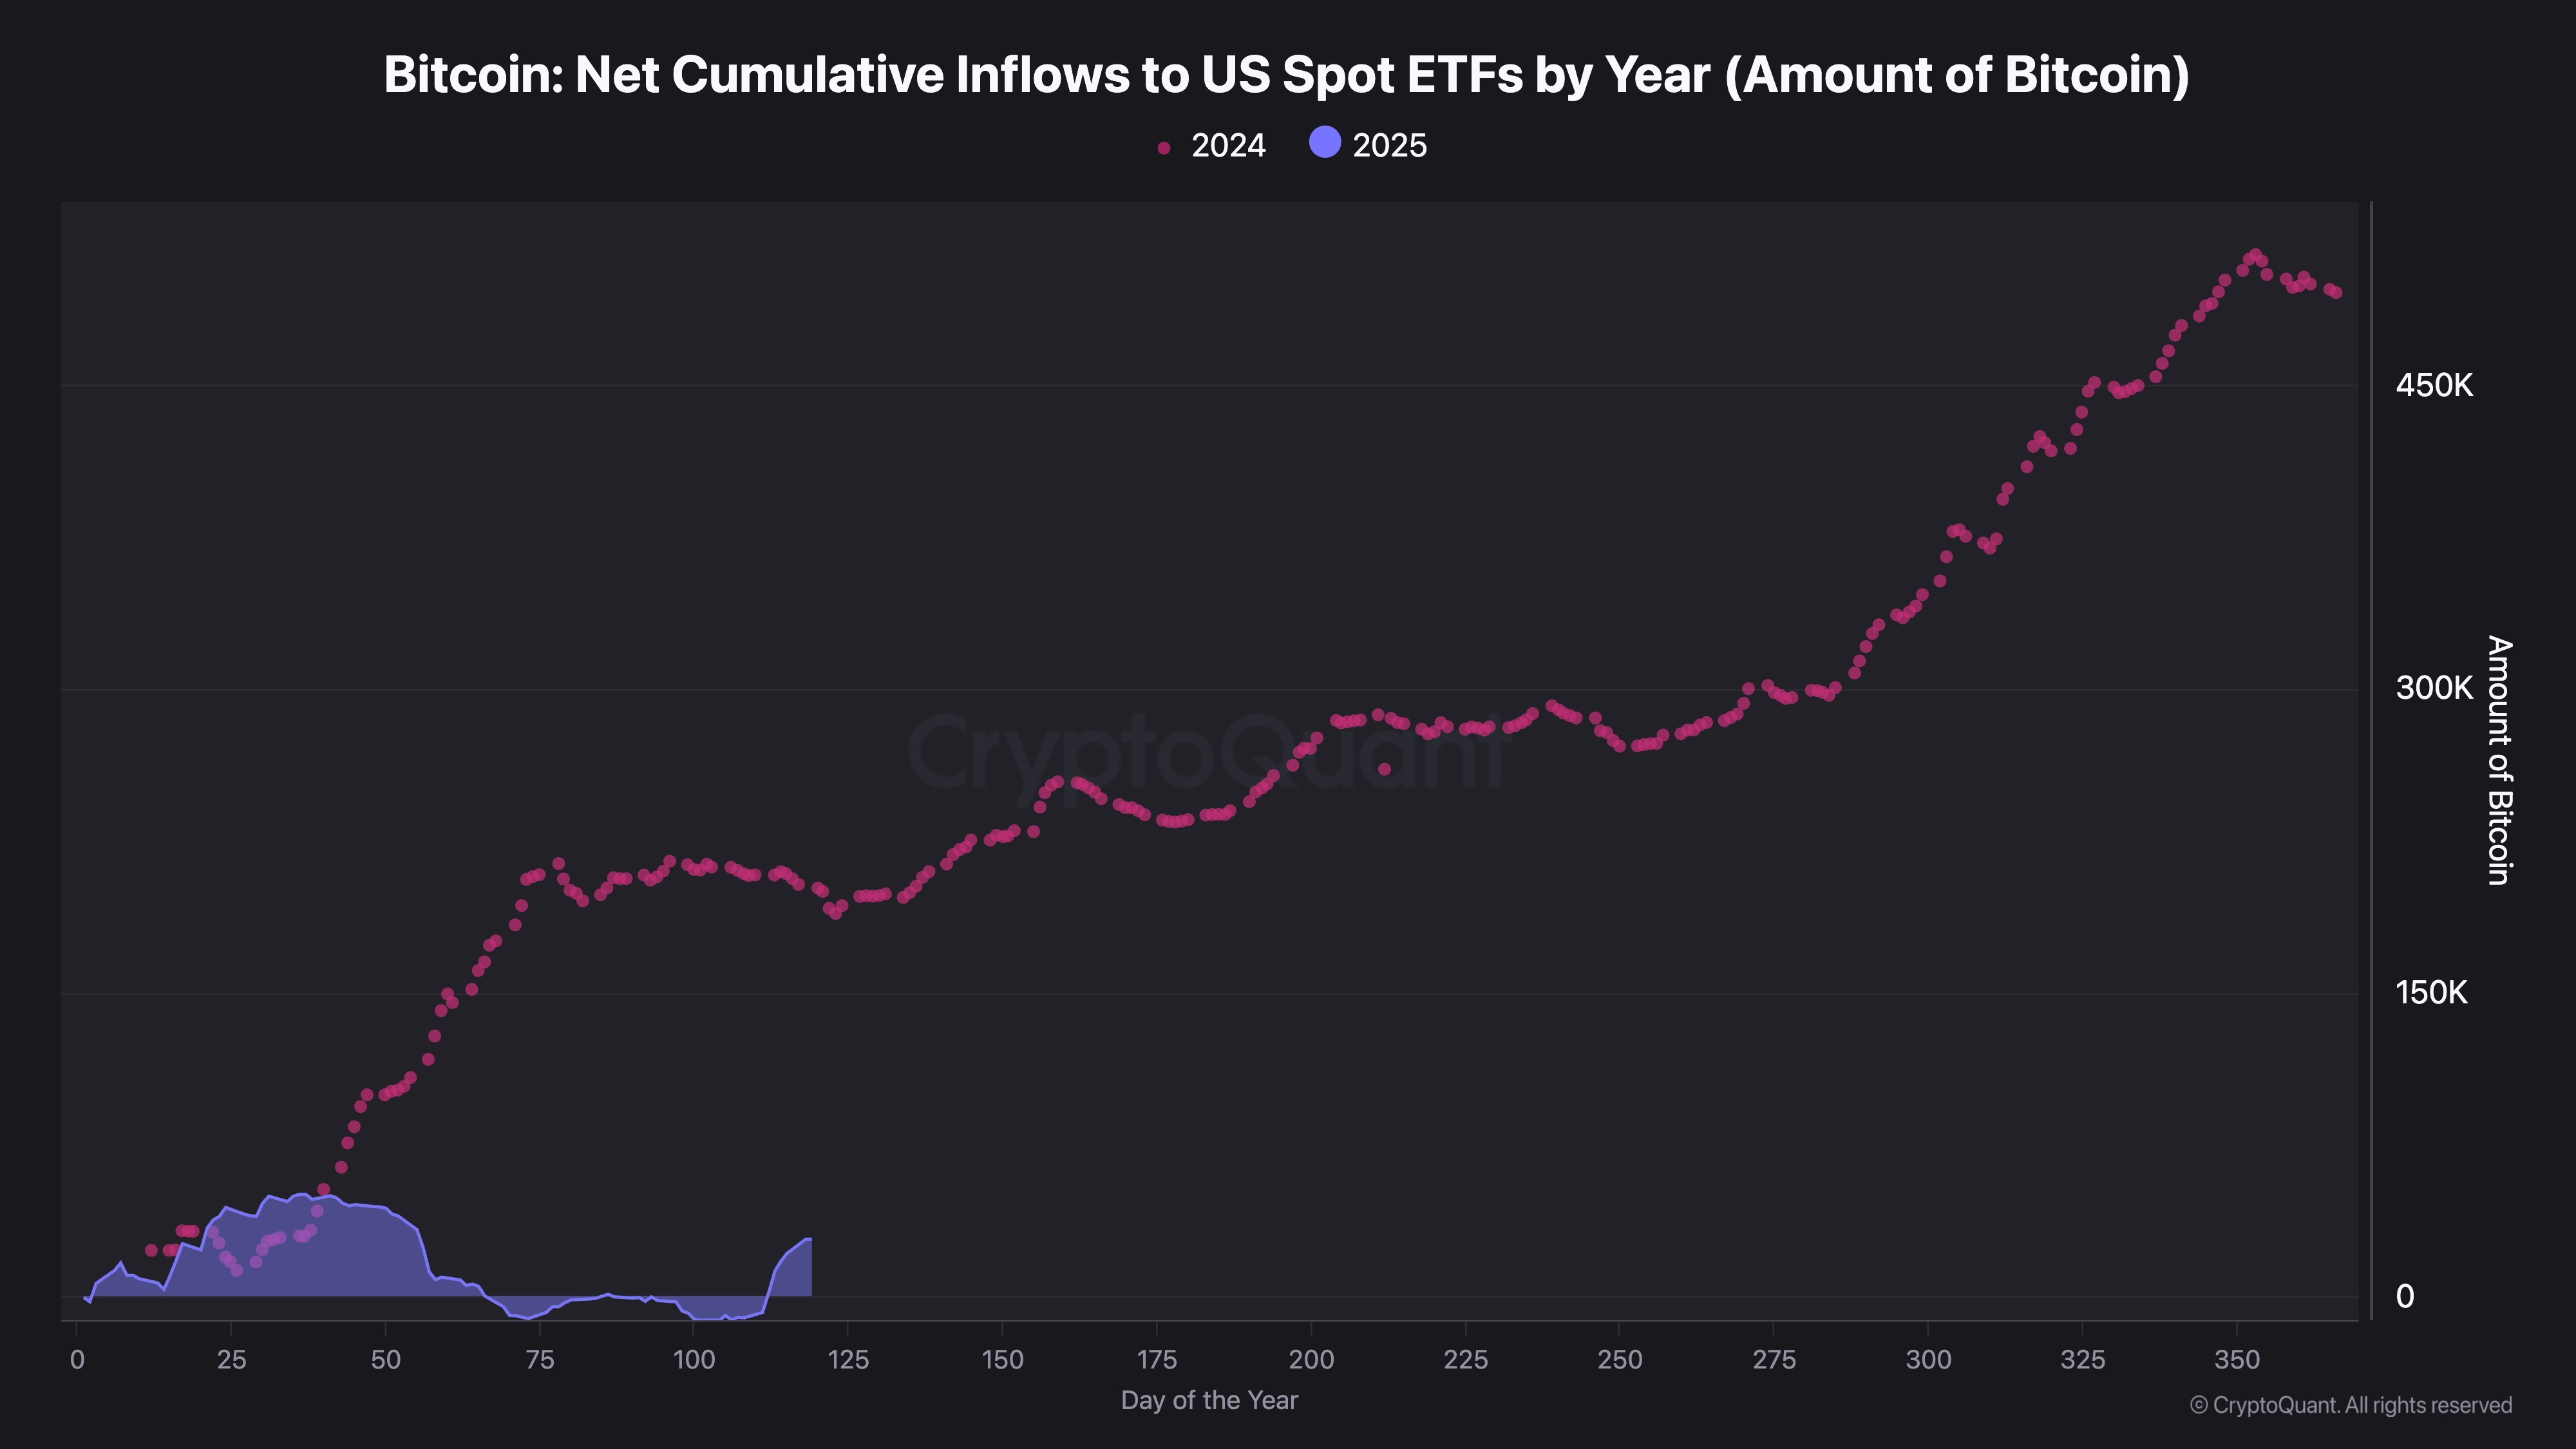
So far in 2025, BTC ETFs have collectively accumulated a net total of 28,000 BTC, well below the more than 200,000 BTC they had purchased by this point last year.
This decline shows a slowdown in institutional demand, which has historically been key in driving major price movements.
Bitcoin: Net Cumulative Inflows to US Spot ETFs by Year. Source: CryptoQuant.
There are early signs of a modest rebound, with ETF inflows beginning to tick higher recently. However, current levels remain insufficient to fuel a sustained uptrend.
ETF activity is often viewed as a proxy for institutional conviction, and a notable increase in purchases would likely signal renewed confidence in Bitcoin’s medium-term trajectory.
Until those inflows return in force, the broader market may struggle to generate the momentum needed for a prolonged rally.
Bitcoin Nears $100,000 as Momentum Builds Despite Macro Pressure
Bitcoin price has gained over 14% in the past 30 days, rebounding strongly after dipping below $75,000 in April.
This renewed momentum comes as BTC shows relative resilience amid broader macroeconomic volatility and policy-driven pressures, including Trump’s tariff measures that have weighed on risk assets.
While the entire crypto market has felt the impact, Bitcoin appears to be detaching slightly, showing less sensitivity to these external shocks than other digital assets.
BTC now sits just 6.3% below the $100,000 mark and remains under 17% from a potential move toward $110,000. According to Tracy Jin, COO of MEXC, sentiment is turning positive again:
“Beyond immediate price action, the growing institutional appetite and shrinking supply mechanisms against the macroeconomic uncertainty backdrop point to a structural shift in Bitcoin’s role within the global financial market. BTC is used to hedging against inflation and the fiat-based financial model. Its liquidity, scalability, programmability, and global accessibility offer a reliable modern alternative to traditional financial instruments for many corporations,” Jin said.
According to Jin, a summer rally towards $150,000 is plausible. She stressed that the $95,000 range will likely become a launch point for the brewing decisive breakout above $100,000 in the coming days.
” Should global trade tensions stabilize further and institutional accumulation continues, a summer rally towards $150,000 is plausible, potentially extending towards $200,000 by 2026. Overall, the external background remains favorable for the continuation of the upward movement, especially given the growth of stock indices on Friday, which could support Bitcoin over the weekend.”
Hedera (HBAR) is up more than 6% in the last 24 hours, showing renewed signs of strength across multiple technical indicators. Momentum is building, with the DMI suggesting buyers are starting to take control and the Ichimoku Cloud showing a clean bullish structure.
A potential golden cross on the EMA lines could further fuel the uptrend, opening the door for a breakout above $0.178 and possibly even $0.20. With sentiment improving and resistance levels in sight, HBAR is positioning itself for a key move after weeks of consolidation.
Hedera Signals a Potential Shift as Buyers Regain Momentum
Hedera’s Directional Movement Index (DMI) is showing early signs of momentum building, with its ADX rising to 16.27, up from 13.54 two days ago.
The ADX (Average Directional Index) measures the strength of a trend, regardless of direction. Readings below 20 indicate a weak or sideways market, while values above 25 suggest a strong and sustained trend is forming.
With the ADX still under 20, HBAR isn’t trending strongly yet, but the recent increase points to a potential shift in momentum.
The +DI (positive directional indicator) is currently at 22.6 — up from 14.19 two days ago, though slightly down from 26.17 yesterday, and rebounding from 17.8 earlier today.
This shows buying pressure has picked up recently, even if there’s short-term fluctuation. Meanwhile, the -DI (negative directional indicator) has dropped to 13.24 from 17.54 yesterday, signaling weakening selling pressure.
Together, these movements suggest bulls are starting to take control, and if the ADX continues to rise above 20, it could confirm a strengthening uptrend for HBAR.
Hedera Maintains Bullish Momentum as Trend Structure Holds Firm
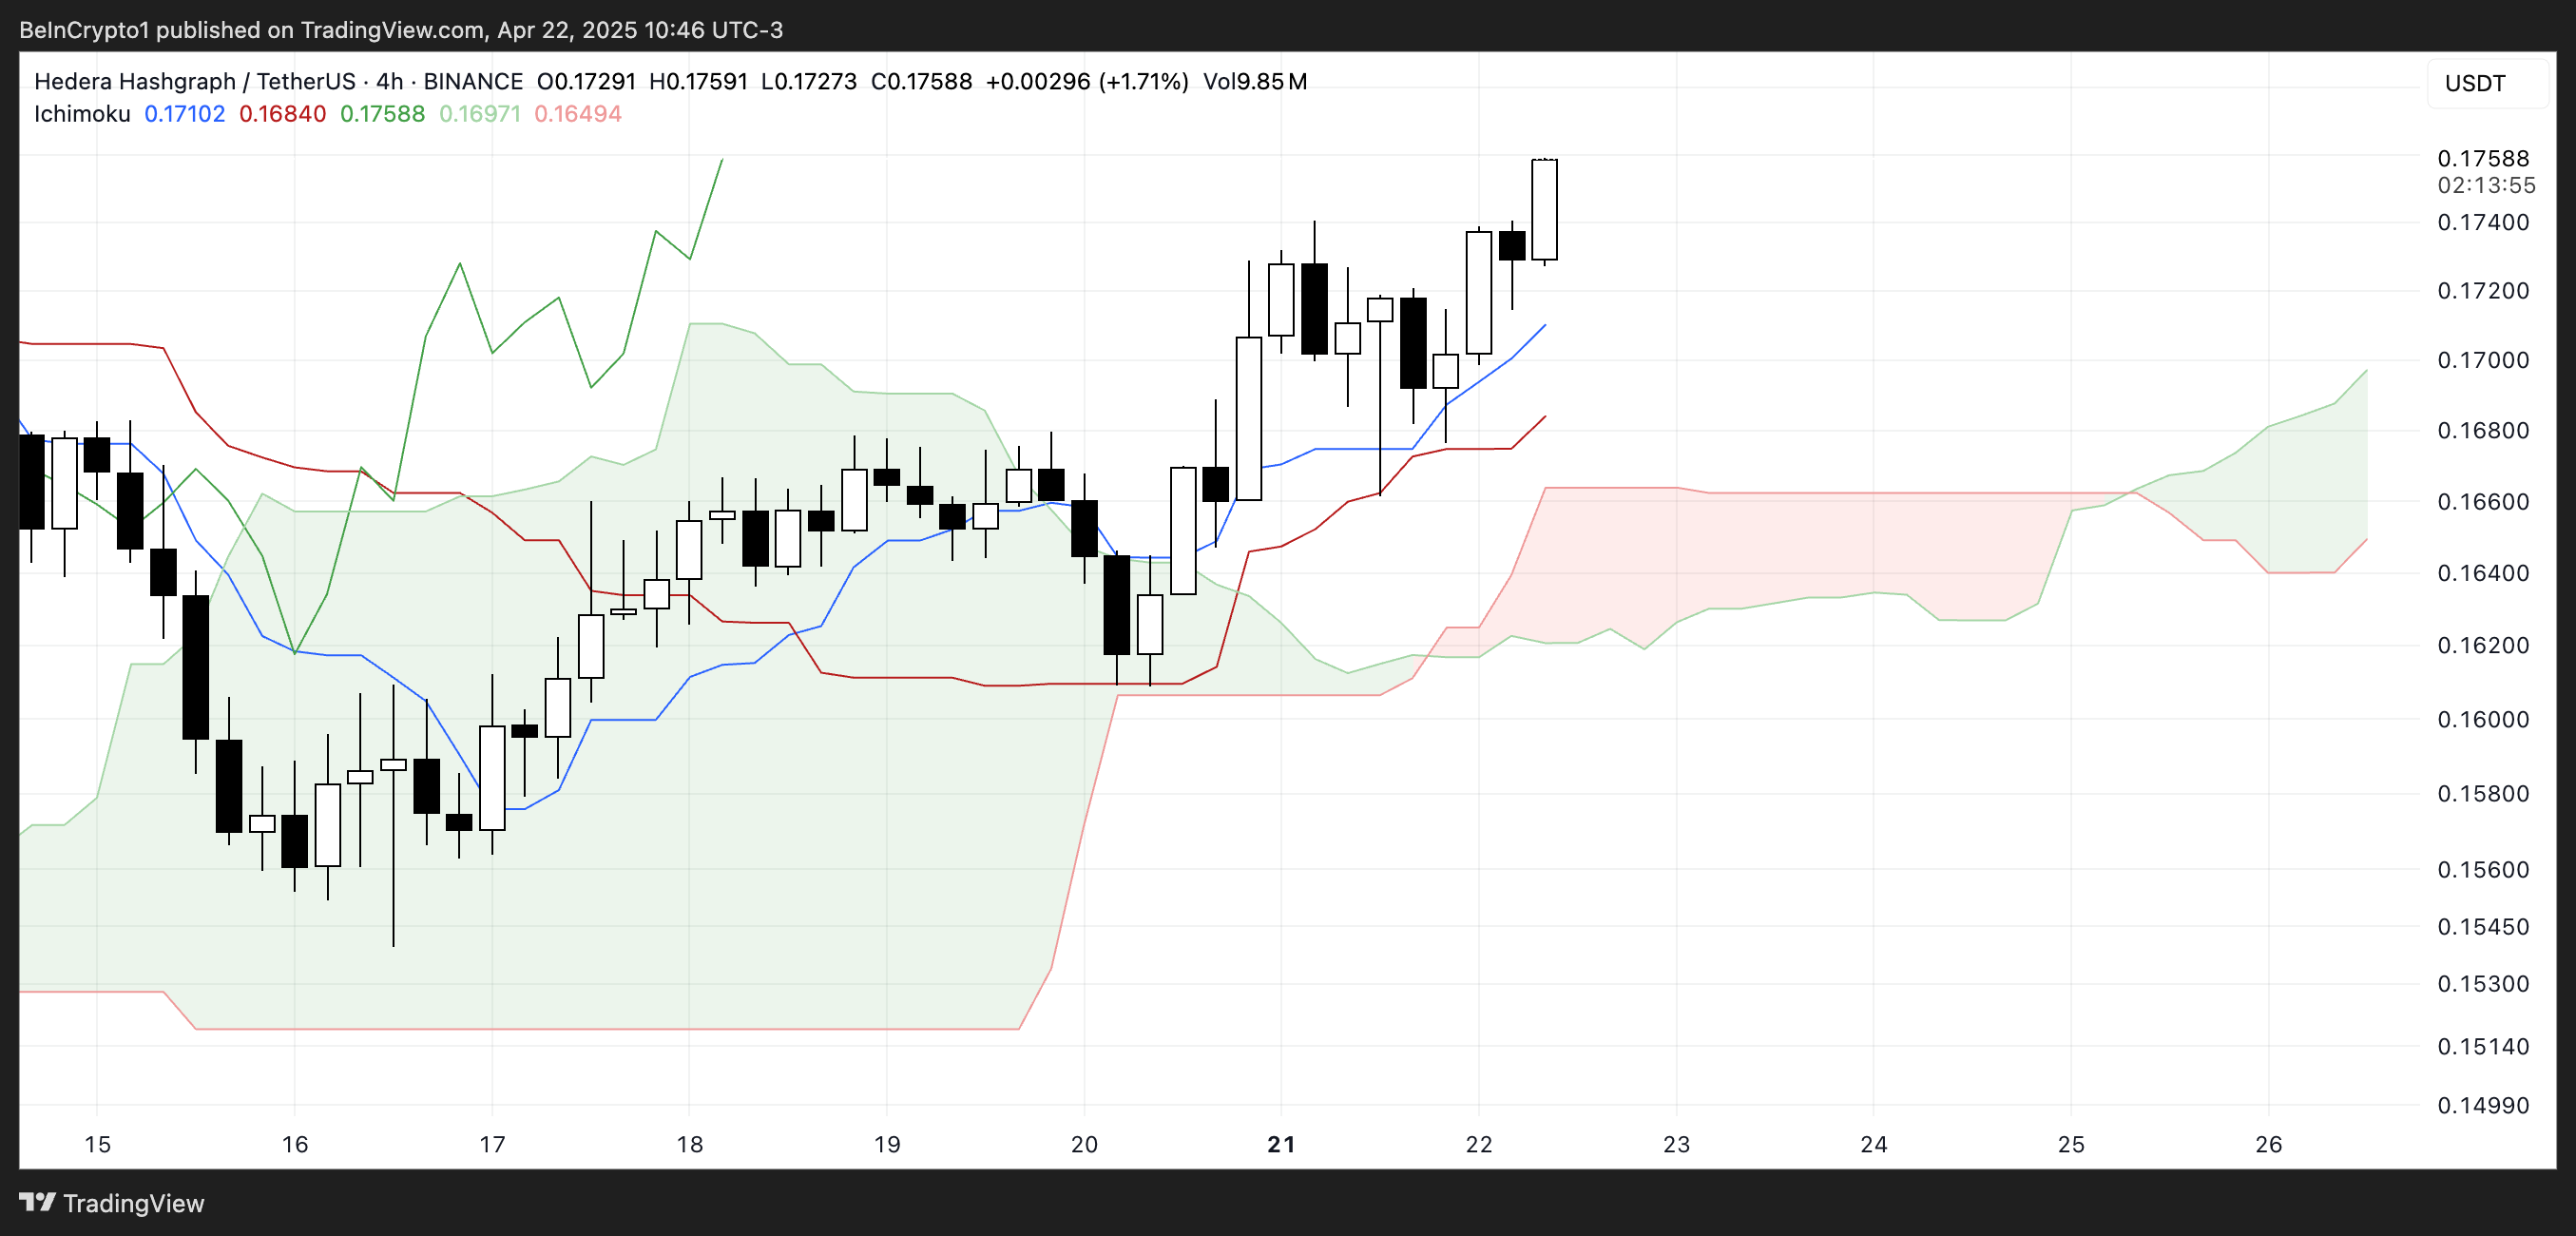
Hedera’s Ichimoku Cloud chart is currently flashing strong bullish signals. Price action is well above the Kumo (cloud), which indicates clear upward momentum.
The cloud has transitioned from red to green, signaling a shift in sentiment from bearish to bullish.
This transition often suggests that the current trend could sustain if no significant reversal emerges.
The Tenkan-sen (blue line) is positioned above the Kijun-sen (red line), reinforcing a short-term bullish bias. Additionally, the future cloud is sloping upward, hinting at continued strength ahead.
The Chikou Span (green lagging line) is also above the price candles and cloud, further confirming the alignment of all Ichimoku elements in favor of the bulls.
Unless the price breaks down below the Tenkan-sen or the cloud itself, the outlook remains positive.
Hedera Eyes $0.20 Breakout as Golden Cross Nears
Hedera’s EMA lines are showing signs of convergence, indicating that a golden cross could form soon — a classic bullish signal. If that happens, HBAR could break the resistance at $0.178, and if the uptrend continues, it may climb to test $0.20.
Should bullish momentum fully return, Hedera price could rise toward $0.258, marking its first move above $0.25 since early March.