While the broader crypto market is in retreat, Ethena (ENA) is defying the trend, rallying nearly 20% in the past 24 hours and catching the attention of traders across the board.
But what really stands out is the convergence of key signals such as rising whale activity, steady exchange outflows, and a bullish chart setup. All signs suggest that something bigger may be brewing. Could ENA be gearing up for a breakout rally?
Whales Are Gobbling Up Ethena
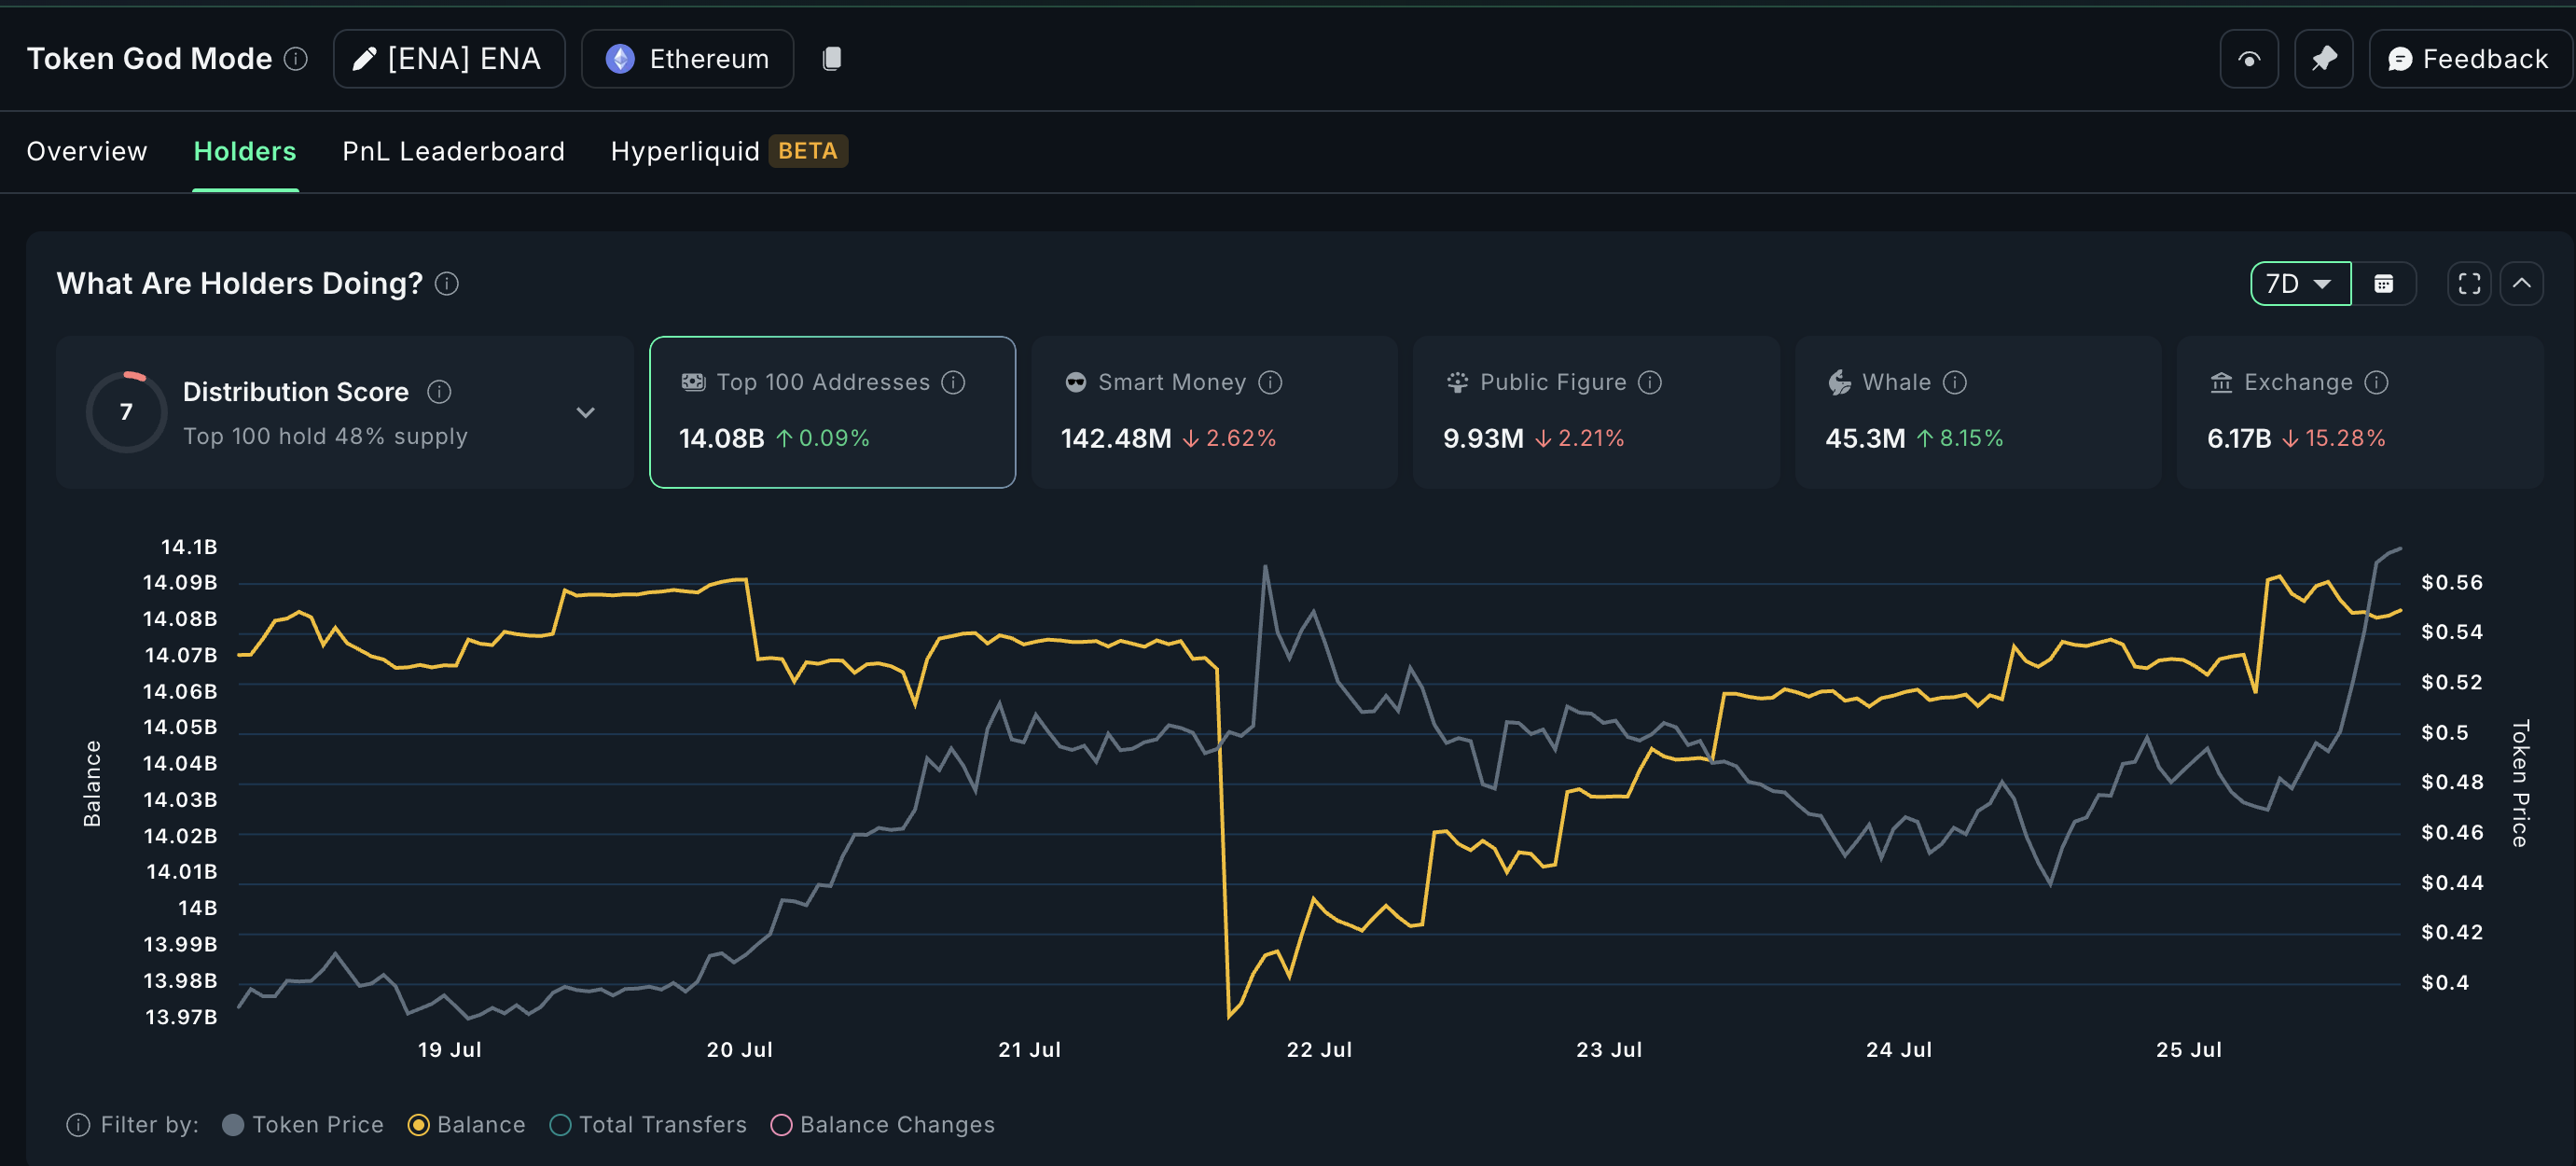
The most important trend right now is that whales are buying, and not selling. According to Nansen’s dashboard, ENA whale holdings have jumped 8.15% in the last seven days. At the current price, that stands close to $1.87 million.
Ethena price and whale accumulation pattern: Nansen
That’s a sharp increase, and it’s happening while most of the market is either flat or down. This kind of whale behavior usually signals confidence; big players are positioning for a larger move.
At the same time, exchange balances are falling. Over the past week, 1.07 billion ENA tokens have left exchanges.
That means Ethena (ENA) is moving into private wallets, not trading platforms. When this happens, it’s often a sign that holders plan to sit tight. Less supply on exchanges means fewer chances of sudden selling.
In short, big wallets are scooping up ENA, and the token is quietly disappearing from exchanges. That’s a strong bullish setup.
OBV Divergence Hints at Momentum Building Underneath
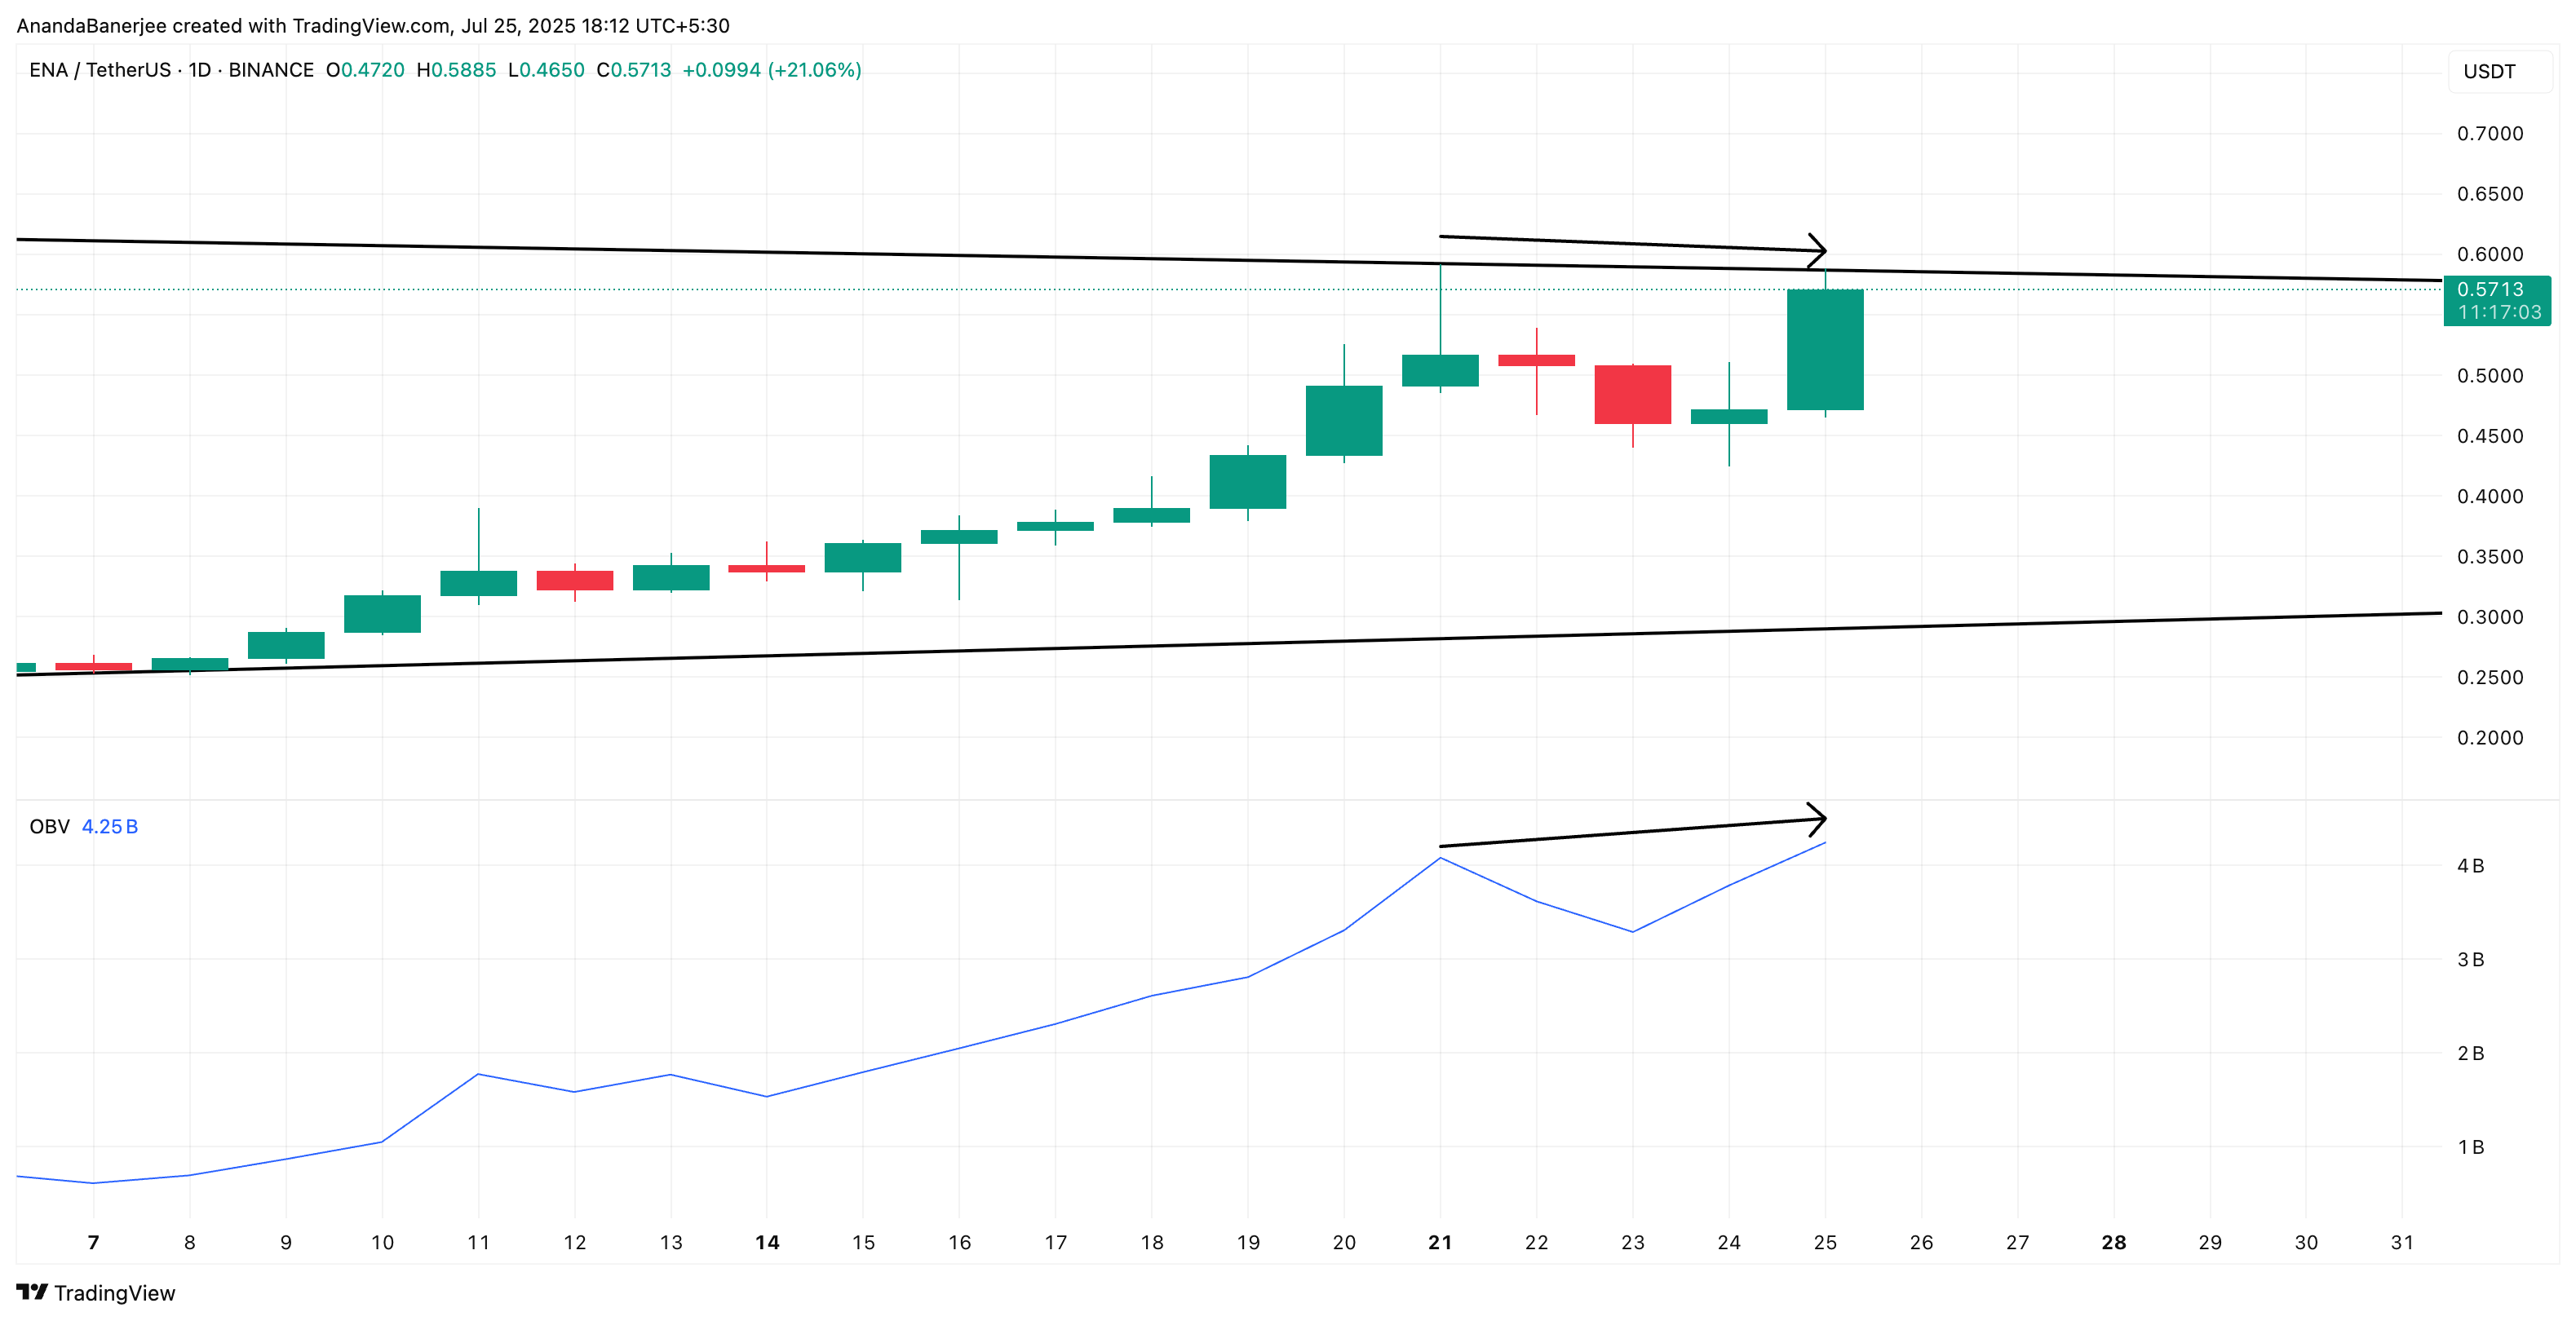
The chart shows something even more interesting. While ENA’s price made a lower high, the On-Balance Volume (OBV) made a higher high at the time of writing. This is called a bullish divergence; it happens when volume flows suggest buyers are stronger than the price action shows.
At the time of writing, ENA is still inside a converging wedge pattern and trading near $0.57. The OBV trend is breaking higher, which hints that buying pressure is building under the surface. Buyers are quietly stepping in even as the price consolidates.
This kind of divergence often appears before a breakout. Combined with the whale activity, it shows that accumulation may already be underway.
On-Balance Volume (OBV) tracks whether volume is flowing into or out of a token, helping spot hidden trends.
For token TA and market updates: Want more token insights like this? Sign up for Editor Harsh Notariya’s Daily Crypto Newsletter here.
The Wedge Breakout Could Ignite the Next Leg for ENA’s Price, But $0.60 Is Key
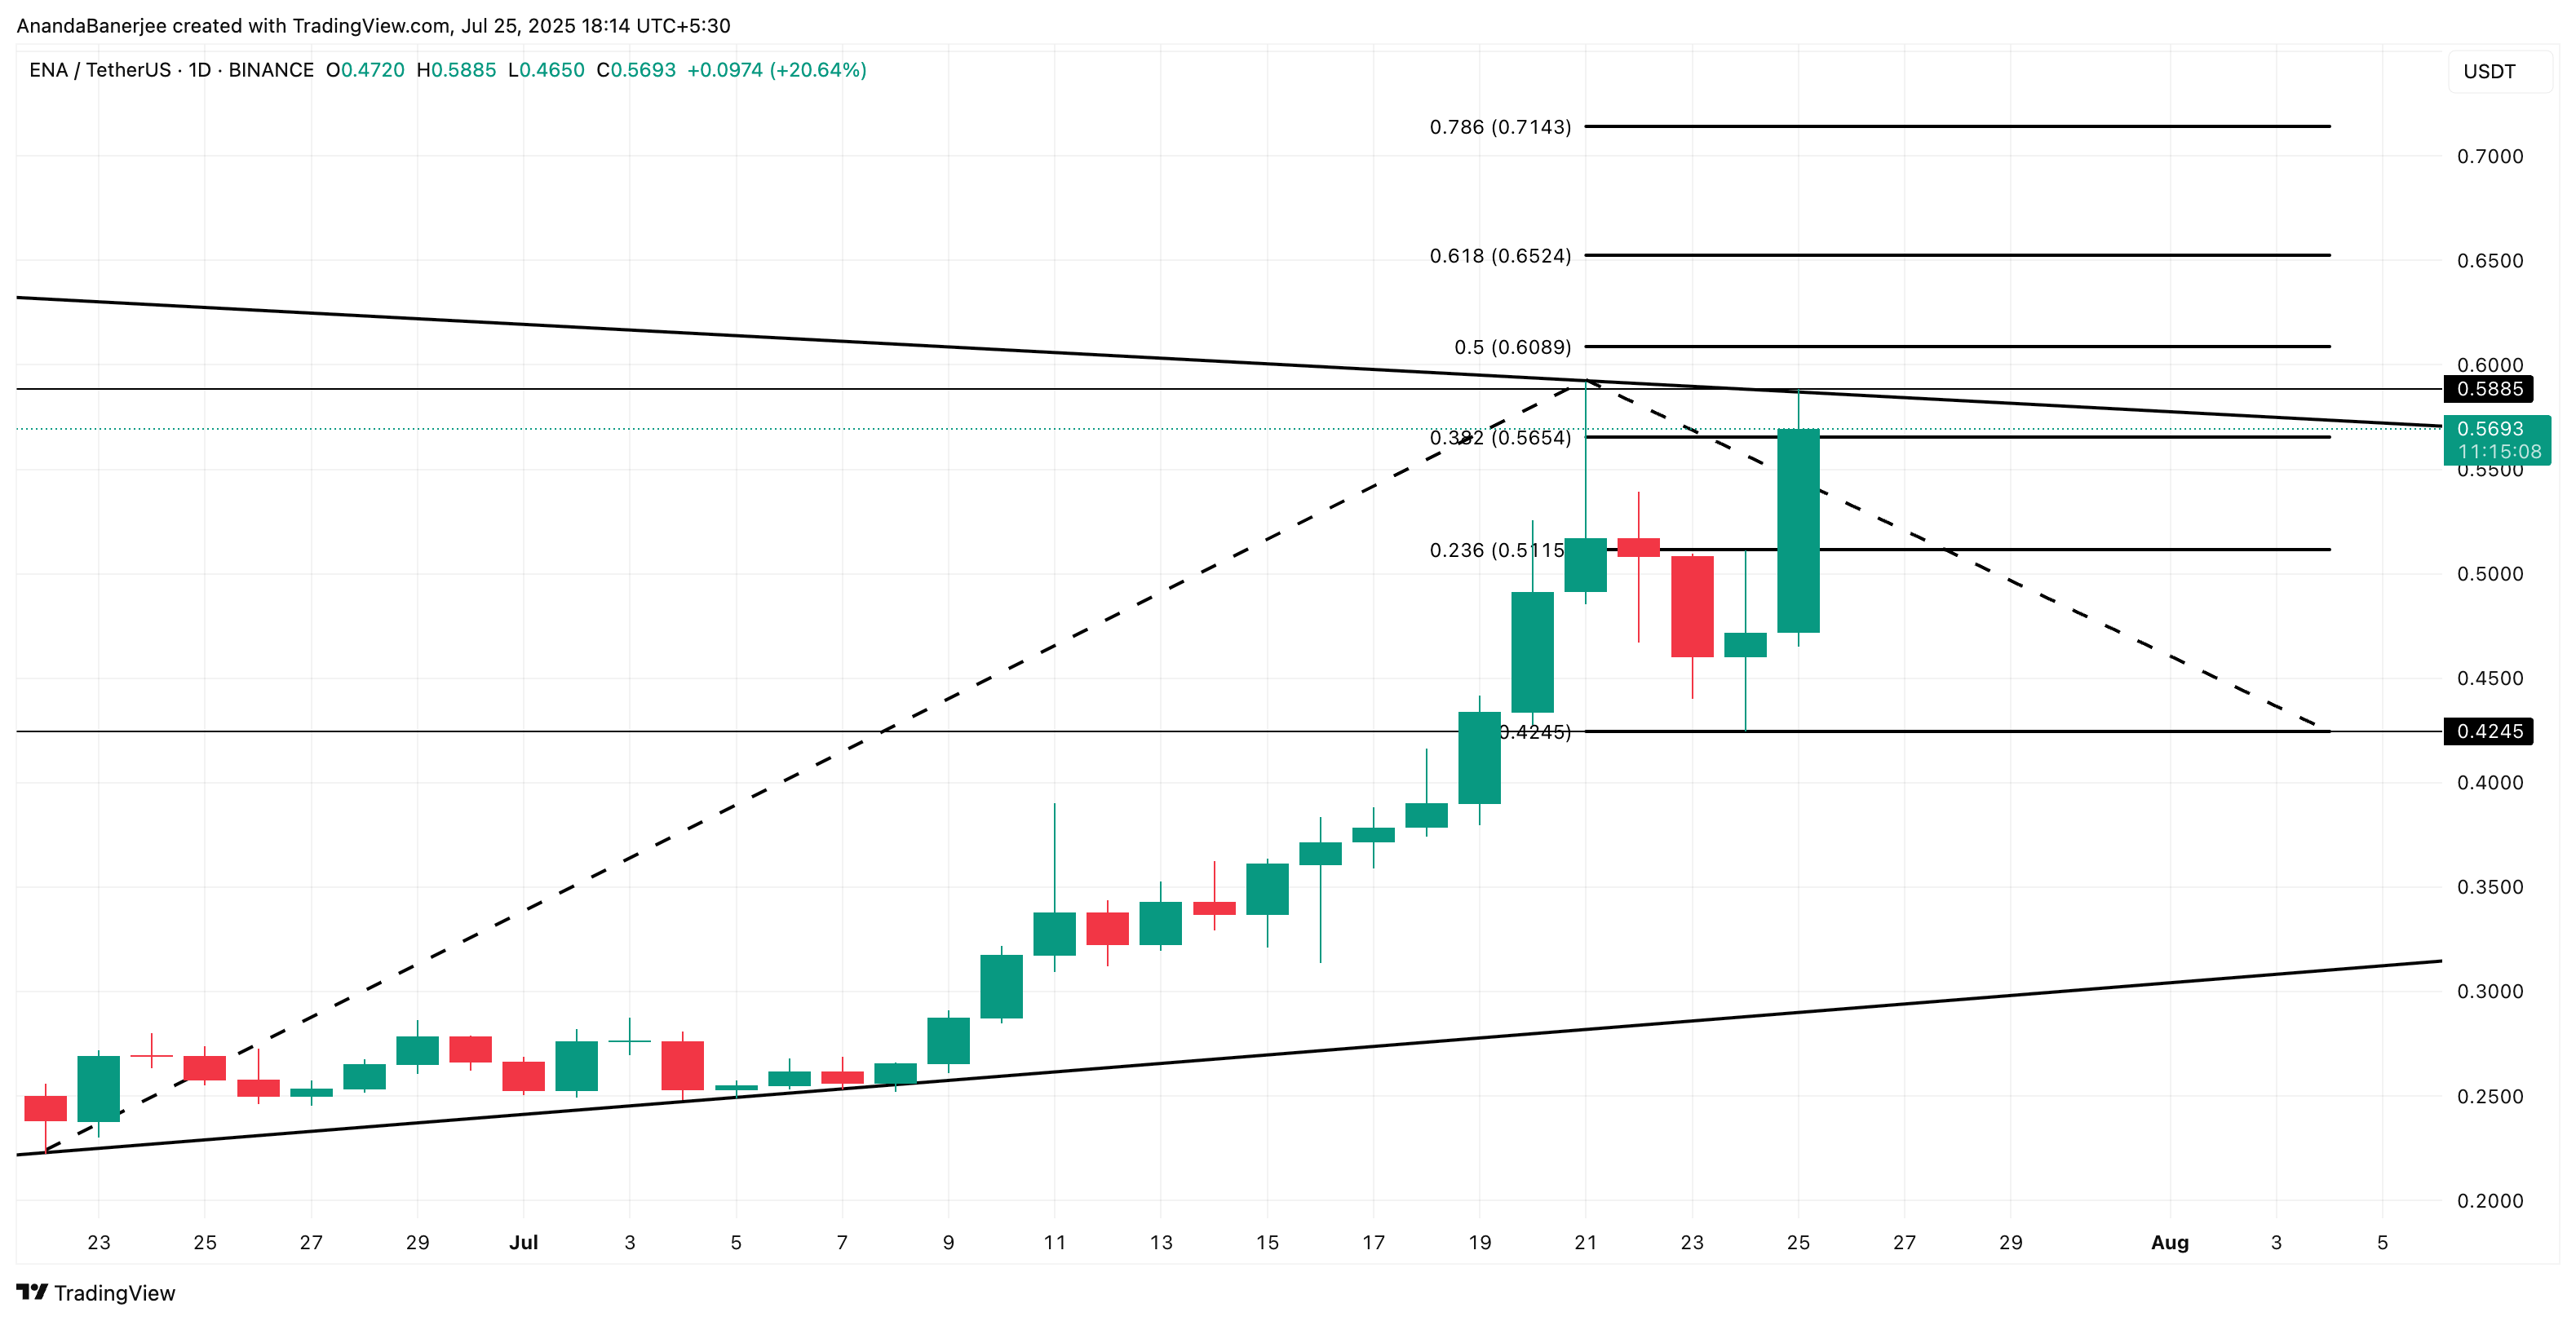
Technically, ENA has been trading inside a wedge since late June. However, just to add another layer of validation, the chart uses the trend-based Fibonacci extension tool. This tool or indicator is used to chart price targets during an uptrend.
The first point of the Fibonacci extension plotting began near $0.22 and extends to a recent swing high around $0.59. Yesterday, ENA retraced to $0.42, but today it’s bouncing back hard and hovering just under the breakout zone.
The big number to watch now is $0.60. That’s the 0.5 Fibonacci extension level from the recent trend. A clean breakout above the wedge at $0.58, followed by the $0.60 mark, could unlock a rally toward $0.65, $0.71, or even beyond. More so with the current whale and volume backing.
However, here’s the catch. If ENA fails to break out and drops back below $0.51, the bullish case weakens. That would invalidate the wedge breakout thesis and could trigger a pullback.
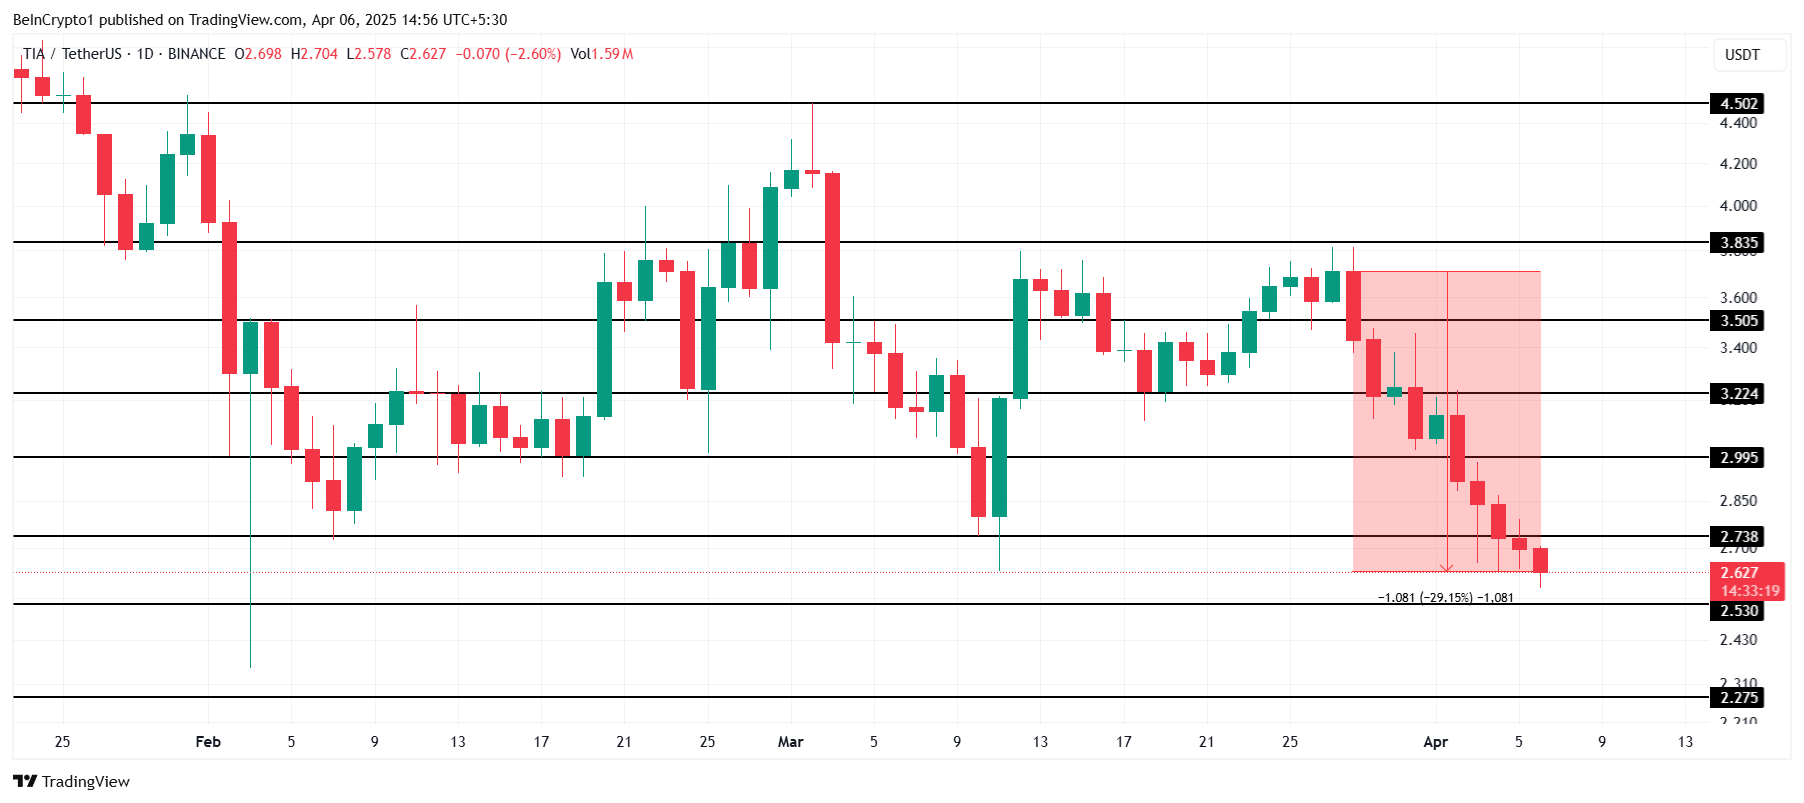
Celestia (TIA) has recently experienced a significant drawdown, losing nearly 30% of its value in the past two weeks. This decline has been attributed to the broader bearish market conditions, which caused panic among investors.
As a result, many TIA holders decided to pull their funds, adding to the downward pressure on the price.
Celestia Holders Opt To Back Out
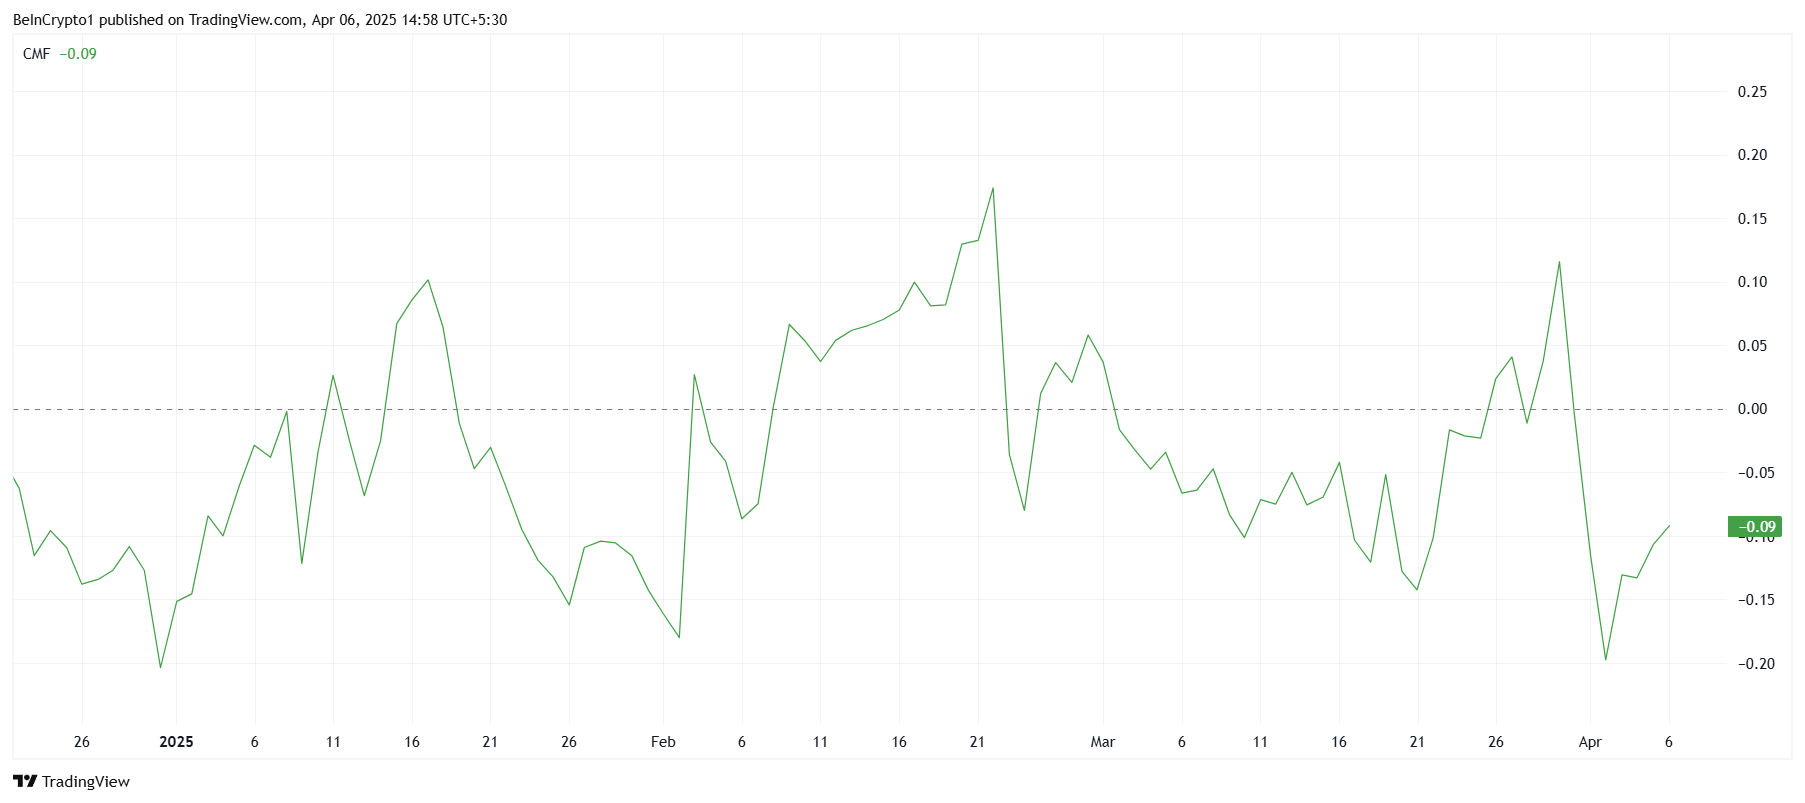
The Chaikin Money Flow (CMF) indicator has shown significant outflows from Celestia, marking the largest selling activity since the beginning of 2025. This reflects the growing fear among investors after the 30% price correction.
However, despite the negative sentiment, there has been an uptick in the CMF recently, indicating that some new investors are beginning to see value in the low prices. These inflows could potentially help stabilize the price and set the stage for a recovery.
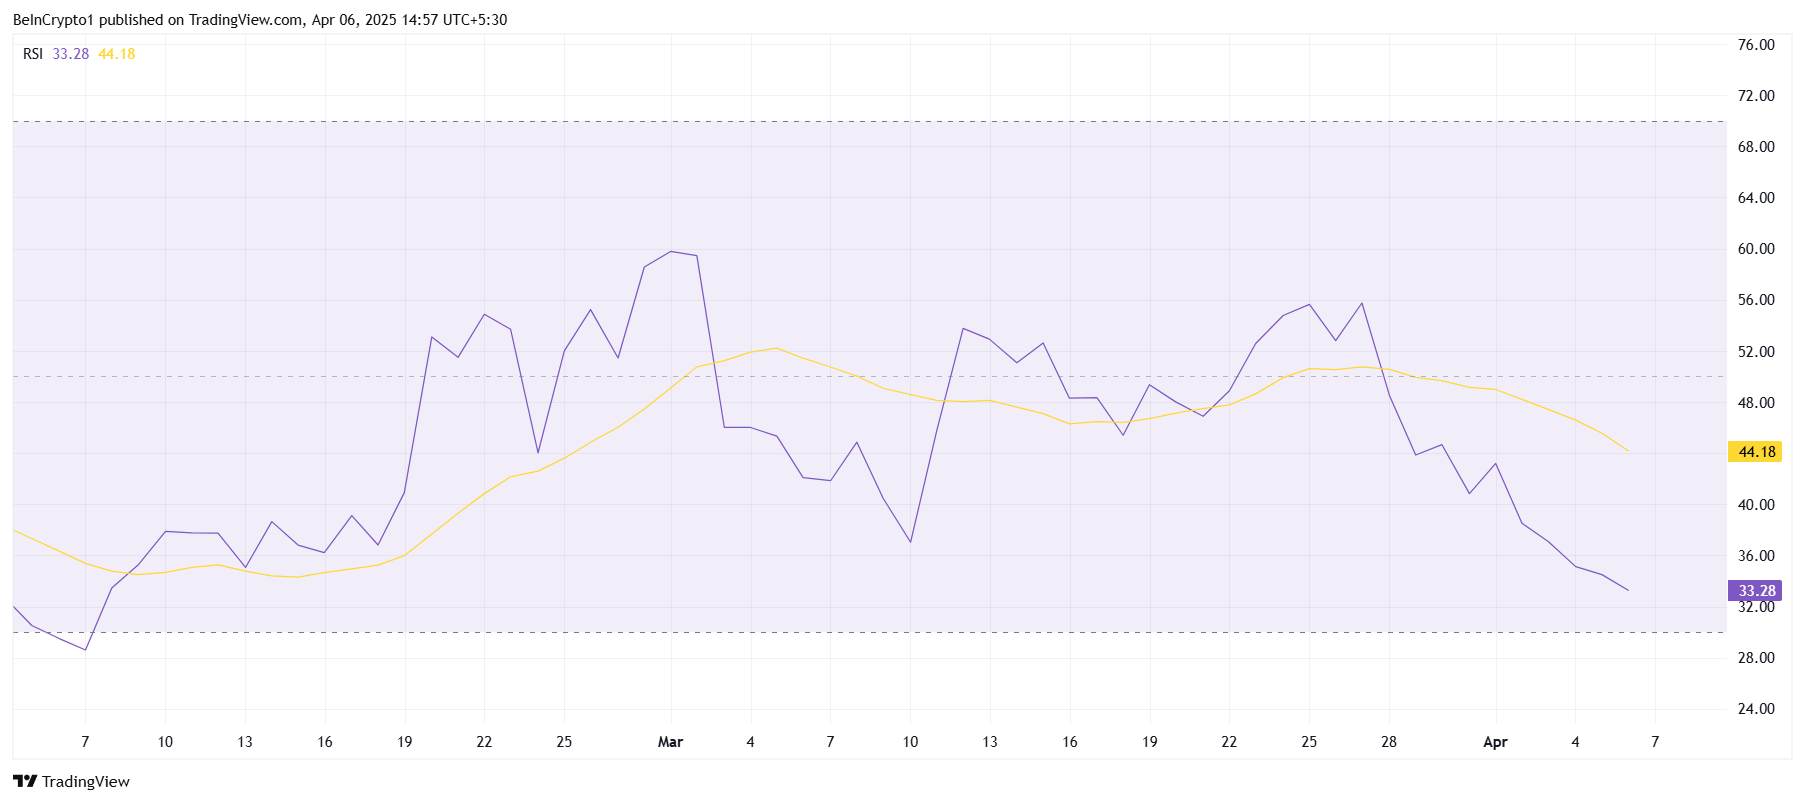
The Relative Strength Index (RSI) for Celestia shows that cryptocurrency is currently on a bearish trend. Stuck below the neutral line at 50.0, the RSI is moving closer to the oversold threshold of 30.0. Historically, when an asset reaches this level, it is considered a signal for a potential reversal, as selling typically slows, and accumulation begins.
If the RSI falls below 30, it could trigger buying interest, as many traders may view the low prices as an opportunity to enter the market.
The current state of the RSI suggests that while bearish momentum is still strong, the conditions are ripe for a reversal. If the selling pressure wanes and buyers begin to step in, Celestia’s price could find support and begin an upward move.
Celestia is currently priced at $2.62, reflecting a nearly 30% decline over the past two weeks. It is holding just above the critical support level of $2.53. If the market sentiment improves and the RSI hits the oversold zone, there is potential for a recovery.
The influx of new investors could provide the momentum needed to drive the price higher.
A successful bounce from the $2.53 support level could see Celestia pushing through $2.73 and heading towards $2.99. This would signal the beginning of a recovery rally and possibly set the stage for further price appreciation as market conditions improve.
However, if Celestia fails to hold the $2.53 support, it could trigger a further decline towards $2.27. This would invalidate the bullish outlook, prolonging the downtrend and extending investors’ losses.
Welcome to the US Crypto News Morning Briefing—your essential rundown of the most important developments in crypto for the day ahead.
Grab a coffee as we discuss the growing influence of stablecoin issuers in the US Treasury market. With growing institutional adoption and regulatory legitimization of US dollar-pegged stablecoins, experts warn of artificial inflation of demand for the dollar.
Crypto News of the Day: Using Government Debt Instruments To Back Digital Dollars is Risky, Keiser Warns
The influence of stablecoin issuers in the US is growing, so much that Tether, which already issues the USDT stablecoin, plans to launch a US-only stablecoin by 2025. Tether aims to position stablecoins as strategic financial tools under the Trump administration.
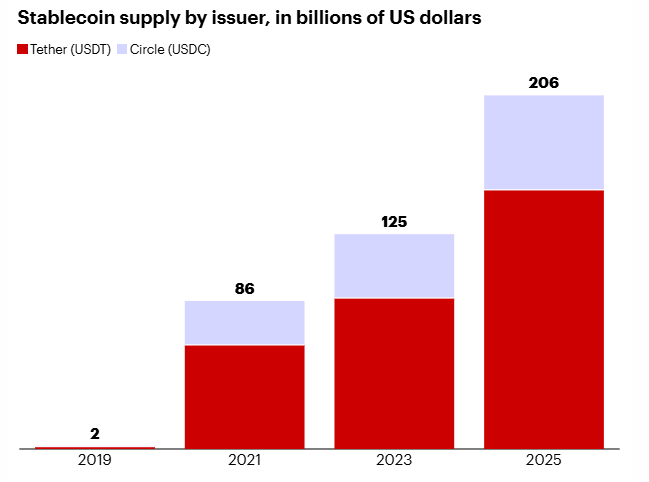
Stablecoin supply by issuer in billions of US dollars. Source: Bain & Company
This chart shows Tether’s dominance in the stablecoin market, with overall supply going from $2 billion to more than $200 billion in recent years.
Meanwhile, the US Treasury projects stablecoins could reach a $2 trillion market by 2028, which could attract more players.
Nevertheless, as stablecoin influence in the Treasury market grows, the House Financial Services Committee is concerned.
Perhaps, however, the greater concern is stablecoin issuers’ using Treasury yields to buy Bitcoin. According to experts, this could undermine US government reserves.
A recent US Crypto News publication indicated reports of stablecoin issuers using Treasury yields to buy Bitcoin. Some say this could undermine initiatives like the proposed US Strategic Bitcoin Reserve, which aims to bolster national holdings of the pioneer crypto.
Growing Influence of Stablecoin Issuers in US Treasuries Market is Concerning, Max Keiser Says
Among them is Bitcoin pioneer Max Keiser, who voiced concerns over the growing influence of stablecoin issuers in the US Treasury market. Keiser warns that their use of government debt instruments to back digital dollars may have broader implications for the global financial system.
As of Q1 2025, Tether reported holding nearly $120 billion in short-term US Treasury securities and reverse repos. This makes it one of the largest non-sovereign holders of American government debt.
Meanwhile, Circle, issuer of USDC, disclosed more than $22 billion in Treasury bills in a February 2025 attestation.
These holdings collateralize dollar-pegged stablecoins, helping issuers maintain liquidity and trust. The issuers benefit from the interest income generated by the bonds.
While this practice is common and legal, Keiser contends it contributes to deeper systemic issues tied to fiat currency dynamics.
“This is exactly why the stablecoin issuers are buying Bitcoin, this is called a speculative attack on the US dollar. Feeding the debt spiral with fiat stablecoins, buying treasury bills, and then investing the interest into Bitcoin, allowing the stablecoin issuers to buy billions in Bitcoin for free,” Keiser told BeInCrypto.
Stablecoin issuers purchase US debt on secondary markets and earn interest, which they may or may not deploy into digital assets like Bitcoin. Keiser is critical of the broader financial architecture underpinning stablecoins.
“Issuing new stablecoins backed by US T-bills printed out of thin air is not a monetary system, but a financial hologram,” he said.
US Treasury bills are debt instruments issued by the federal government and sold to investors, including private companies like Tether and Circle, through regulated markets. These stablecoin issuers tokenize existing fiat currency held in reserve.
Keiser elaborated on what he sees as the long-term consequences of this model.
“It’s a speculative attack by private banks. It is financial repression, pushing rates down as ‘malinvestments’ increase. It is rinse and repeat,” he explained.
His critique also extends to the broader outlook for the US dollar, which, according to the Bitcoin pioneer, “is a quick, deadly fix; a USD hospice. Cue the final death throes of the US dollar.”
BeInCrypto has contacted Circle and Tether for comment and will update this article if they respond.
Max Keiser Proposes AI To Invent Novel Security Structures
Keiser also highlighted what he views as an emerging trend. He said high-profile investors and technologists use artificial intelligence (AI) and novel corporate strategies to increase Bitcoin exposure.
The Bitcoin maxi referenced Strategy Executive Chair Michael Saylor and investor-turned-politician Vivek Ramaswamy.
“Financial engineers like Michael Saylor and Vivek Ramaswamy are using AI to invent novel security structures to maximize the Bitcoin Treasury model. Vivek Ramaswamy plans to take his company, Strive Asset Management, public by merging with Asset Entities and starting to accumulate Bitcoin using the model that Saylor’s Strategy has already successfully adopted — using proceeds from stock and debt issuance,” Keiser remarked.
Though no confirmed public filings detailing Ramaswamy’s use of AI in this context, Keiser sees these developments as significant.
“The results are redefining finance globally and adding significantly to the Bitcoin demand. OG’s like myself, who have watched Bitcoin outperform everything for 15 years, are seeing, for the first time, investment strategies that are outperforming Bitcoin, and the implications are profound,” he said
Keiser believes such strategies could push Bitcoin’s market value even higher. He also implied that the extraordinary compounding rates of the past could be extended. This sentiment comes as Bitcoin captures more of the total addressable market and scales even higher price points.
The views expressed are those of Max Keiser and do not necessarily reflect the opinions of BeInCrypto.
Chart of the Day
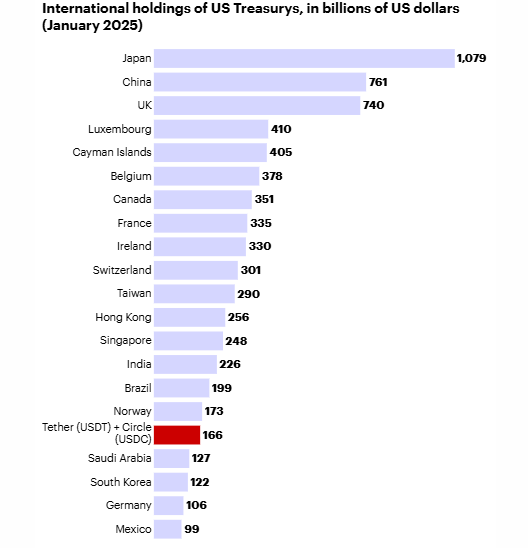
International holdings of US Treasuries in billions of dollars. Source: Bain & Company
This chart shows that stablecoins have become a large holder in US treasuries.
Byte-Sized Alpha
Here’s a summary of more US crypto news to follow today:
Stellar (XLM) is showing renewed momentum, up 10% in the last 24 hours and over 25% in the past 30 days. Despite the rally, XLM has remained below the $0.30 mark since March 2, struggling to reclaim that key psychological level.
Recent technical signals—including a sharp rise in RSI, a positive CMF shift, and a potential golden cross—are drawing attention from traders. As bullish momentum builds, XLM now faces a critical test at the $0.279 resistance zone.
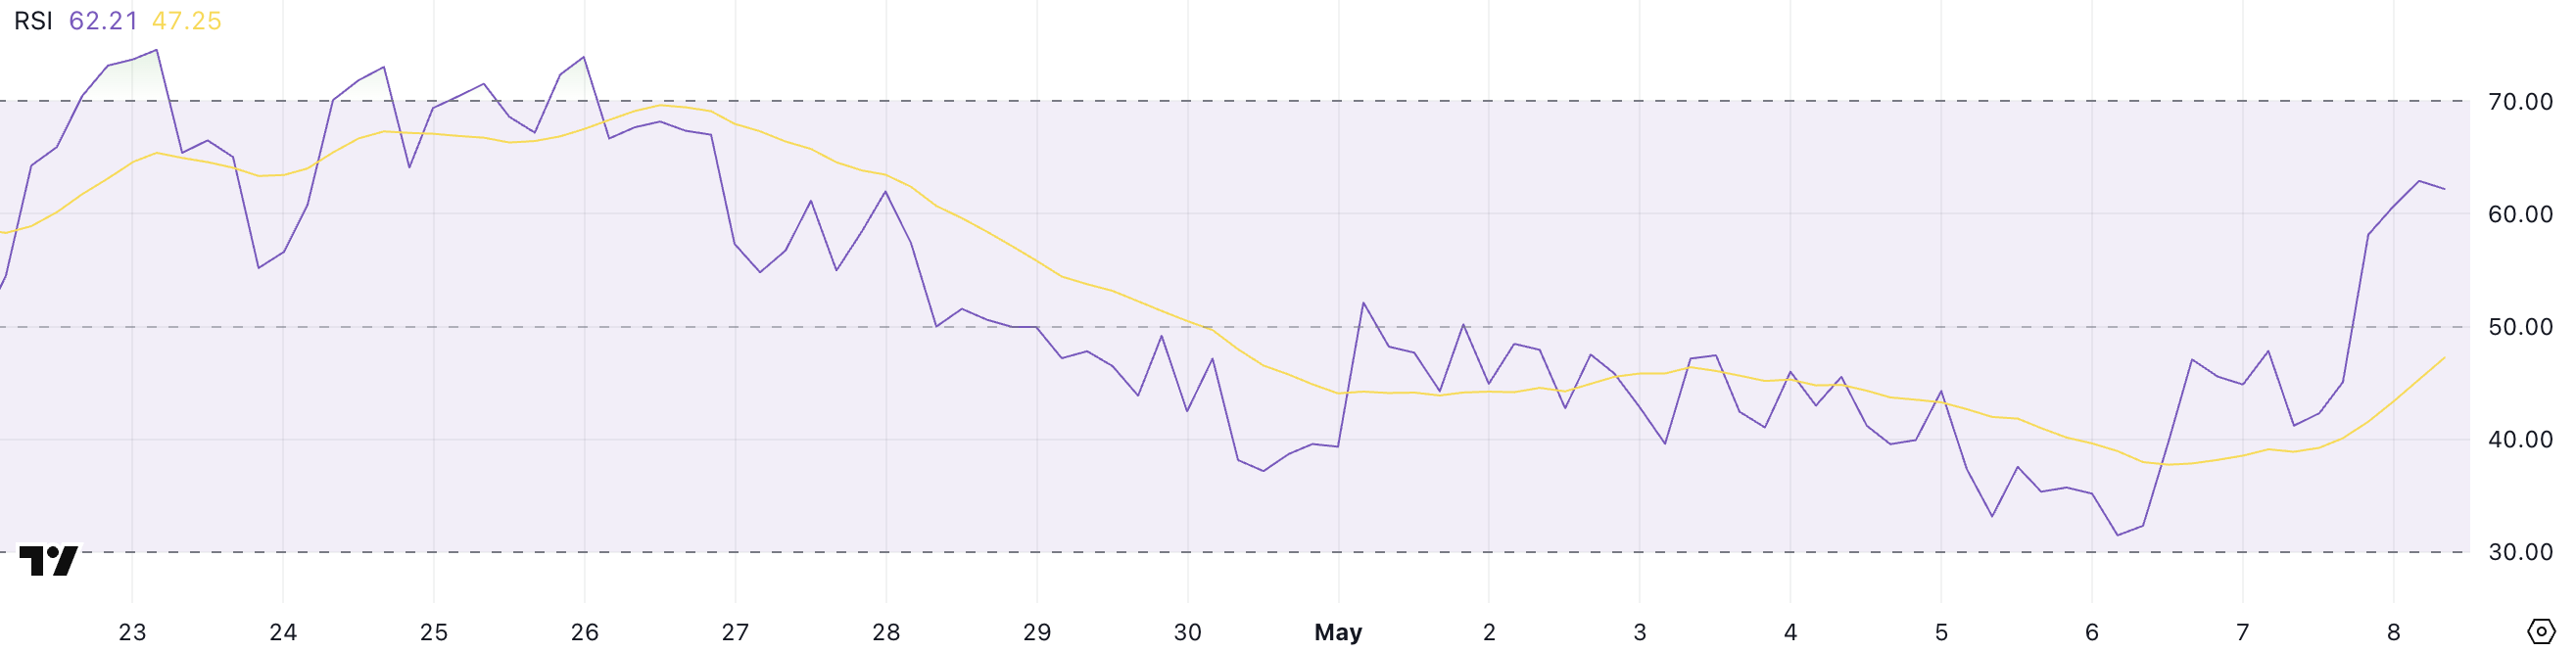
Stellar RSI Surges—Is XLM Gearing Up for a Breakout?
Such a move often reflects a shift in sentiment, with traders rotating back into the asset after a period of weakness. If this momentum continues, XLM could be setting up for a bullish breakout in the short term.
The RSI is a technical indicator used to measure the speed and change of price movements. It ranges from 0 to 100, with values below 30 generally considered oversold and values above 70 considered overbought.
Readings between 50 and 70 typically indicate growing bullish momentum. With RSI now at 62.21, XLM is gaining strength but still has room to run before hitting overbought conditions.
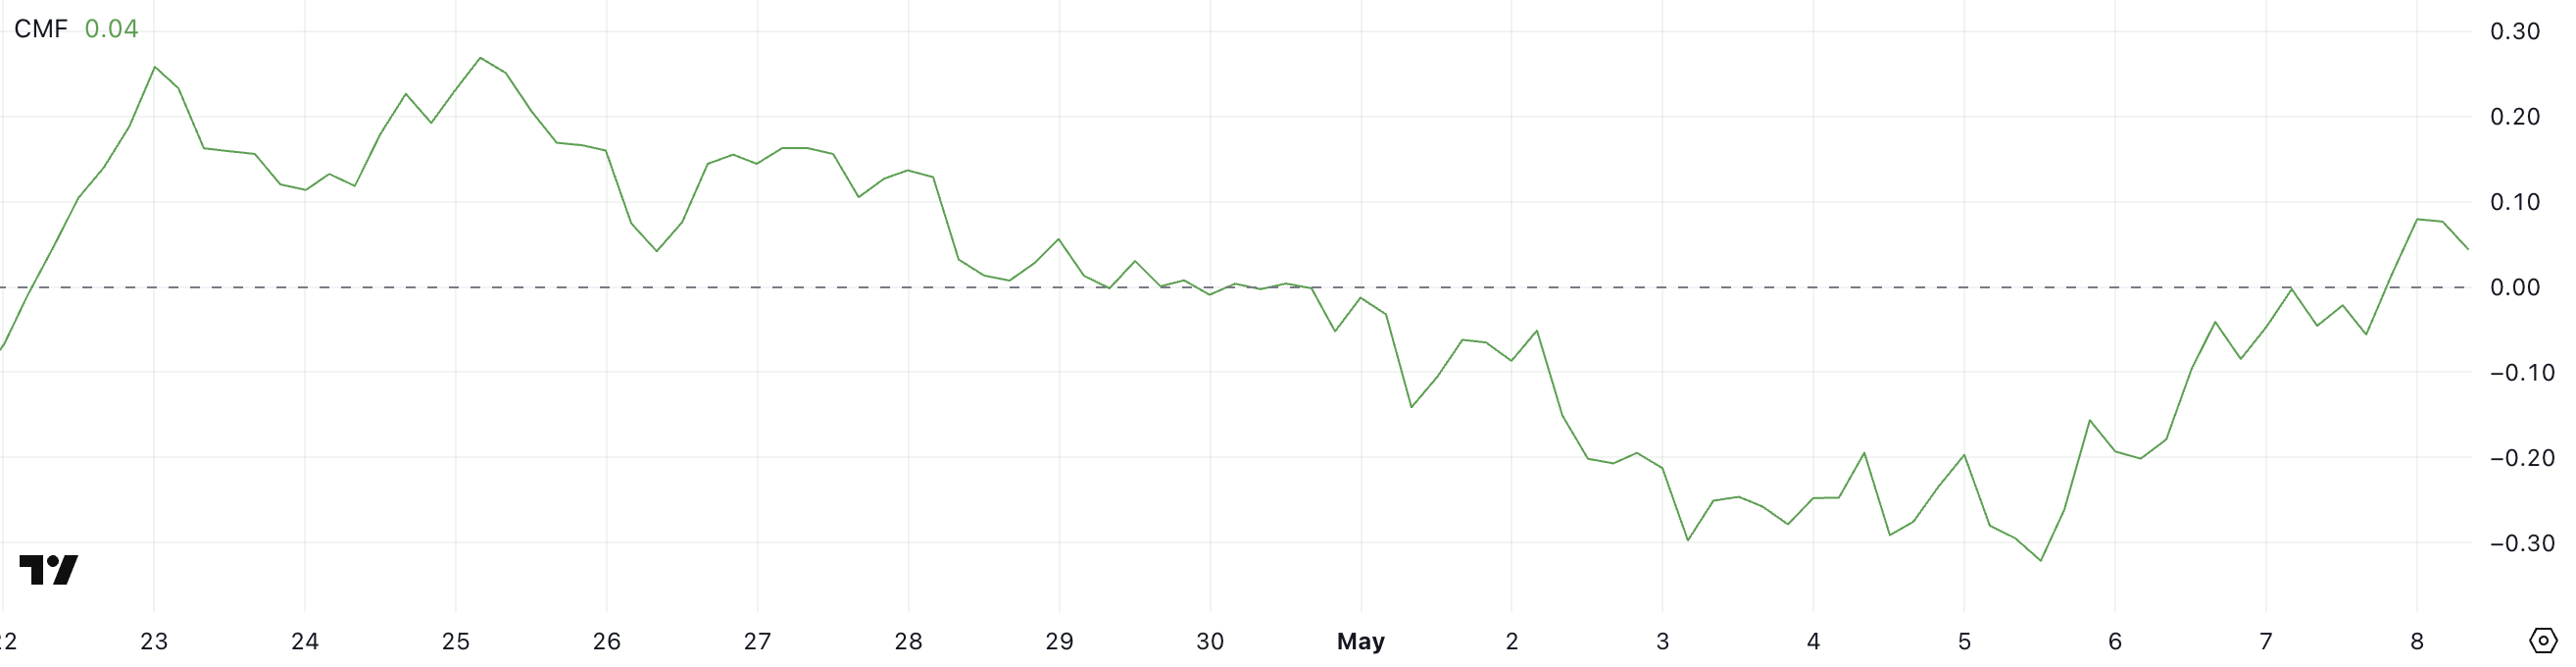
Stellar CMF Turns Positive, But Buying Pressure Remains Cautious
Stellar’s Chaikin Money Flow (CMF) indicator currently sits at 0.04, rebounding from -0.32 just three days ago.
This return to positive territory signals a short-term shift toward buying pressure, though it has pulled back slightly from 0.08 earlier today.
While the bounce is encouraging, the CMF hasn’t broken above the key 0.10 level since April 28, suggesting that sustained capital inflows remain limited for now.
The CMF measures the volume-weighted flow of money into and out of an asset over a set period. It ranges between -1 and +1, with values above 0 indicating buying pressure and values below 0 signaling selling pressure.
A CMF reading above 0.10 typically confirms strong accumulation, while readings near zero reflect indecision or weak conviction.
With XLM’s CMF at 0.04, the market is showing early signs of accumulation, but not enough to confirm a strong bullish trend. For further upside, XLM would likely need to see CMF push consistently above 0.10.
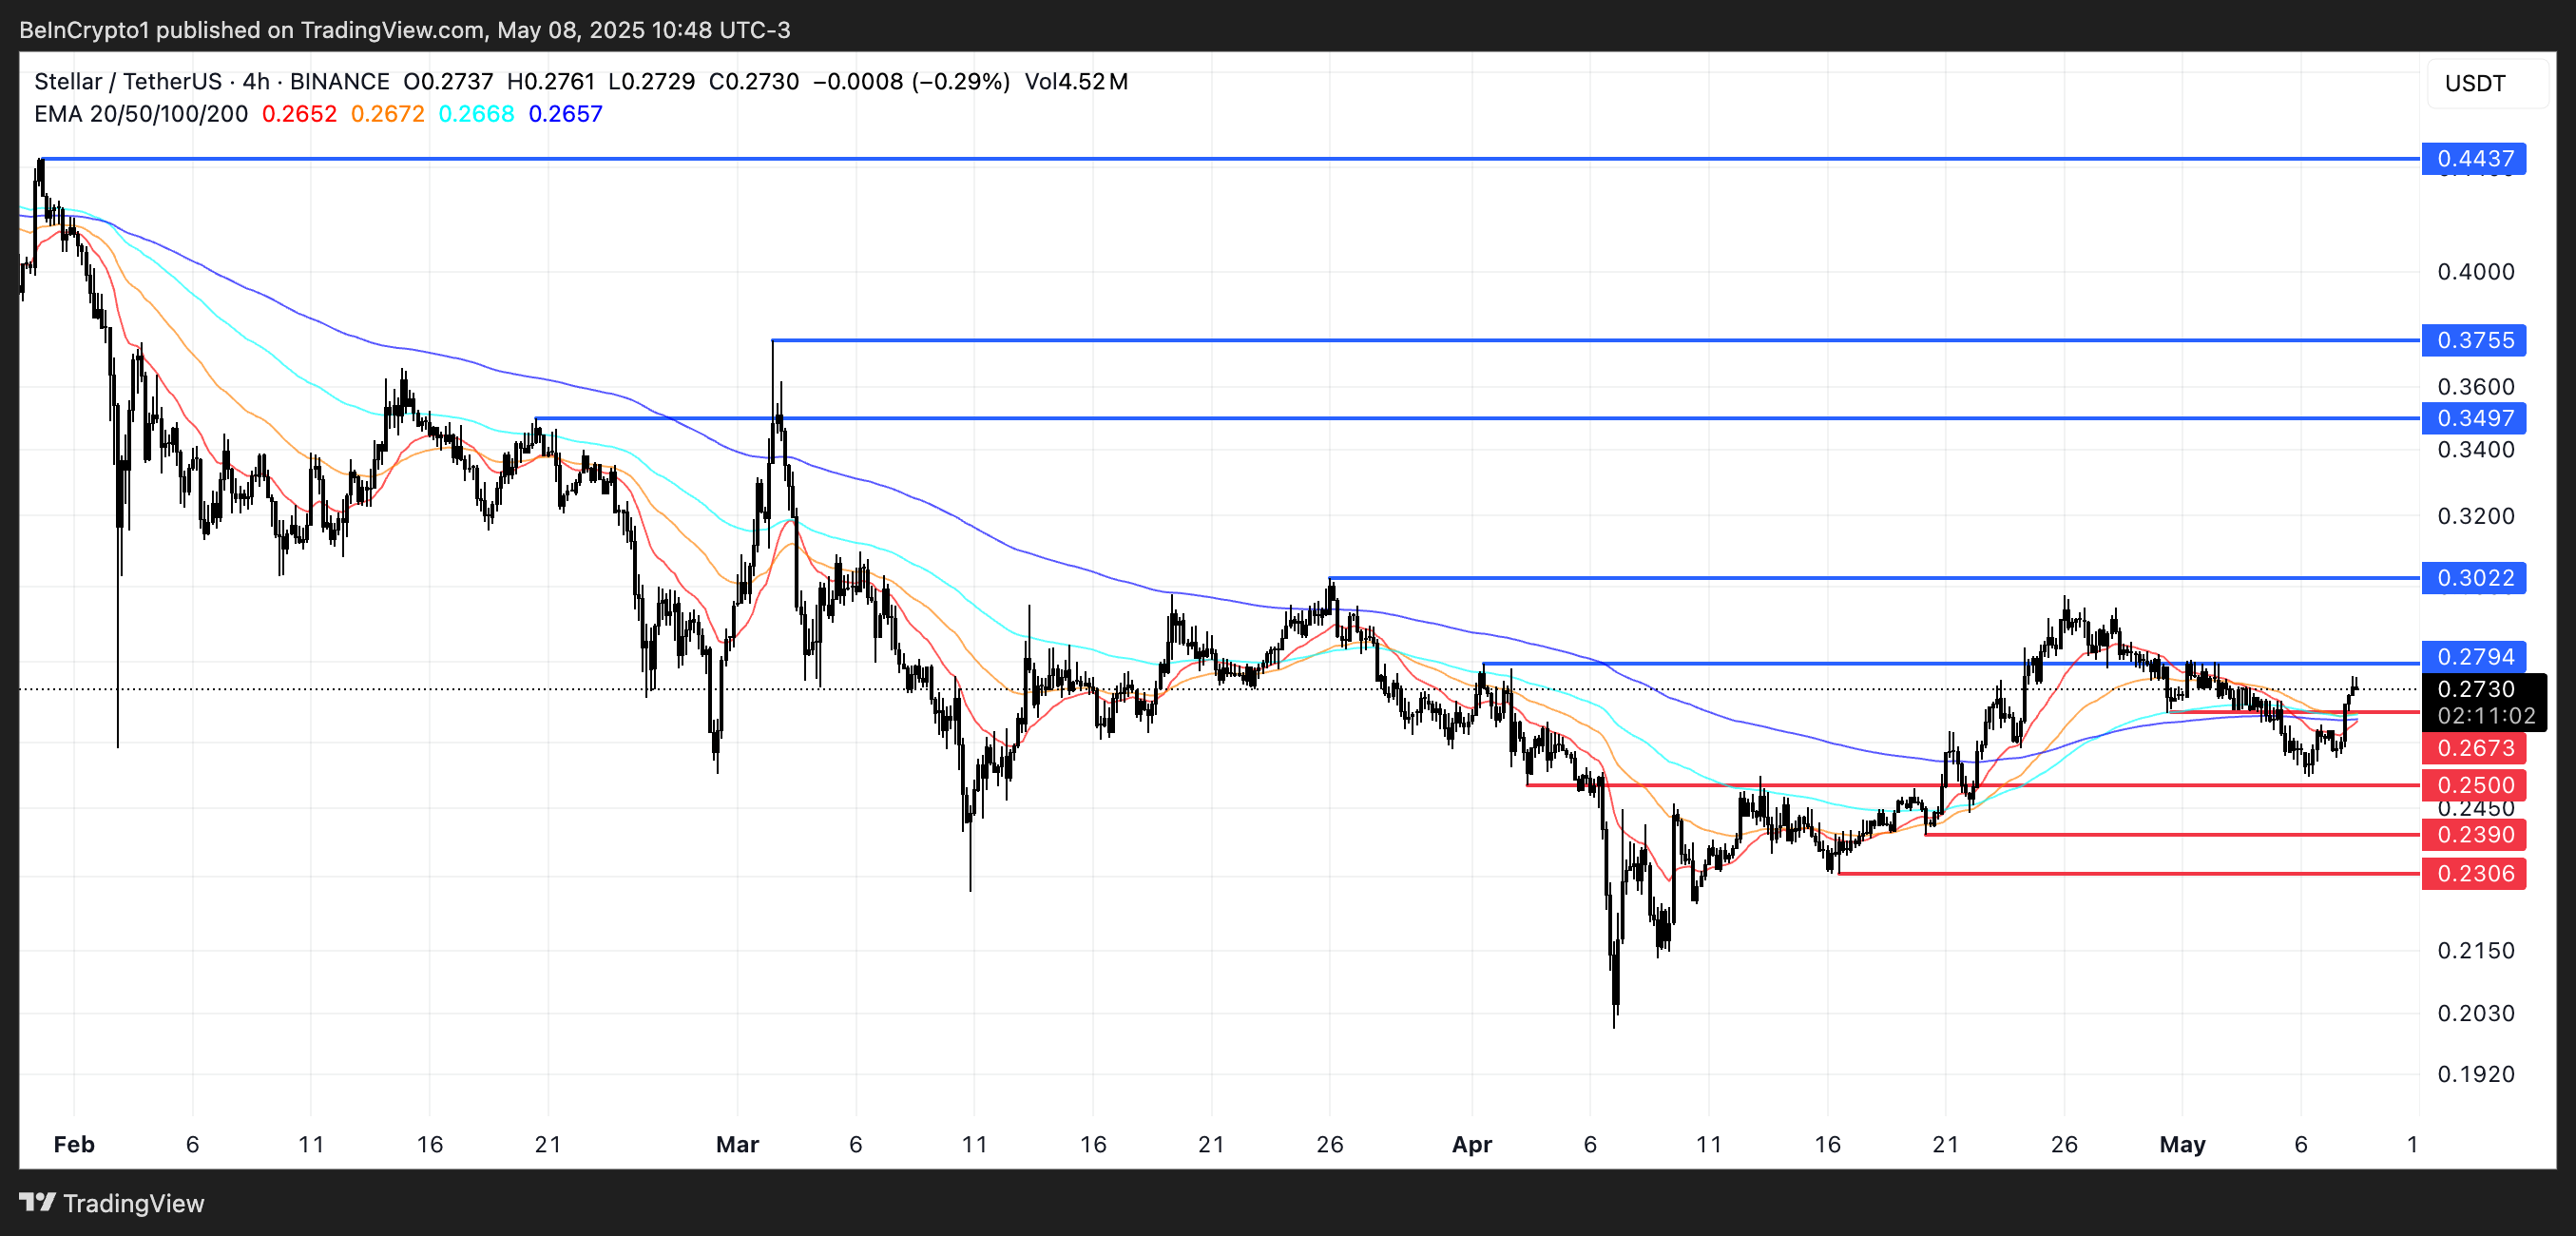
XLM Eyes Breakout as Golden Cross Nears
Stellar price is currently trading in a narrow range between resistance at $0.279 and support at $0.267.
Its EMA lines are tightening, and a golden cross may be forming soon—a bullish signal that occurs when the short-term EMA crosses above the long-term one.
If XLM breaks above $0.279, it could rally toward $0.30, with further upside targets at $0.349 and $0.375. Should bullish momentum remain strong, a move to $0.443 is also possible.
However, if the breakout fails, XLM could fall back to $0.267 support. A breakdown below that level would expose the token to $0.25, followed by $0.239 and $0.230.
Beyond technicals, concerns about supply concentration remain in focus—data shows the top 10 XLM wallets hold nearly 80% of the circulating supply. Binance’s XLM balance has also grown from 180 million to 1 billion since late 2023, raising the risk of volatility if large holders sell.
Still, adoption is growing. Stellar’s tokenized real-world asset (RWA) market has surged 84% in 2025, with key players like Franklin Templeton and Circle helping drive over $500 million in on-chain value.