BitOrigin Ltd has announced the purchase of approximately 40.5 million DOGE. This strategic acquisition marks the first phase of BitOrigin’s $500 million Dogecoin treasury plan. BitOrigin Bets Big With Dogecoin Treasury In a press release, Nasdaq-listed BitOrigin revealed the purchase of 40.5 million DOGE worth approximately $10 million. This suggests the start of its 500M
Today, approximately $8.05 billion worth of Bitcoin (BTC) and Ethereum (ETH) options expire, prompting crypto market participants to brace for volatility.
Traders and investors should be particularly attentive to today’s options expiry due to its volume and notional value, increasing the odds of potential influence on short-term trends. However, the put-to-call ratios and maximum pain points provide insight into what can be expected and the possible market directions.
Insights on Today’s Expiring Bitcoin and Ethereum Options
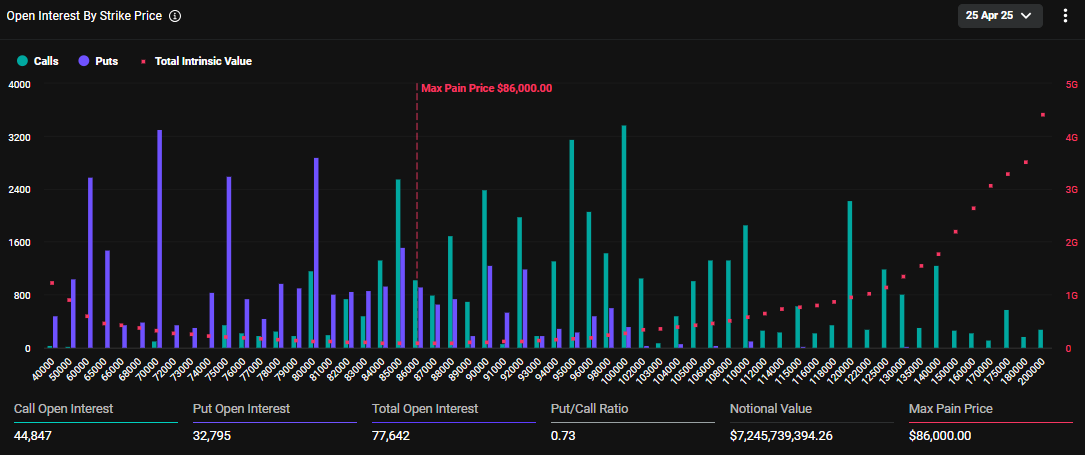
The notional value of today’s expiring Bitcoin options is $7.24 billion. According to Deribit’s data, these 77,642 expiring Bitcoin options have a put-to-call ratio 0.73. This ratio suggests a prevalence of purchase options (calls) over sales options (puts).
The data also reveals that the maximum pain point for these expiring options is $86,000. In crypto options trading, the maximum pain point is the price at which the asset will cause the greatest number of holders’ financial losses.
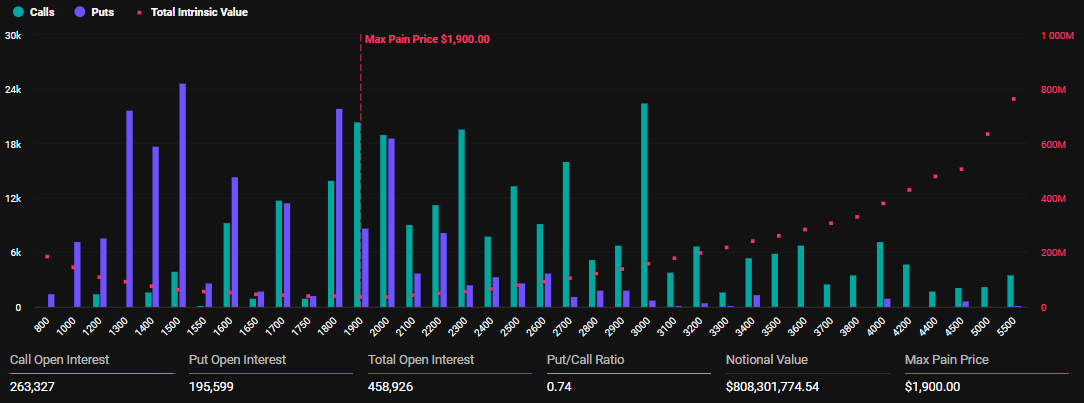
In addition to Bitcoin options, 458,926 Ethereum options contracts are set to expire today. These expiring options have a notional value of $808.3 million, a put-to-call ratio of 0.74, and a maximum pain point of $1,900.
The number of today’s expiring Ethereum options was significantly higher than last week. BeInCrypto reported that last week’s expired ETH options were 177,130 contracts, with a notional value of $279.789 million.
As of this writing, Bitcoin was trading well above its maximum pain level of $86,000 at $93,471. Meanwhile, Ethereum was trading below its strike price of $1,900 at $1,764.
“BTC trades above max pain, ETH below. Positioning into expiry is anything but aligned,” Deribit analysts remarked.
With the max pain level (also called strike price) often acting as a magnet for price due to smart money actions, both Bitcoin and Ethereum could pull towards their respective levels.
The positioning of both BTC and ETH open interest indicates high trader activity near max pain. The dense clustering of their respective histograms around $80,000 to $90,000 for Bitcoin and around $1,800 to $2,000 for Ethereum shows this.
This positioning suggests potential for short-term price consolidation or volatility.
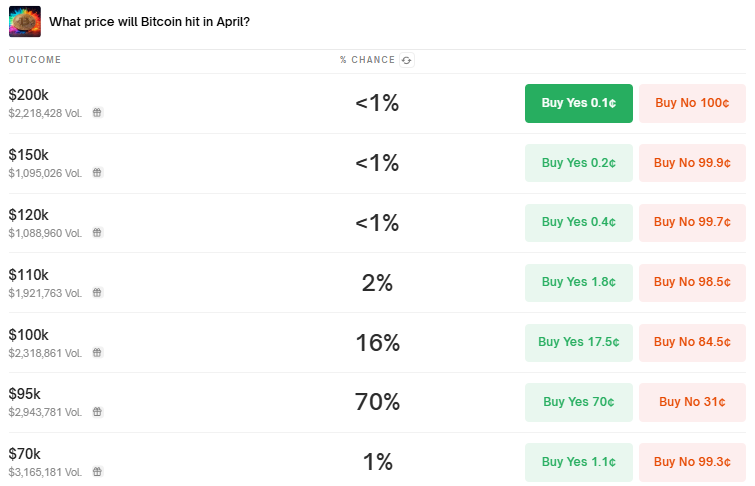
Polymarket: Only 16% Chance Bitcoin Price Hits $100,000 in April
According to Deribit, traders are selling cash-secured put options on Bitcoin. Further, they are using stablecoins to collect premiums while positioning to buy BTC at lower prices. This reflects a long-term bullish outlook.
“BTC traders on Deribit are expressing long-term bullish sentiment, selling cash-secured puts using stablecoins to potentially buy the dip and collect yield,” Deribit wrote.
Analysts on Deribit also note the highest open interest for BTC options around the $100,000 strike price. This indicates strong market expectations of Bitcoin reaching this level.
Nevertheless, data on the Polymarket prediction platform shows traders estimating only a 16% chance of BTC hitting $100,000 in April.
Another interesting observation is that the Cumulative delta (CD) across BTC and related ETF (exchange-traded fund) options on Deribit reached $9 billion. While this shows high sensitivity to Bitcoin price changes, it also suggests potential volatility as market makers hedge their positions.
Notwithstanding, Deribit analysts also reveal a surge in Bitcoin call option buying for April to June 2025 expiries. Investors are reportedly targeting strikes between $90,000 and $110,000, a sentiment inspired by Bitcoin’s price breaking above 89,000.
Nevertheless, not all activity leading up to Bitcoin’s recovery was new money or a fresh capital influx. According to an analysis by Deribit’s Tony Stewart, half of it involved rolling up existing positions, indicating strategic adjustments by traders.
While investors are scanning the horizon for a short-term Solana (SOL) rally, cryptocurrency expert CryptoCurb is predicting an ultra-bullish price movement. CryptoCurb argues that a Solana price of $2,000 is “absolutely realistic” given the current fundamentals and on-chain indicators.
Solana Price To $2,000 Is A Realistic Projection
Pseudonymous cryptocurrency analyst CryptoCurb is predicting a massive growth spurt for Solana in the near future. In an X post, the expert says the Solana price can achieve a valuation of $2,000 given its impressive network metrics.
He hinges his projection on several factors, including Ethereum’s previous price performance. Ethereum price spiked to a $600 billion market capitalization during the last cycle with its steep fees and scalability issues.
A $2K SOL price will translate to a $1 trillion market capitalization that will see it flip Ethereum as the largest altcoin. CryptoCurb notes that if Ethereum can post impressive figures during the last cycle, Solana has the capabilities to be valued at $2,000.
“2K is absolutely realistic if Solana keeps its global adoption pace with minimal disruptions and continues to scale,” said CryptoCurb.
Rising network inflows are expected to send the Solana price on a short-term rally to $150 before a big push to $2K. Currently, the Solana price is pegged at $140 with a market capitalization of $72.6 billion, making CryptoCurb’s prediction an uphill climb.
A Wave Of Impressive Metrics Around SOL
While CryptoCurb did not disclose an exact timeline for his $2,000 prediction, he points to a short-term seismic price increase. The expert his backing his predictions with a swathe of network metrics pointing to fresh bullishness.
Solana has the highest number of active addresses over the last seven days at 28.4 million. The network led the pack for transactions at 369 million, trouncing Tron, BNB Chain, Base, and Bitcoin.
Solana is finding application in several Web 3 verticals given its speed, low cost, and scalability. In the last week, the Solana price has risen by nearly 7% while 24-hour trade volume has risen by 36%.
Last week, Canada launched the first SOL ETF with prices projected to surpass $250, reversing a forming death cross. Solana open interest crossed 5.5 billion, climbing by 10% amid rising whale activity in the ecosystem.
Rising bullish metrics for the network suggest that SOL will reach $200 before ETH reclaims $3,000.
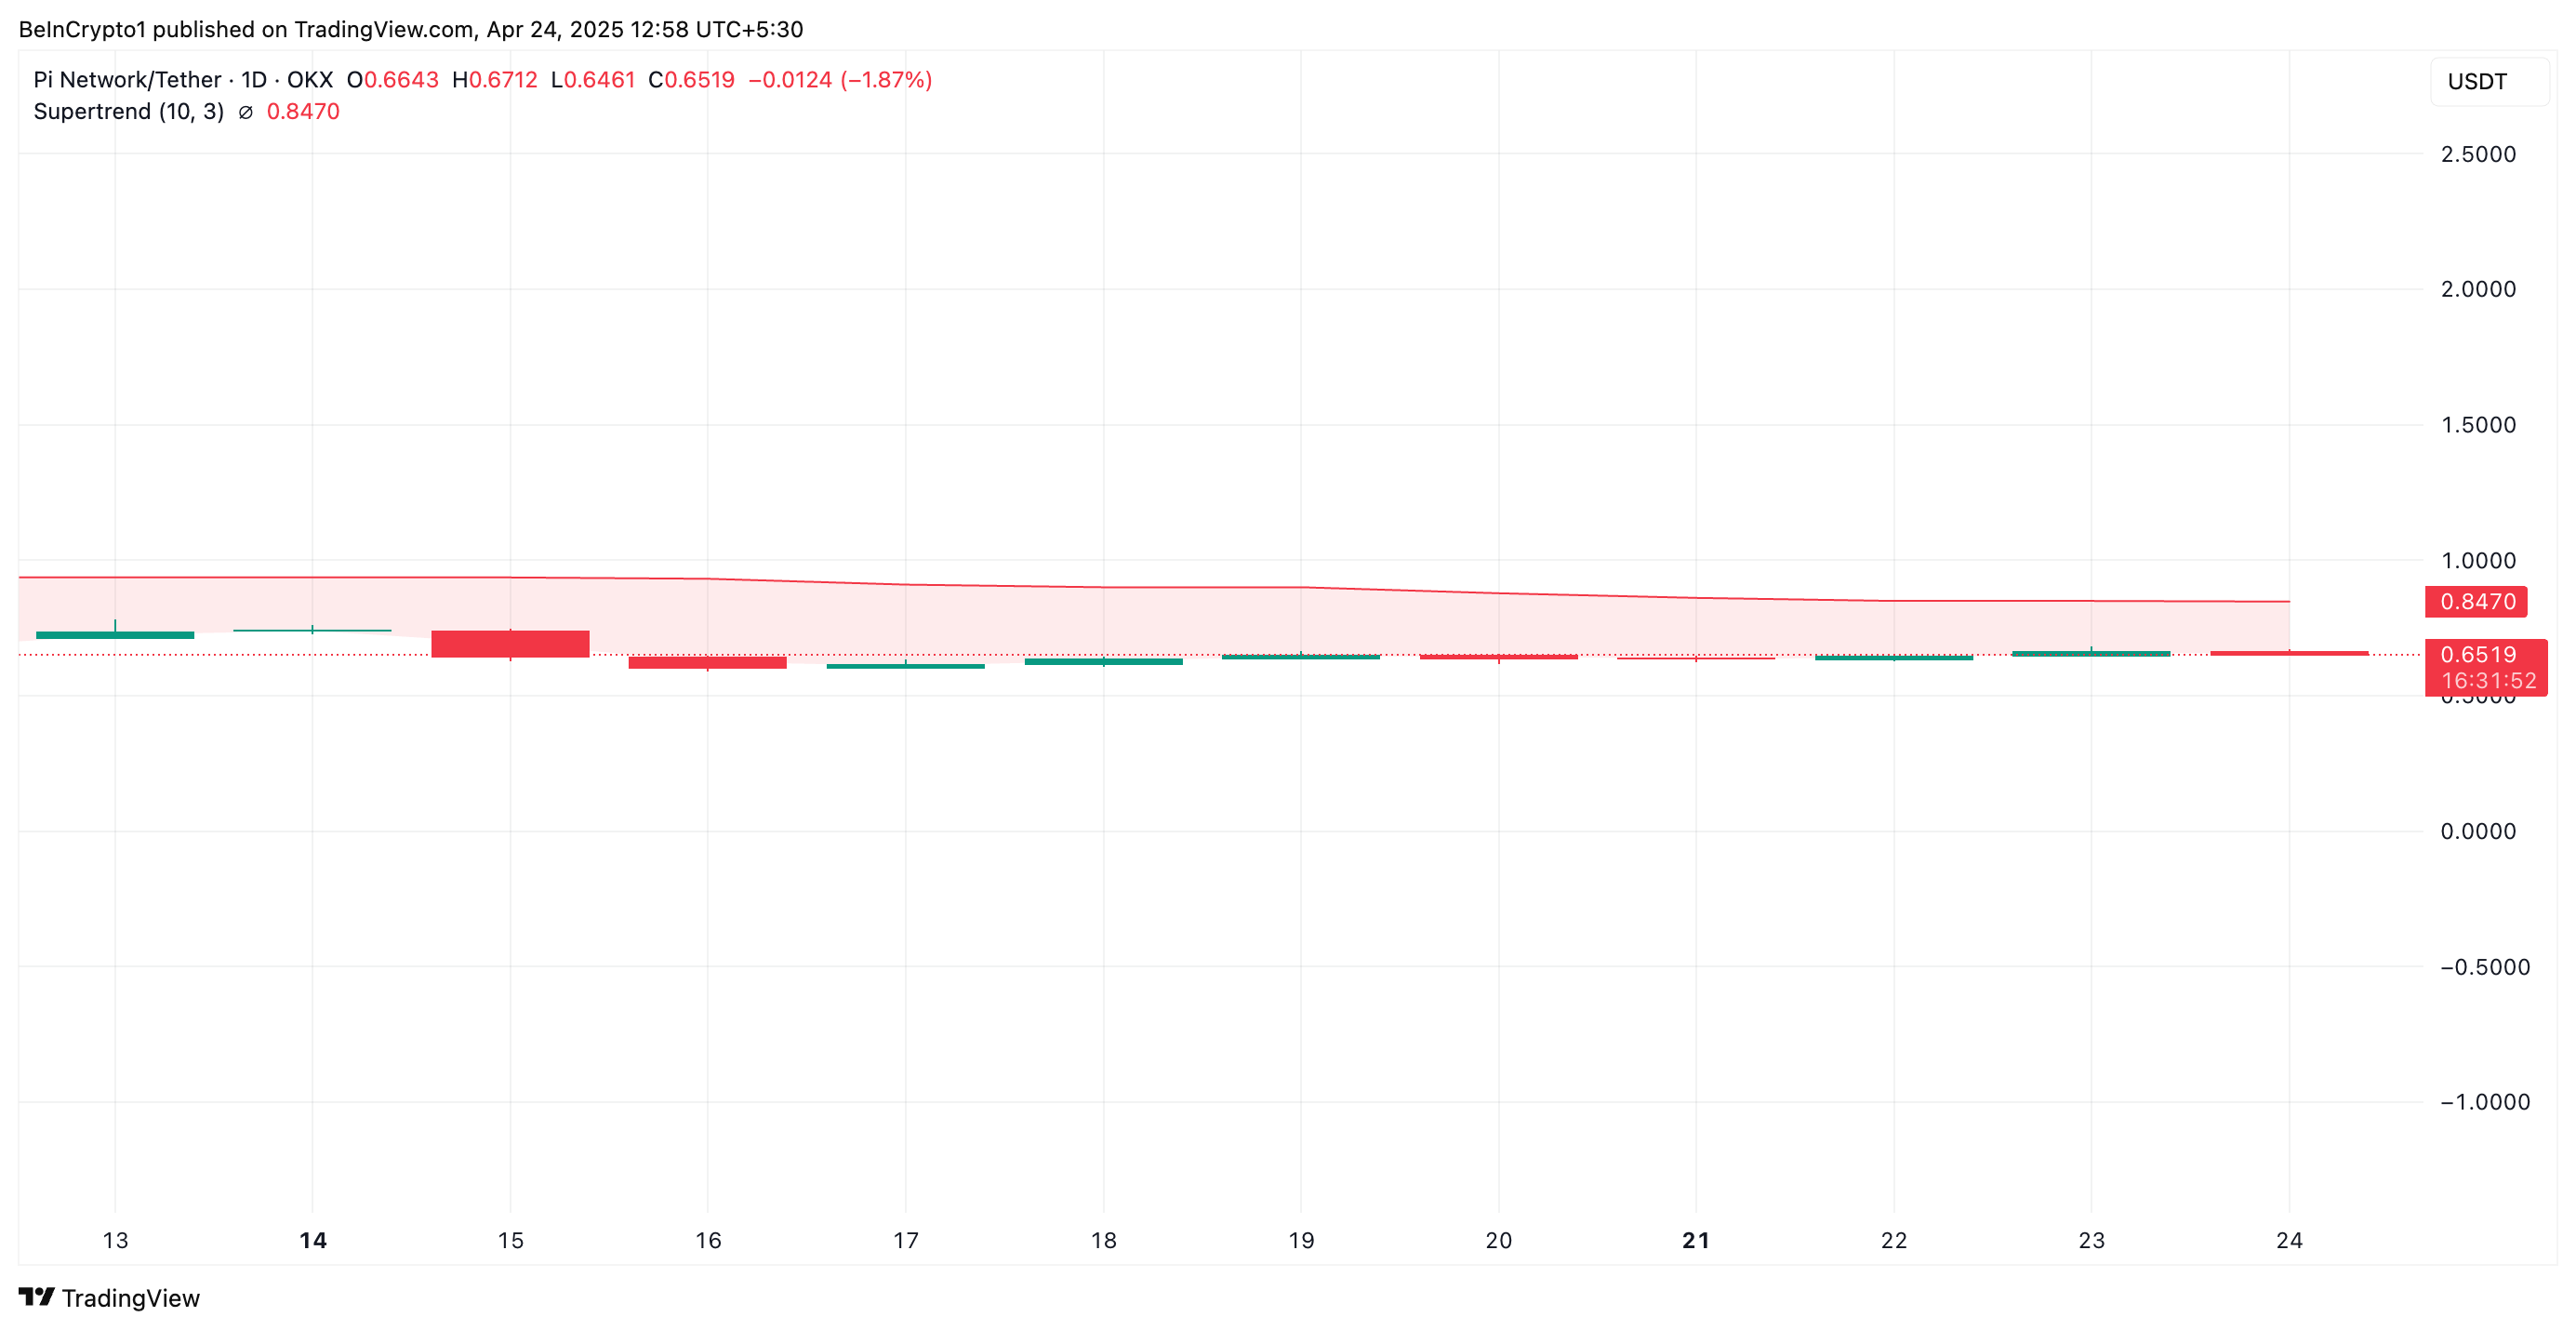
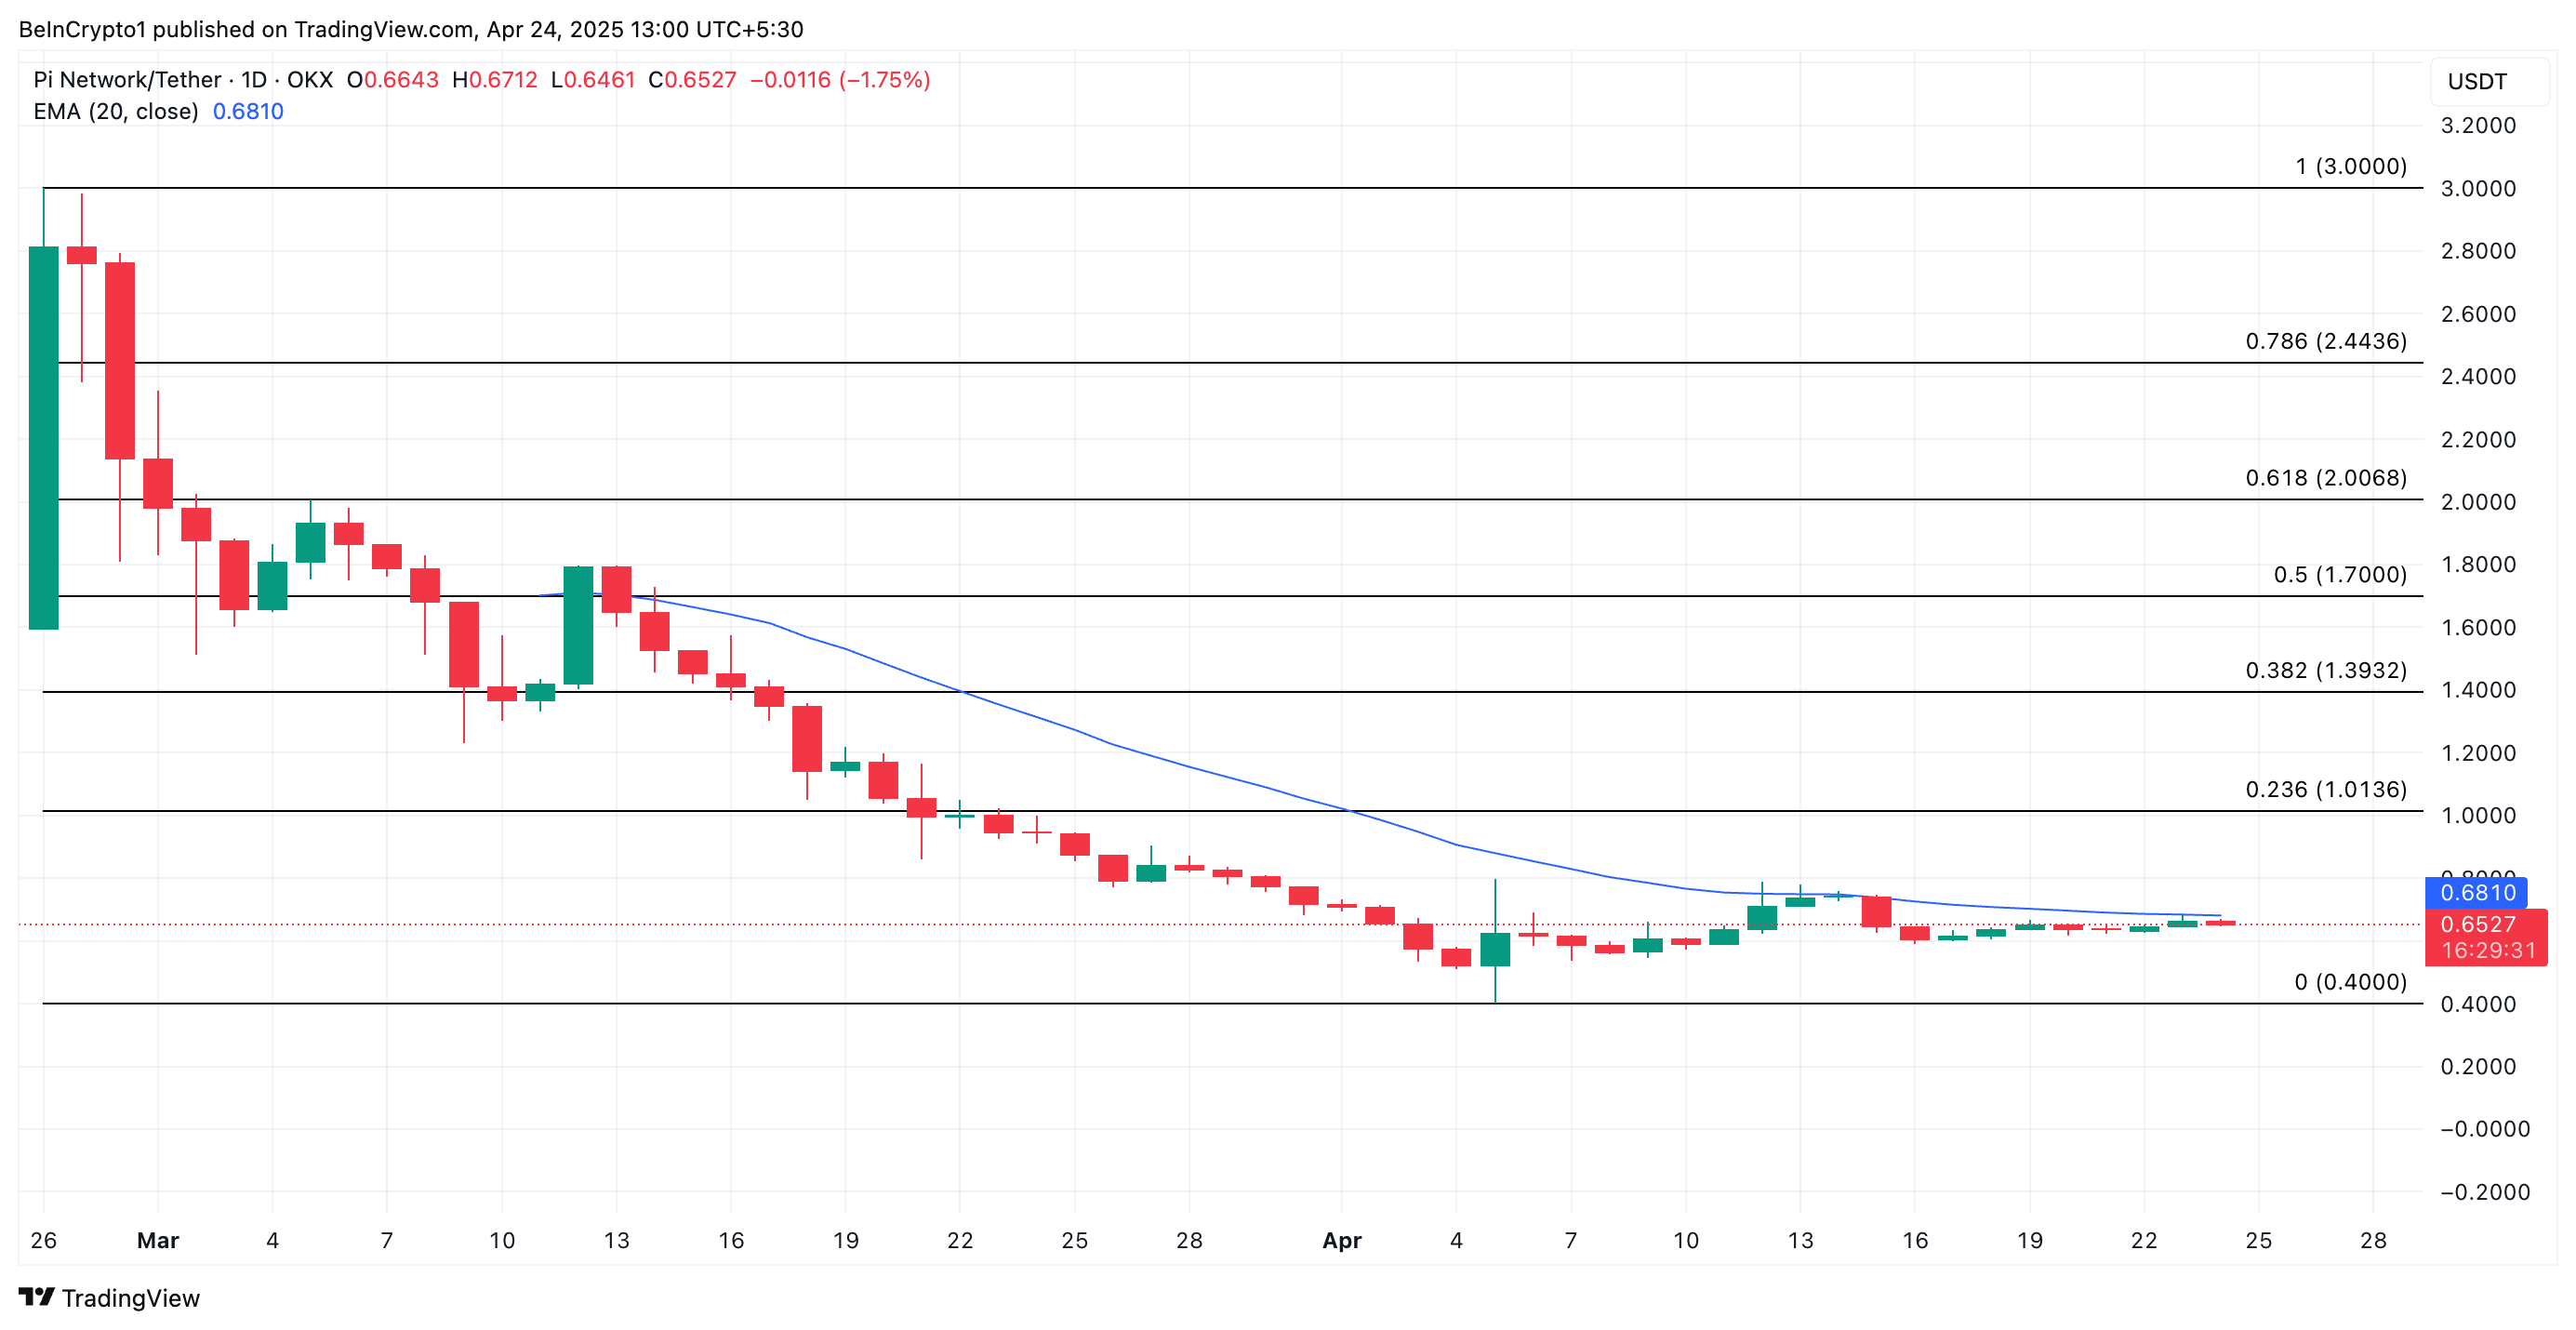
PI’s price has climbed 7% over the last seven days, signaling modest upward momentum. It currently trades at $0.65.
However, technical readings reveal that the rally largely lacks conviction from bullish traders, suggesting the price growth is more reflective of overall market growth than demand for PI.
PI Climbs, But Momentum Stalls
A key indicator supporting this outlook is the Relative Strength Index (RSI), which has remained largely flat despite the price uptick. This indicates a balance between PI’s buying and selling pressure, rather than a surge in bullish sentiment that typically accompanies sustainable rallies.
The RSI indicator measures an asset’s overbought and oversold market conditions. It ranges between 0 and 100. Values above 70 suggest that the asset is overbought and due for a price decline, while values under 30 indicate that the asset is oversold and may witness a rebound.
When it is flat like this, there is a balance between buying and selling pressure, with no clear momentum in either direction. This signals market indecision or consolidation, rather than a strong trend, despite PI’s price hike.
Further, PI’s Super Trend indicator, which continues to act as dynamic resistance above the token’s price, adds to the cautious outlook. This is currently at $0.85
The indicator helps traders identify the market’s direction by placing a line above or below the price chart based on the asset’s volatility.
As with PI, when an asset’s price trades below the Super Trend line, it signals a bearish trend, indicating that the market is in a downtrend and selling pressure is dominant.
As PI struggles to break above this level, the trend line reinforces bearish sentiment and suggests pushing the asset higher in the short term will be difficult.
PI Risks Drop to $0.40 Without Renewed Demand
PI currently trades at $0.65, resting below its 20-day exponential moving average (EMA). This indicator measures an asset’s average price over the past 20 trading days, giving more weight to recent prices.
When the EMA is positioned above the asset’s current price, it signals a short-term downtrend, indicating that recent prices are lower than the average of the past 20 days. If demand wanes further, PI could extend its losses and revisit its all-time low of $0.40.