Bitcoin’s decisive break above the psychological $95,000 barrier has reignited bullish momentum across the crypto market. As market sentiment becomes increasingly positive, crypto whales are buying several differentiating altcoins this week.
Among the top picks are Avalanche (AVAX), Ethereum (ETH), and meme-coin Pepe (PEPE), all of which have seen significant whale inflows this week.
Avalanche (AVAX)
Layer-1 (L1) coin AVAX has seen increased whale attention this week, reflected by the spike in its large holders’ netflow. According to IntoTheBlock, this has rocketed over 380% in the past seven days.
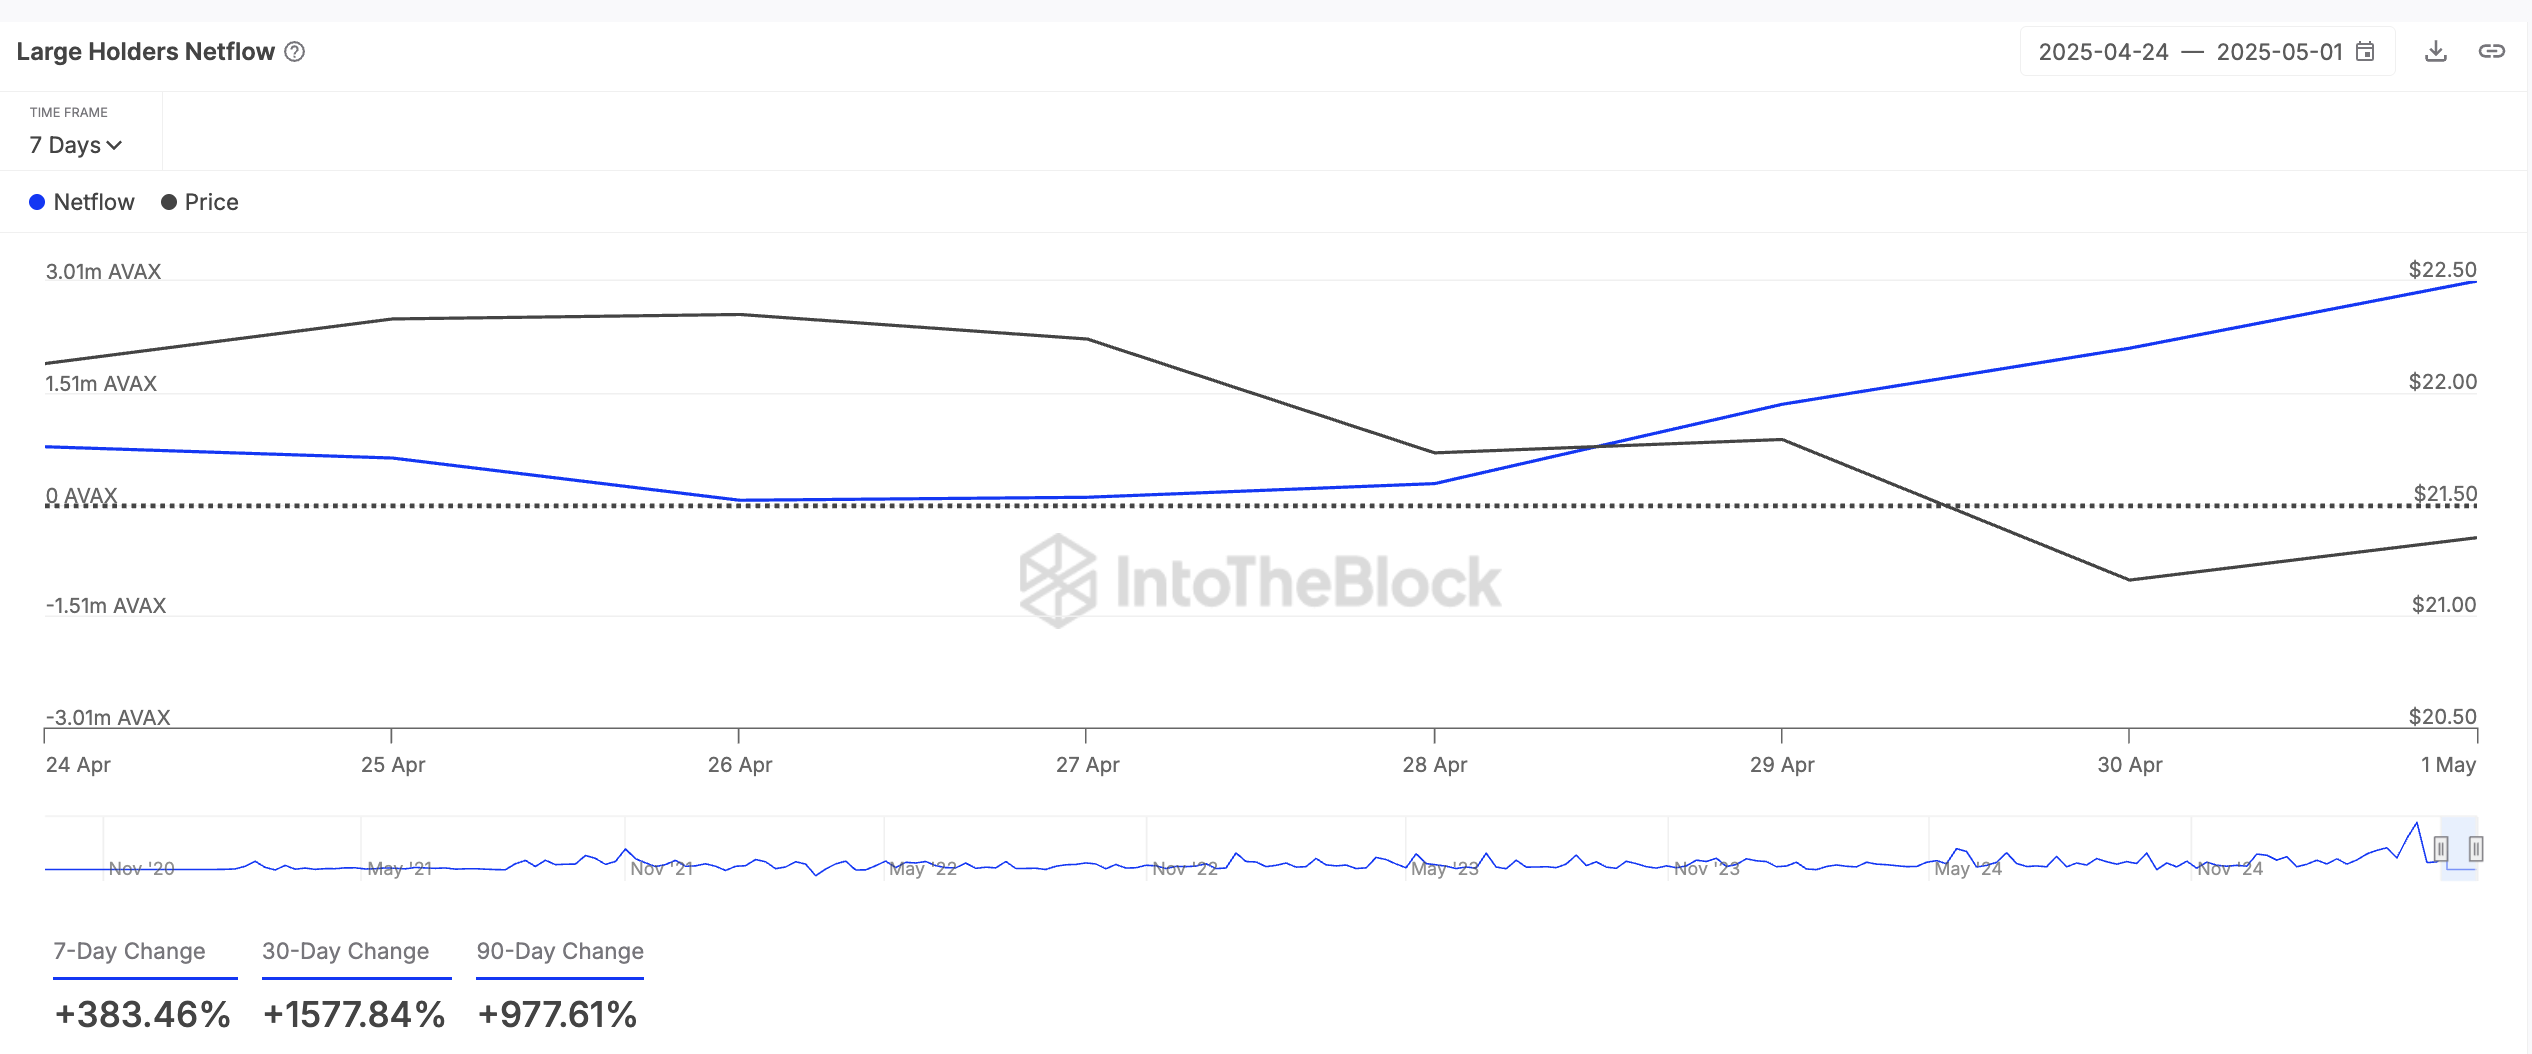
A large holder is a wallet address holding over 0.1% of an asset’s circulating supply. The large holders’ netflow tracks these investors’ buying and selling activity.
When it rises, crypto whales buy more tokens. This bullish signal often prompts retail investors to increase their holdings.
If AVAX’s accumulation trend persists, its price could breach the resistance at $24.28 and rally toward $30.23.
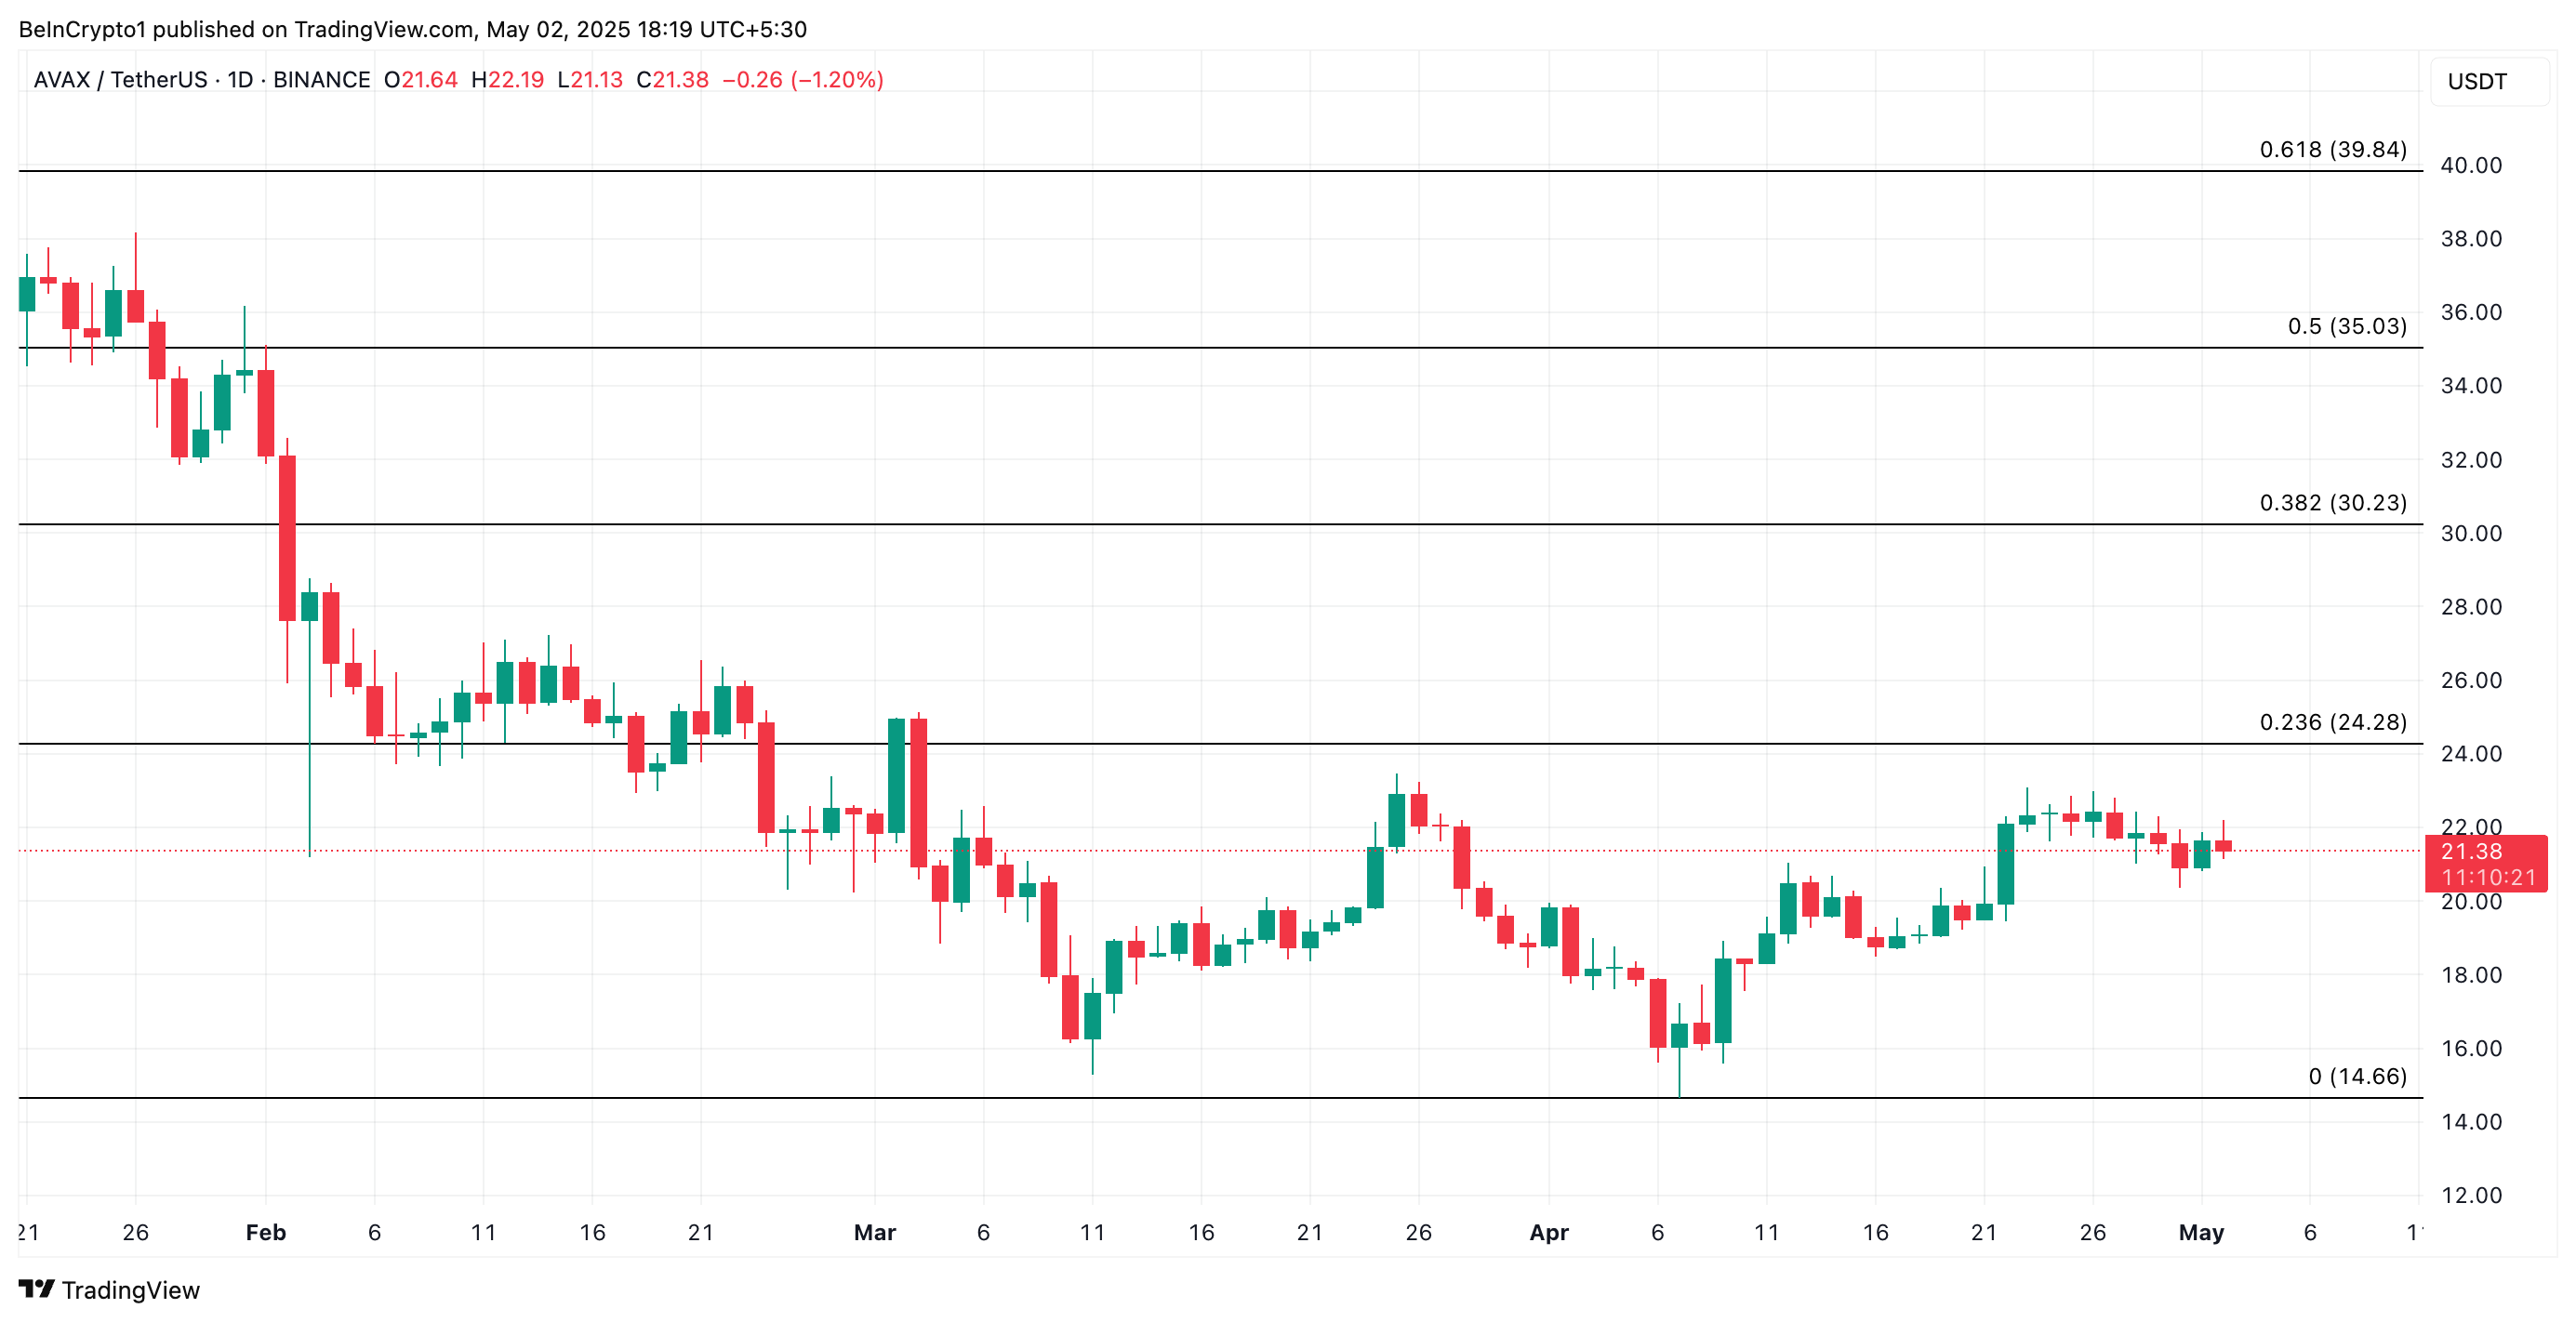
Conversely, if demand wanes, AVAX could fall to $14.66.
Ethereum (ETH)
Amid the recent broader market rally, ETH has recorded a modest 3% price uptick in the past seven days, buoyed by steady whale accumulation.
According to Santiment, during that period, whale addresses holding between 10,000 and 100,000 coins have acquired 280,000 ETH valued at over $510 million at current market prices.
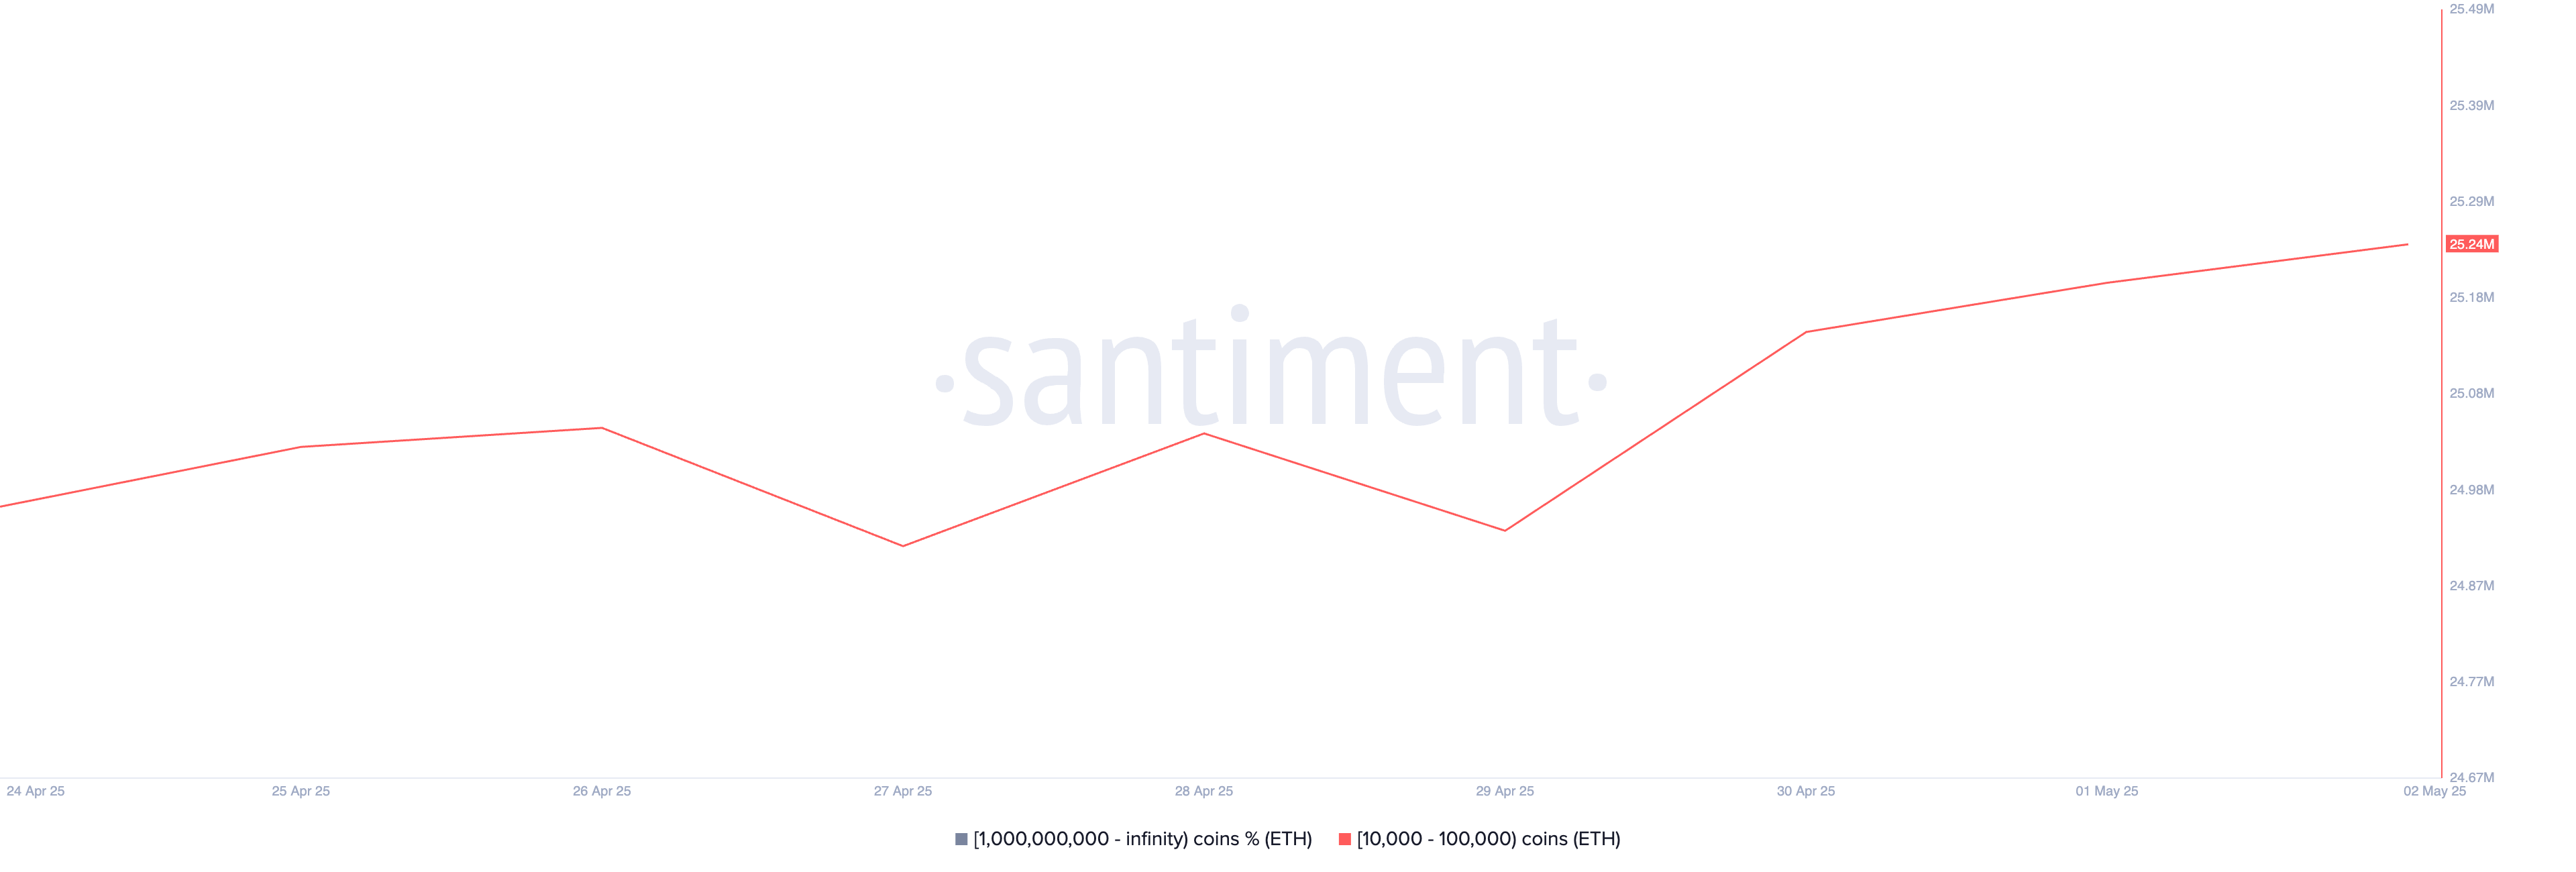
As of this writing, this cohort of ETH whales controls 25.24 million ETH, their highest holding in the past month. ETH’s price could be driven above the psychological $2,000 mark if whale accumulation persists.
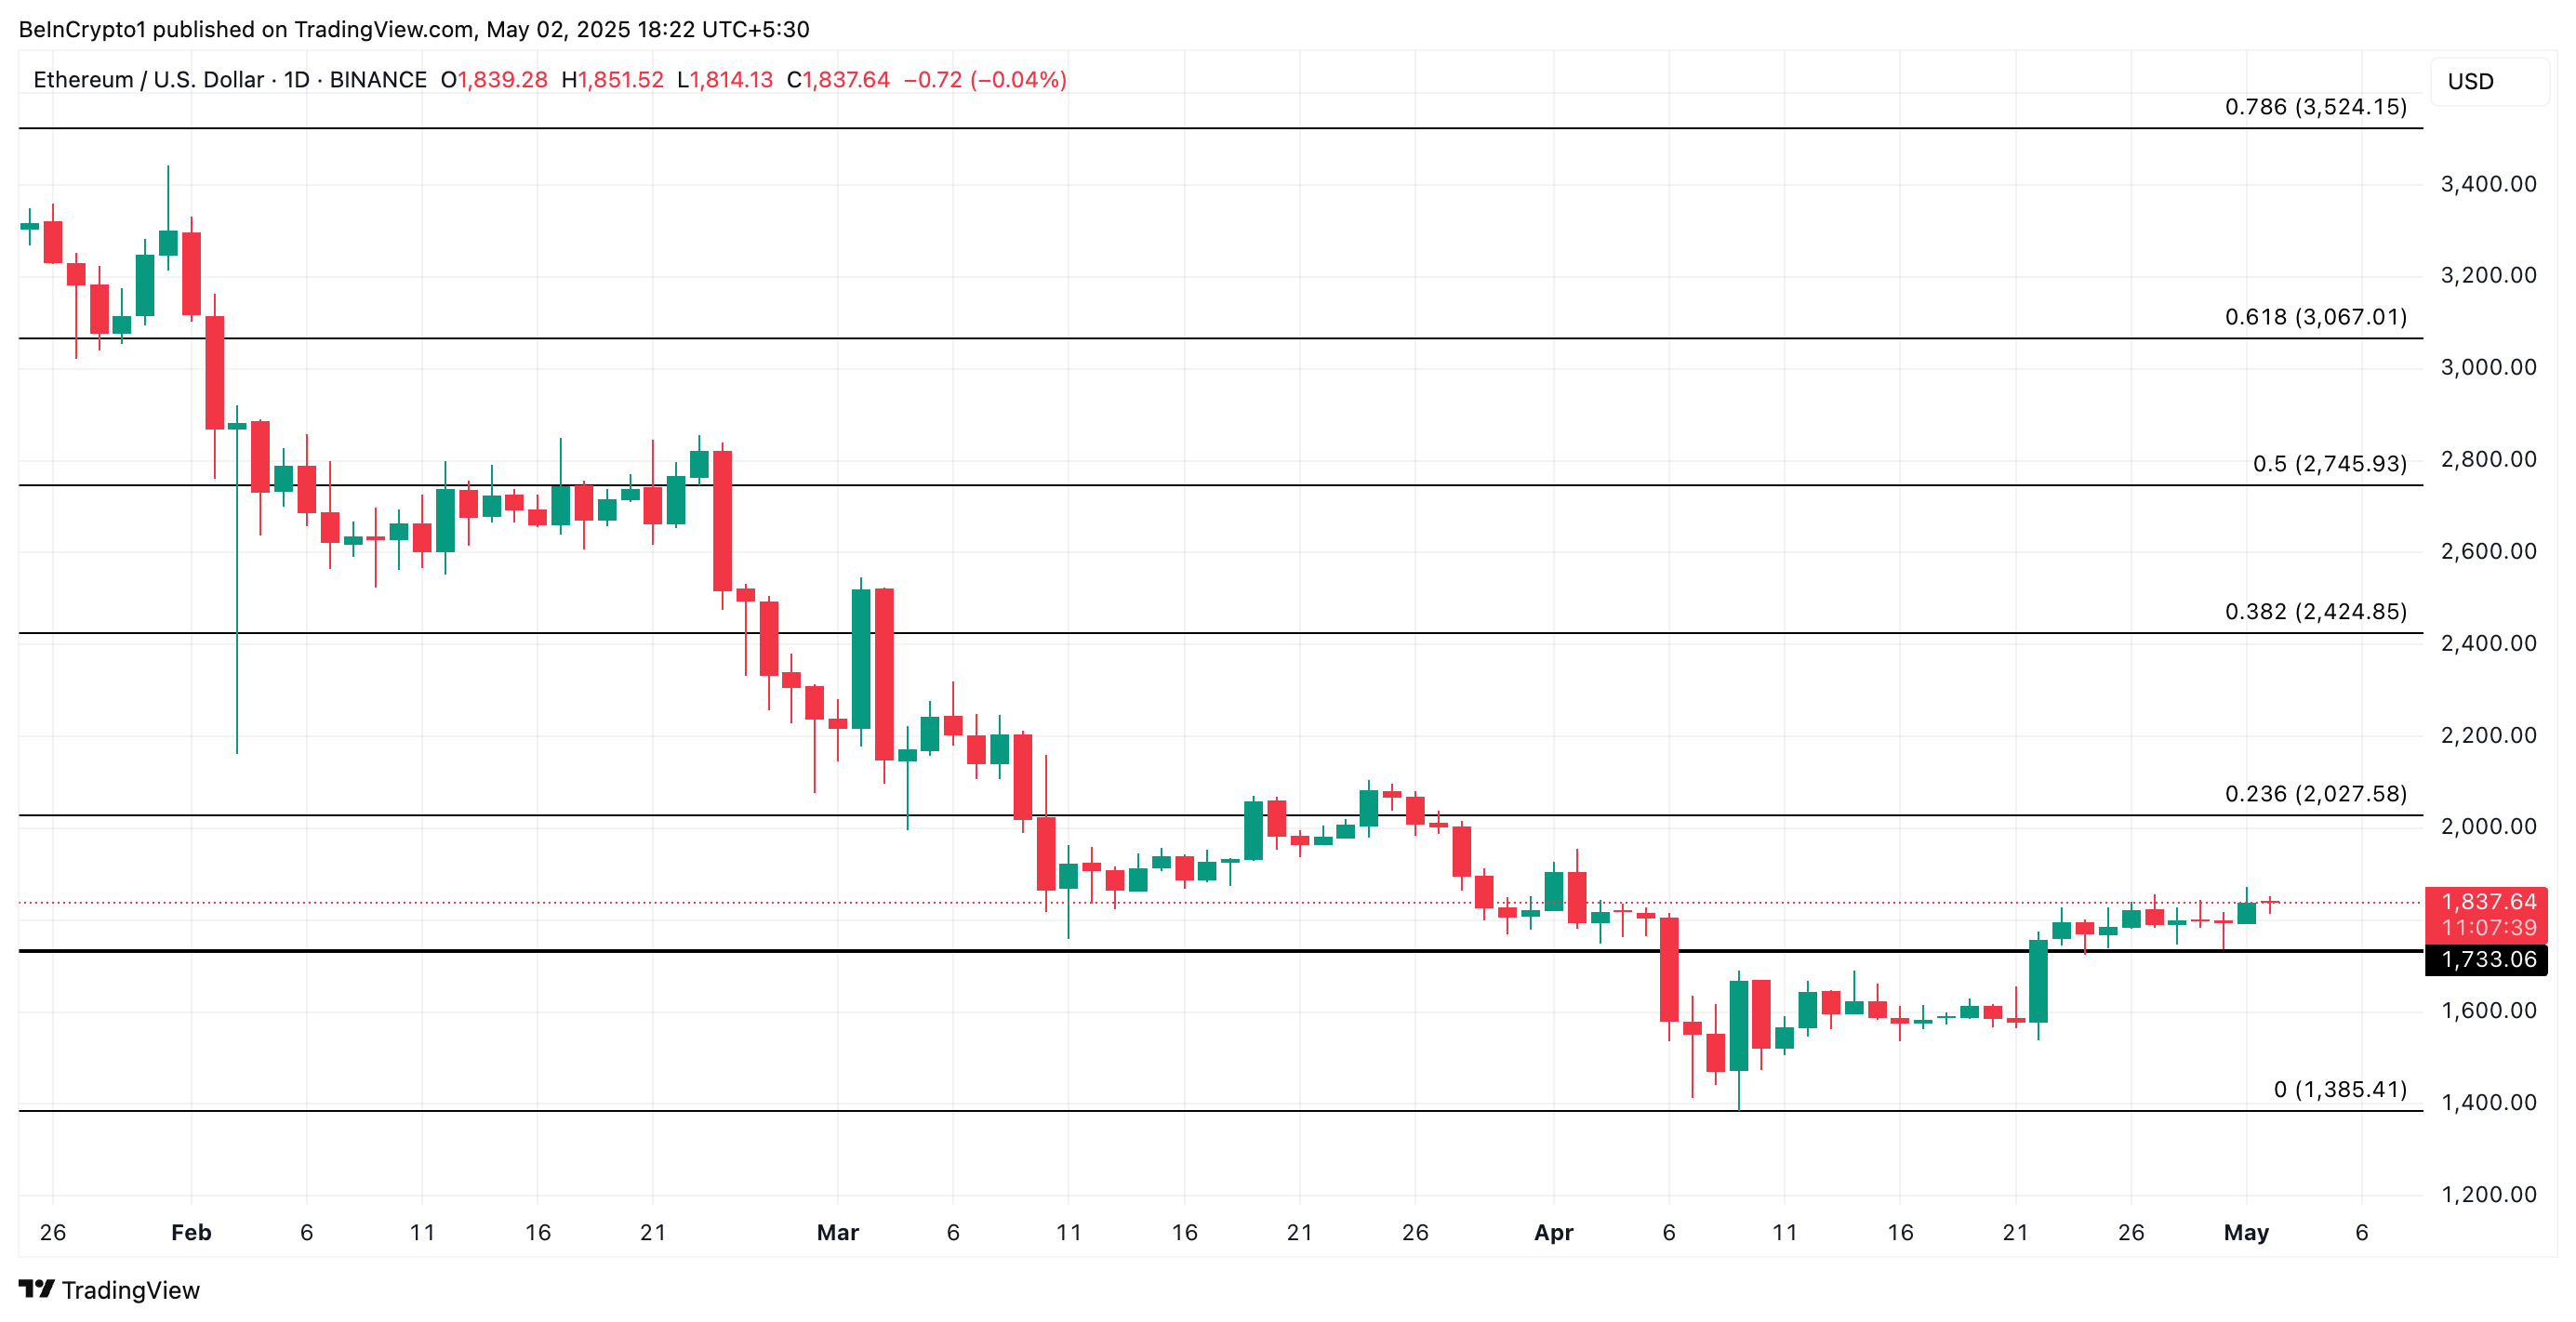
However, if the bears regain dominance, they could push the coin’s price to $1,733.
Pepe (PEPE)
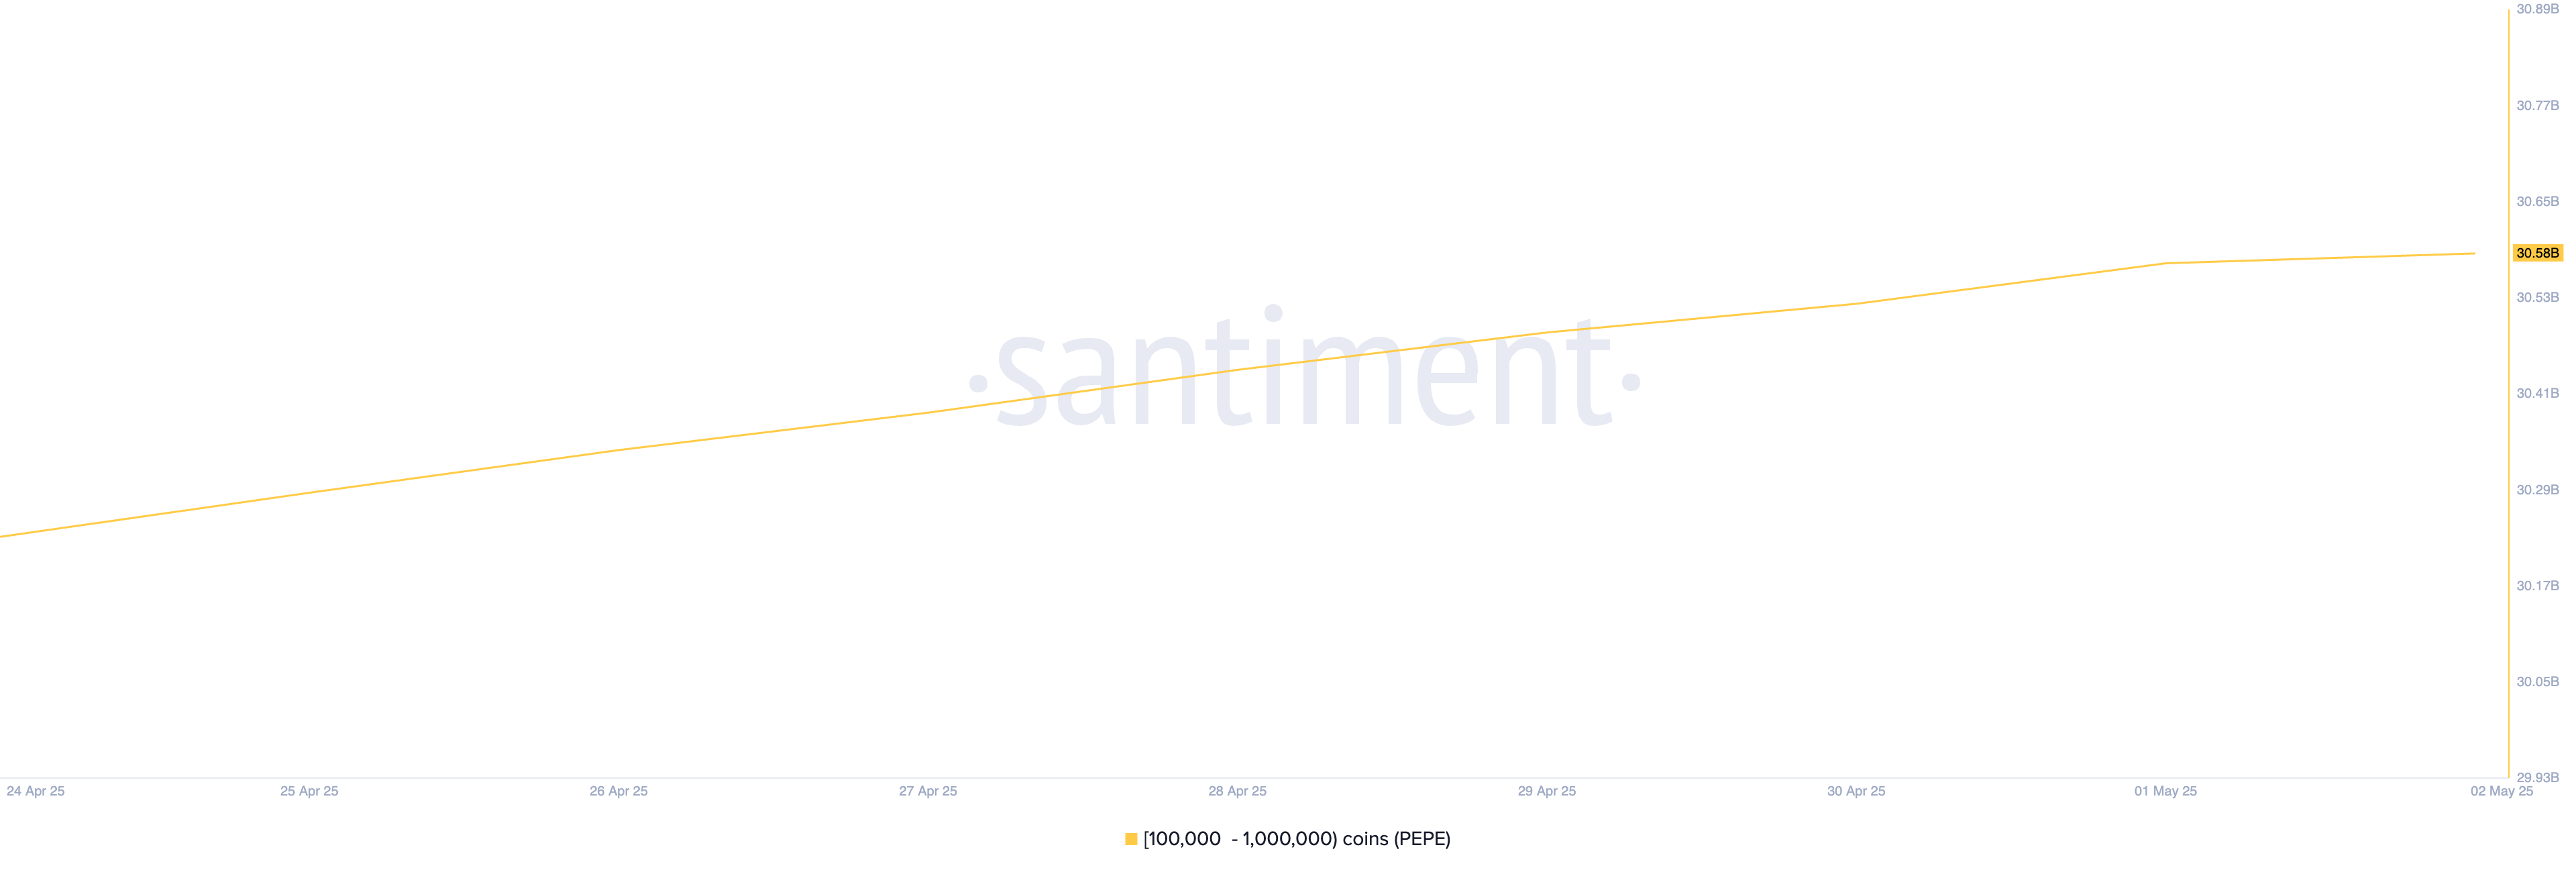
Popular meme coin PEPE is another asset that has seen a surge in crypto whale accumulation this week. Per Santiment, wallet addresses that hold between 100,000 and 1 million tokens have bought 350 million PEPE in the past seven days.
At press time, the meme coin trades at $0.0000086. If whale accumulation persists, PEPE could reverse its current downtrend and break above the resistance at $0.0000010.
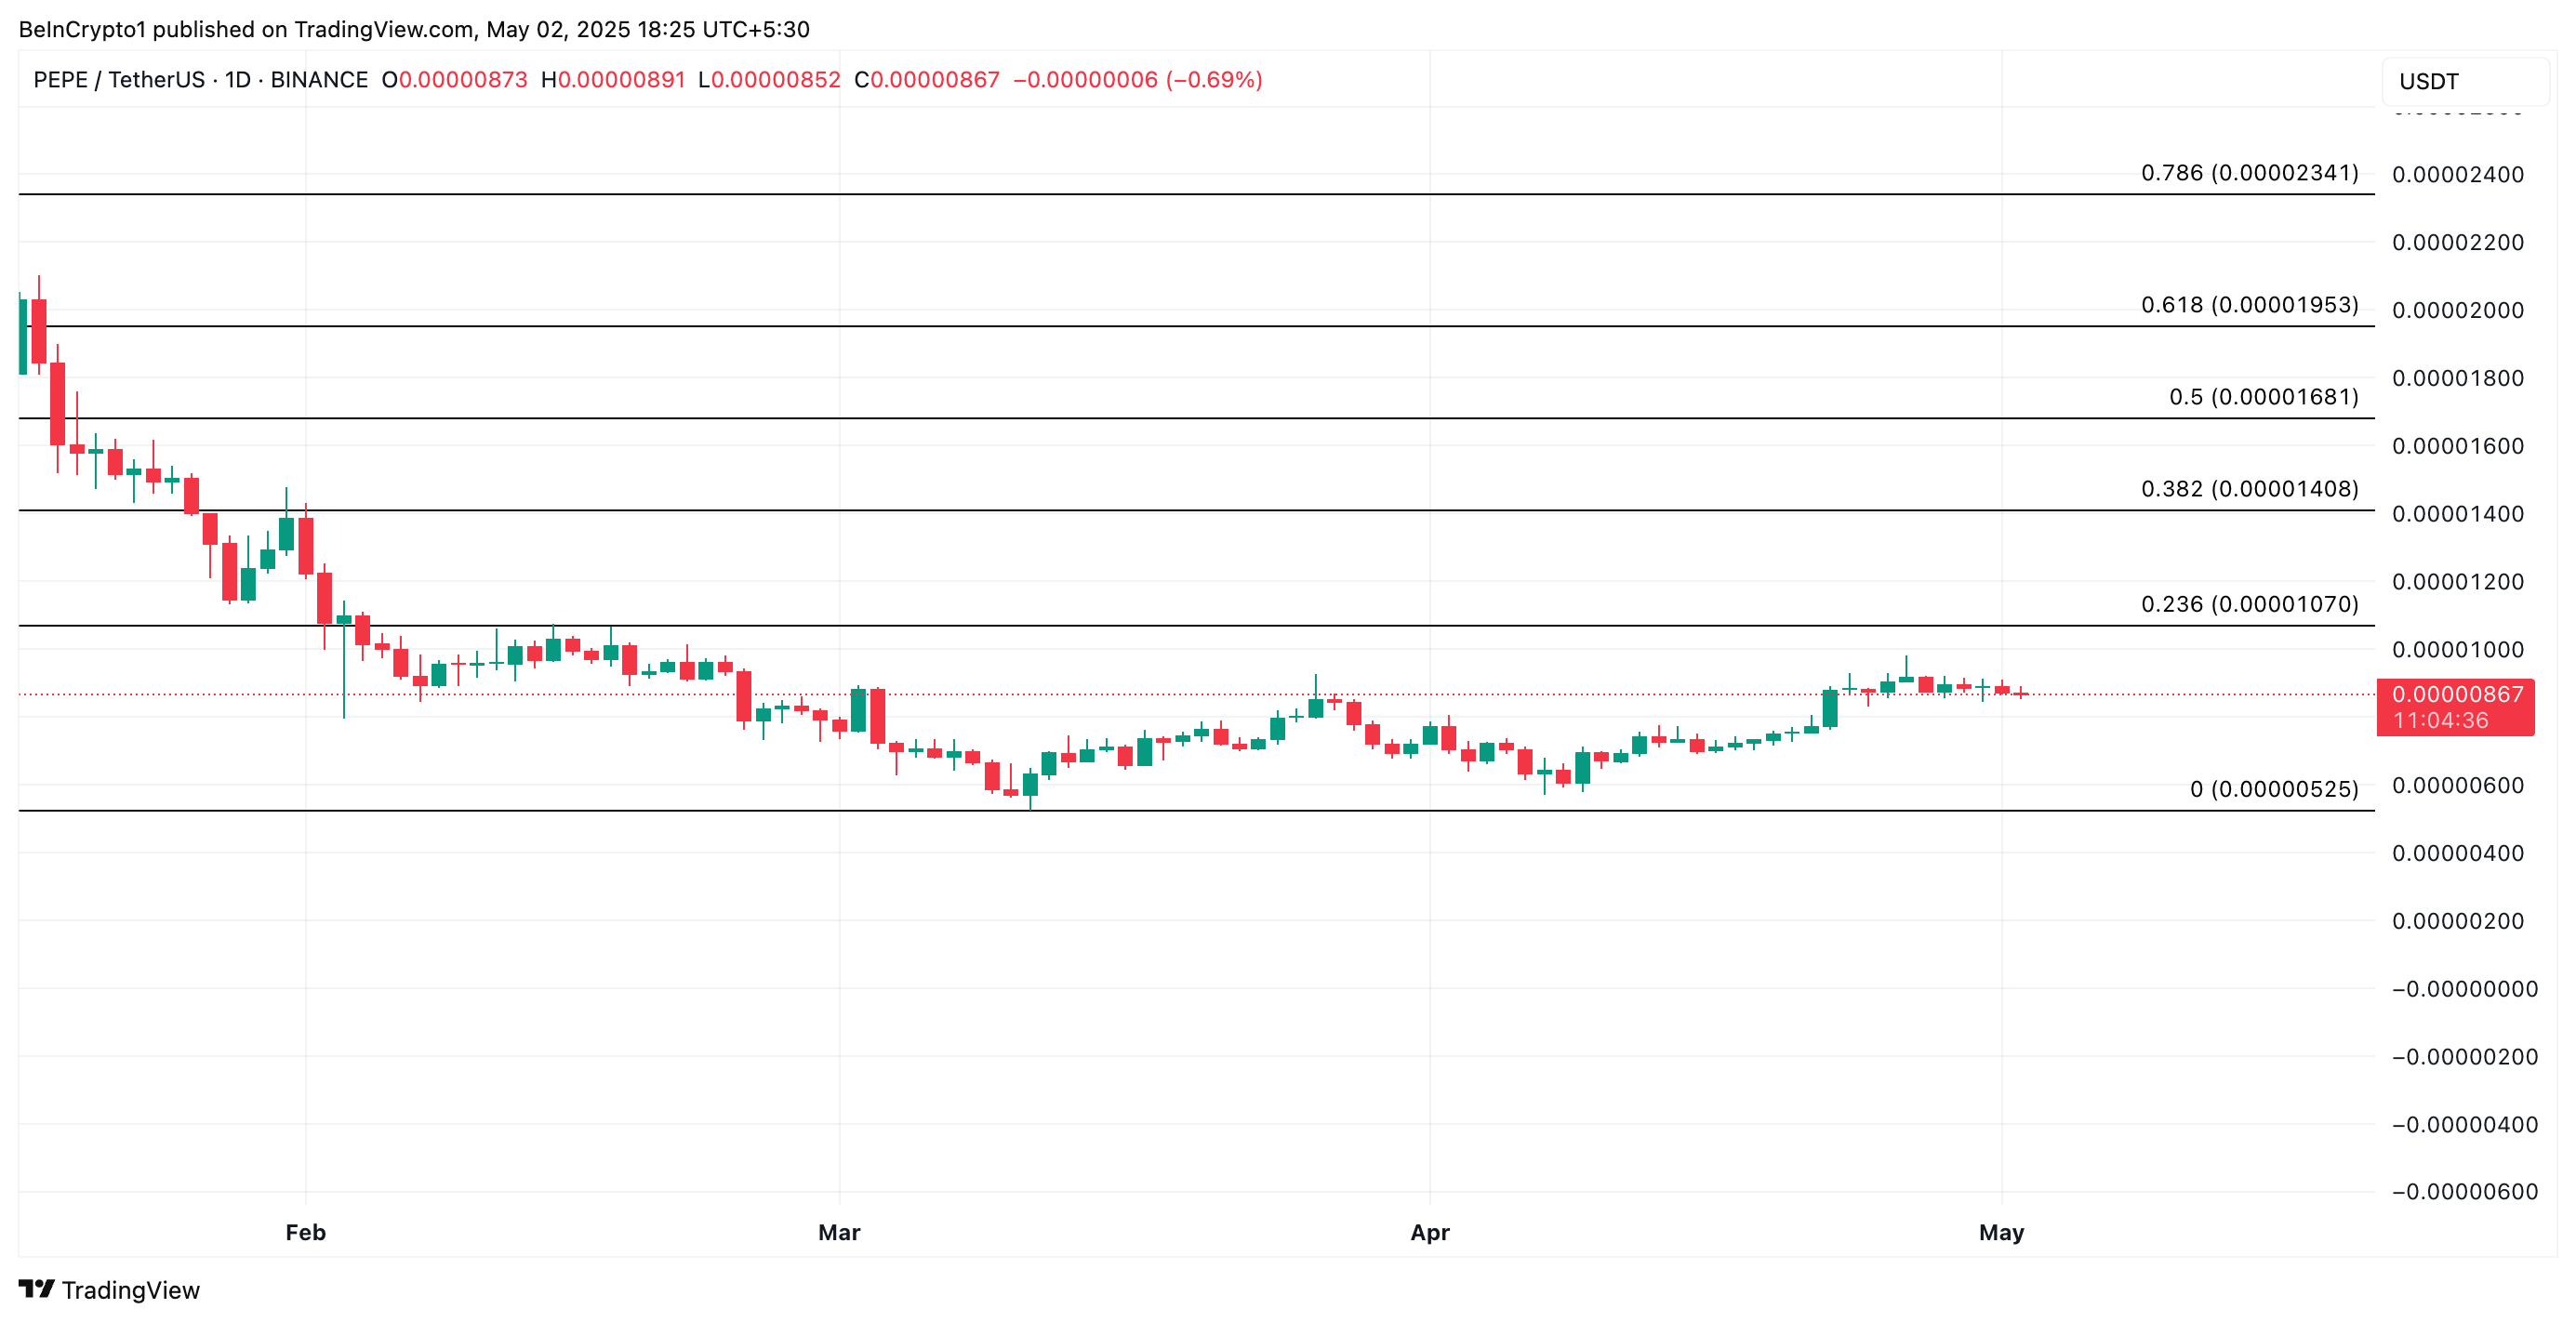
Trading activity has surged as the crypto market gears up for Friday’s White House Crypto Summit. Over the past 24 hours, the total crypto market cap has added $127 billion.
With renewed market interest, several altcoins are gaining investors’ attention today, including Ondo (ONDO), Toncoin (TON), and Bittensor (TAO).
Ondo (ONDO)
RWA-token ONDO is one of today’s trending altcoins. It trades at $1.16 at press time, noting a 15% uptick over the past 24 hours.
On its daily chart, readings from its Elder-Ray Index reflect the bullis bias toward the altcoin. This indicator, which compares the strength of bulls against the bears, is above zero at 0.14.
When an asset’s Elder-Ray Index is positive, its bulls control the market. This indicates that buying pressure is stronger than selling pressure among ONDO holders. It also hints at a potential uptrend continuation as demand pushes the price higher.
If demand continues to soar, ONDO’s price could rally past its immediate resistance at $1.23 to trade at $1.57.
On the other hand, a resurgence in selloffs would invalidate this bullish projection. In that case, ONDO’s price could fall to $1.03.
Toncoin (TON)
Telegram-linked TON is another altcoin trending today. Interestingly, it has bucked the broader market uptrend to record a 0.14% price decline over the past day.
During this review period, its daily trading volume is also down 35%, reflecting the high selling pressure among TON holders. When an asset’s price and trading volume drop simultaneously, it suggests weakening market interest and reduced participation from buyers and sellers.
The trend indicates a loss of momentum in the TON market and hints at more price dips if demand continues to decline. In this scenario, the altcoin’s price could plummet to $2.82. If the bulls cannot defend this level, its price could drop to $2.18.
However, if sentiment becomes bullish and TON demand rockets, its price could reach $3.63.
Bittensor (TAO)
The leading artificial intelligence-based token, TAO, is among today’s most searched altcoins. Amid the general market uptick, its value has also dropped by 1%.
At press time, TAO trades at $289.70, significantly below its Super Trend indicator, which forms dynamic resistance above its price at $414.10.
This indicator measures the direction and strength of an asset’s price trend. It appears as a line on the price chart, changing color based on the current market trend. When green, the market is in an uptrend, while red signals a downtrend.
As with TAO, when an asset’s price trades below the red line of its Super Trend indicator, it is in a bearish trend. This signals that selloffs outweigh buying activity among its market participants. If this continues, TAO’s price could fall to $234.
Made in USA coins are drawing attention heading into the weekend, with five standout tokens leading the charge: EOS, ONDO, SUI, KAS, and EIGEN. EOS surged nearly 7% following a controversial $3 million purchase by World Liberty Financial, while ONDO remains a major RWA player despite short-term volatility.
SUI continues to ride momentum from its meme coin and DEX activity, and Kaspa (KAS) shows strong upside potential with a possible golden cross forming. Meanwhile, EigenLayer (EIGEN) is facing a sharp pullback but still holds bullish signals if support levels can hold.
EOS
EOS is up nearly 7% in the last 24 hours, sparked by World Liberty Financial’s surprise $3 million purchase of the token. The move has stirred controversy across the crypto community, especially given WLFI’s recent $125 million loss from allegedly selling ETH at a local bottom.
While some have raised concerns about potential market manipulation, there’s currently no hard evidence of foul play. EOS, which has spent much of the past year trading below $0.50, briefly surged over 9% following the news, reigniting interest in a project many considered dormant.
Technically, if bullish momentum persists, EOS could break above the key resistance level at $0.88. A clear breakout there may open the door for a run toward the psychological $1 mark.
However, if sentiment shifts and the rally fades, EOS could retest support at $0.663. A break below that would likely trigger further downside, potentially dragging the token back toward the $0.58 region.
Ondo Finance (ONDO)
Real-world asset (RWA) tokenization is gaining serious momentum. The sector reached an all-time high of $22.5 billion, up 5.87% in the last 30 days.
Private credit accounts for $13.1 billion of the total, highlighting growing institutional interest in bridging TradFi with blockchain infrastructure.
Amid this surge, ONDO has emerged as one of the largest players in the RWA space, despite its token price slipping over 3% in the past 24 hours. Still, ONDO is up 16.2% over the last month, reflecting sustained investor confidence in the narrative.
Looking ahead, if bullish sentiment returns, ONDO could test resistance at $1.04. A breakout above that level may push the price toward $1.20.
However, if the correction deepens, the token faces key support levels at $0.86 and $0.819.
Should the downtrend accelerate, ONDO may fall further to $0.73 or even $0.663, making short-term price action heavily dependent on whether the broader hype around RWA and Made in USA coins continues or fades.
SUI
SUI has been gaining traction in recent months thanks to its growing meme coin ecosystem and expanding DEX infrastructure.
While its DEX volume surged 36.7% over the past week, it recorded the smallest increase among the top eight chains and currently ranks sixth in total DEX volume.
Despite this, market interest remains strong, with SUI up 83% in the last 30 days—though it has cooled slightly, slipping 1.25% over the past week.
Technically, SUI’s EMA lines still indicate bullish momentum.
If buyers regain control, the token could test resistance at $3.89, and a breakout there may open the path toward $4.24.
On the downside, if SUI fails to hold support at $3.63, the next targets are $3.27 and potentially $2.92 in the event of further selling pressure.
Kaspa (KAS)
Kaspa (KAS) has delivered strong performance recently, climbing 18.5% in the last seven days and 56.7% over the past month. Its market cap now stands at $3.17 billion, even as 24-hour trading volume has dipped by 20% to $99.38 million.
EMA indicators suggest a potential golden cross formation, which could signal further upside. If momentum continues, KAS may test resistance at $0.155, and a successful breakout could push the price toward $0.188, making it one of the most interesting Made in USA coins for the weekend.
However, if the trend weakens, key support levels lie at $0.114 and $0.103. Losing those could trigger a deeper correction, with downside targets as low as $0.082.
Eigenlayer (EIGEN)
EigenLayer (EIGEN) has seen mixed price action this week—up 16% over the past seven days, but down 11% in the last 24 hours alone.
The recent drop pushed its price below $1.40 and dragged its market cap under the $400 million mark, signaling a potential cooldown after last week’s rally.
Despite the pullback, EIGEN’s EMA lines remain in a bullish formation. If the downtrend continues, the token may test key support at $1.22, with further downside possible toward $1.084 if that level fails.
However, if EigenLayer regains its prior momentum, it could retest resistance at $1.49, and a breakout there may pave the way for a move toward $1.63.
Since April 23, Solana’s price has oscillated within a tight trading range, facing resistance near $153.67 and finding support around $145.68.
A growing wave of bearish pressure threatens to break this range to the downside, with a key technical indicator on the verge of confirming a major sell signal.
Solana Faces Breakdown Risk as Sellers Tighten Grip
SOL’s Moving Average Convergence Divergence (MACD) indicator is poised to form a death cross, a bearish crossover where the MACD line dips below the signal line.
As of this writing, the coin’s MACD line (blue) rests near the signal line (orange), awaiting a catalyst to push it under. This pattern often precedes a sustained downtrend and is widely viewed by traders as a sign of weakening price strength.
Further, SOL’s Balance of Power (BoP) is currently negative, reinforcing the downtrend. This indicates that sellers have gained market control. At press time, this stands at -0.12.
The BoP indicator measures the strength of buying versus selling pressure by comparing the closing price to the trading range over a given period.
When an asset’s BoP is positive, it signals that buyers are in control, indicating strong upward momentum and potential for continued price gain.
On the other hand, as with SOL, a negative BoP value indicates that sellers dominate the market. It suggests an increase in downward pressure on SOL and hints at the potential commencement of a new decline phase.
SOL Faces Key Support Test Amid Mounting Sell Pressure
As bearish momentum builds, SOL risks breaking below the support level at $145.68. A decisive break beneath this threshold would confirm a short-term downtrend and potentially trigger a deeper decline toward $142.32.
Should buyers fail to regain control at that point, SOL could slide further to test the lower support at $133.94.
However, this bearish outlook could be invalidated if fresh demand emerges and buying interest strengthens. In that bullish scenario, SOL may overcome resistance at $153.67, opening the door for a rally toward $171.50.