Shiba Inu (SHIB) price is rangebound in a tight accumulation zone after breaking out of a downtrend. With a massive spike in exchange outflow, the chances of an explosive SHIB rally are not unlikely. Here are some key levels to watch where investors can accumulate this dog-based meme coin.. SHIB Outflow Suggests Accumulation Data from CryptoQuant suggests total SHIB transactions also increased from 6,200 to 7,510. Yet despite the surge in activity, the token’s price remained unmoved. Shiba Inu total transaction count 1 – week chart Historically, a divergence like this with a spike in transaction count and flat price action points to one of two scenarios – accumulation or distribution. An accompanying chart of SHIB’s exchange netflow underscores a bullish case (accumulation). Shiba Inu posted a negative exchange netflow of 111.8 billion tokens on May 20, suggesting a large-scale transfer of the asset from exchanges into self-custody or cold… Read More at Coingape.com
Shiba Inu (SHIB) price sets its eyes on record highs, with two on-chain metrics suggesting that it may skyrocket soon. These metrics hint that the meme coin has entered an accumulation phase, which may renew the bullish momentum and spark an upward trend.
Despite bullish tailwinds, SHIB value today remains subdued and is down by 15% from its April highs of $0.000015. At press time, the coin trades at $0.000013 with a mild 0.03% gain in 24 hours.
Shiba Inu Price Analysis as 108% Rally Looms
The daily chart for Shiba Inu price hints that an explosive rally is looming, as the meme coin teases a breakout from an accumulation zone after overcoming resistance from a descending trendline. The next key level to watch is $0.00001364, and if it can form a decisive close above it, it will flip the market structure to bullish.
If this breakout occurs, and SHIB holds above the MA level of $0.0000182, a reaccumulation phase will likely play out before a potential 108% rally to $0.0000286.
The RSI stands at 54, an indication that the bullish momentum is strong to support an upward trend. However, traders should remain wary of a weakening uptrend as the AO bars suggest that the bullish sentiment is weak.
SHIB/USDT: 1-day Chart
Despite the weak outlook depicted by the AO bars, two key on-chain metrics hint that the 108% will likely out, and the SHIB price could skyrocket soon.
MVRV Ratio, On-Chain Losses Hint At Explosive SHIB Rally
The Shiba Inu Market Value to Realized Value (MVRV) ratio teases that the price of this top meme coin is about to enter an explosive bull market. This metric is at the same level it was in Q3 2024 before a 54% rally ensued within two months, followed by another 94% surge in Q4. This surge saw SHIB clinch a multi-month high of $0.000033 in late 2024.
Shiba Inu MVRV Ratio
If history rhymes and SHIB follows the same trend, and the price skyrockets by 94%, the new target will be $0.0000259. This supports the thesis around a bullish Shiba Inu price prediction and the possibility of fresh highs being formed soon.
Meanwhile, data from Santiment shows that the ratio of daily on-chain transaction volumes in profits and losses has plummeted to 0.24%, marking the lowest level in nearly two months. This indicates that most holders are in losses, a fact that has always preceded a strong bounce as traders are less incentivised to sell.
SHIB Daily On-Chain Transaction Volume in Profit or Loss
If the Shiba Inu price follows previous trends and these on-chain metrics hint towards a rally, the meme coin will skyrocket and potentially reach new record highs. However, this rally faces headwinds considering that traders have been flocking to newer meme coins, which have diverted capital away from older coins.
Michael Saylor and Strategy (formerly MicroStrategy) can make history with their next Bitcoin purchase, sending holdings toward the 600K BTC mark. Saylor has flashed the tell-tale signal for an incoming purchase as corporate adoption soars to previously unseen levels. Michael Saylor To Break Bitcoin Buying Record Strategy founder Michael Saylor has signaled an intention to
The live price of the MANA crypto token is [liveprice sym=”Decentraland”].
MANA price could reach a maximum of $0.33 to $1.10 in 2025.
Decentraland price with a potential surge could go as high as $5.25 by 2030.
Decentraland is a leading community-driven virtual world powered by the Ethereum blockchain, where users can explore, connect, and build using its native ERC-20 token, MANA. Known as one of the top VR metaverse platforms, it continues to grow with regular ecosystem upgrades, strong development activity.
If you’re curious about Decentraland’s future and wondering whether MANA is a good investment, this MANA price prediction 2025–2030 will walk you through its potential growth and long-term outlook
As per the formulated price prediction, the MANA crypto price could hit a potential high of $1.05 in 2025.
This could be possible if the project seeks assistance from developments and collaborations. In contrast, factors like a prolonged bear run could spiral the price down to $0.42.
Year
Potential Low
Potential Average
Potential High
2025
$0.42
$0.73
$1.05
MANA Price Prediction 2025
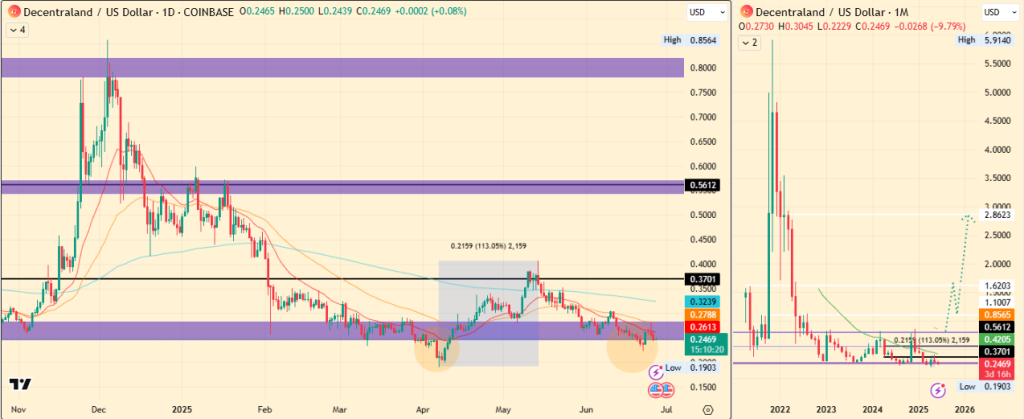
Decentraland’s price has faced significant challenges, plummeting to $0.1903 on April 6, 2025. However, it managed to recover, doubling to $0.3935 by mid-May. Unfortunately, the rest of May saw a decline that has extended to entire June, down almost 38% from the $0.40 mid-May peak.
In June, it has continued to trade below a bearish cross between the 20-day and 50-day EMA bands and bleeding slowly from the support zone.
If this support is breached again, a similar fall that happened in the first week of April could be mimicked, which is raising concerns. As bears return in power, it could lead to a drop in MANA back to the $0.1903 low.
On the other hand, if the ongoing witnessed short-term price bounces back from this support, then in such a case reaching $0.5612 by July is within a possibility. A more ambitious target of $1.10 could also be on the horizon by the end of 2025, provided a strong bullish momentum returns, like the surge seen in Q4 2024.
Still, market participants are likely wondering, “What does the future hold for the MANA price?”
To answer this, examining its multi-year chart is crucial. Since the FTX crash in 2021, MANA has fallen from a high of over $5.91. This long-term activity illustrates its range during both bull and bear markets, which now appears to be a consolidation phase compared to its 2021 peak.
In 2025, MANA is at its lowest point, down 95% from its all-time high. If a revival occurs and MANA manages to clear the $1.10 mark by the end of 2025, it could signal the beginning of a true bullish era for this cryptocurrency.
This table, based on historical movements, shows Decentraland price to reach $5.15 by 2030 based on compounding market cap each year. This table provides a framework for understanding the potential MANA price movements. Yet, the actual price will depend on a combination of market dynamics, investor behavior, and external factors influencing the cryptocurrency landscape.
Market Analysis
Firm Name
2025
2026
2030
Coincodex
$0.37
$0.35
$0.30
priceprediction.net
$0.58
$0.89
$4.19
DigitalCoinPrice
$0.33
$0.61
$3.32
*The targets mentioned above are the average targets set by the respective firms.
Supply and Demand: A spike in supply and demand can help surge the price of this coin to new highs.
Inflation of fiat currencies: Hyperinflation could drive people and governments towards Cryptocurrencies as an alternative.
Governments: Regulations by the government and the Central Bank Digital Currencies (CBDCs) could impact the crypto industry greatly.
Historical Market Analysis
Back to levels under $1, the MANA price trend shows massive upside potential in the next bull market.
CoinPedia has dedicated a team of expert analysts to cover the possible crypto price prediction and sum it all up in one place, just for you!
[article_inside_subscriber_shortcode title=”Never Miss a Beat in the Crypto World!” description=”Stay ahead with breaking news, expert analysis, and real-time updates on the latest trends in Bitcoin, altcoins, DeFi, NFTs, and more.” category_name=”Price Prediction” category_id=”6″]
FAQs
Can Decentraland’s MANA be halved?
No, MANA can neither be halved nor mined.
What will be the potential high of MANA’s price by the end of 2030?
According to our Decentraland price prediction, MANA price could soar as high as $5.15 by the end of 2030.
Is Decentraland a good investment for the long term?
Yes, MANA is a profitable investment in the long term, factoring in the future of the metaverse.
Will the MANA price hit $10 by the end of 2025?
The altcoin could hit a maximum of $1.05 by the end of 2025.
How to buy Decentraland’s MANA?
The digital asset is available for trade across leading cryptocurrency exchange firms such as Coinbase Pro, Binance, Okex, and Huobi Global.
MANA
BINANCE
The post Decentraland Price Prediction 2025, 2026 – 2030: Will MANA Price Hit $1? appeared first on Coinpedia Fintech News
Story Highlights The live price of the MANA crypto token is [liveprice sym=”Decentraland”]. MANA price could reach a maximum of $0.33 to $1.10 in 2025. Decentraland price with a potential surge could go as high as $5.25 by 2030. Decentraland is a leading community-driven virtual world powered by the Ethereum blockchain, where users can explore, …