Bitcoin (BTC) price closed the second week of July in a bullish Morubozu candlestick after consistently rallying above the prior resistance range between $109k and $111,872. The flagship coin has since opened the third week of July in a robust bullish momentum, especially after hitting its all-time high (ATH) of about $122,838 on Monday, during the early European trading session.
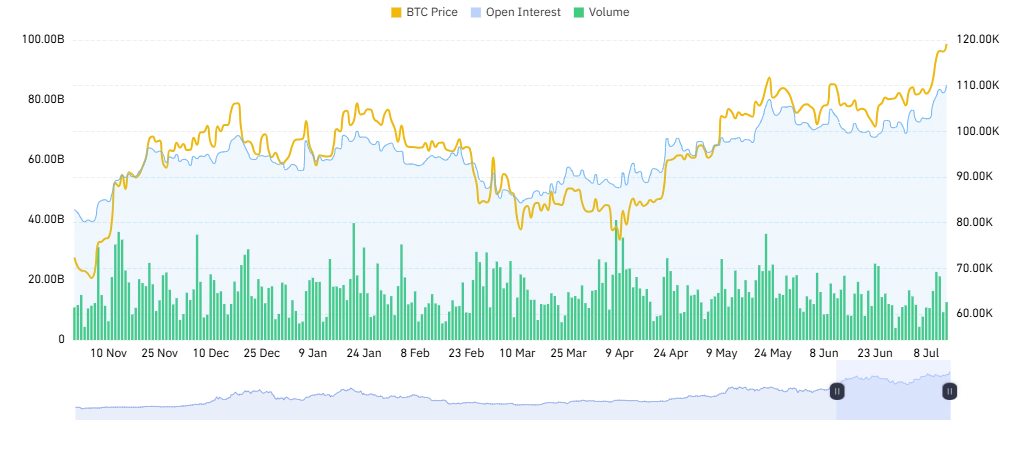
The Bitcoin pump into the price discovery phase is heavily bolstered by the high demand in the spot market amid record peaks in futures and derivatives trading. According to market data from Coinglass, Bitcoin’s Open Interest (OI) surged to a new ATH of $85 billion amid heavy liquidation of short traders.
Vanguard Joins the Bitcoin Wagon
For the past years, Vanguard Group Inc., has given pessimistic views on Bitcoin and the wider crypto market. The Pennsylvania-based asset manager, with around $10 trillion in assets under management, referred to Bitcoin as inappropriate for long-term investors.
However, recent U.S. SEC filings show a different picture. The Vanguard Group owns more than 20 million shares, nearly 8 percent of Strategy Inc., a top-holder of Bitcoin with 601,550 coins at the time of this writing.
Remarkably, Vanguard has possibly surpassed Capital Group as the top investor of Strategy.
What’s Next for BTC Price?
As Coinpedia has pointed out, BTC price is now in the euphoric phase of the 2024/2025 crypto bull market catalyzed by the rising demand from institutional investors and clear regulatory frameworks. From a technical analysis standpoint, BTC’s bullish sentiment is bolstered by the weekly Relative Strength Index (RSI) that recently surged above the 70 level for the first time year to date.
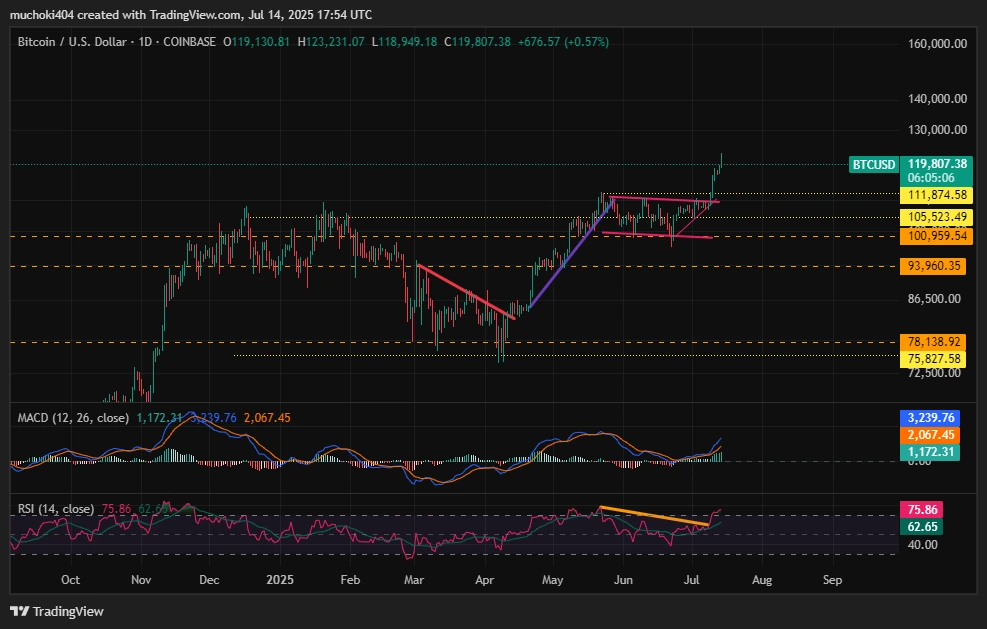
Additionally, the weekly MACD indicator shows an increasing bullish histogram with the MACD line above the zero line.
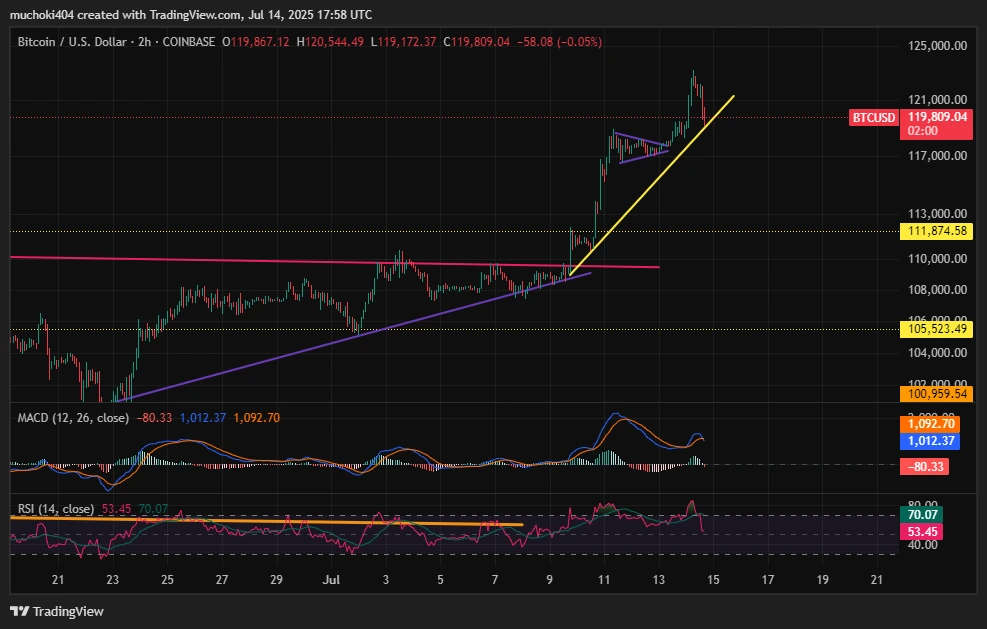
In the 2-hour timeframe, the bullish sentiment is visible through higher highs and higher lows, an established characteristic of a rising trend. As a result, it is safe to say that a rally towards $150k is much more likely to happen than a drop below $100k in the near term.
Welcome to the US Crypto News Morning Briefing—your essential rundown of the most important developments in crypto for the day ahead.
Grab a coffee for another read about Bitcoin (BTC) from Max Keiser, one of the most popular pioneers. His latest comments come amid soaring Bitcoin price, with the king of crypto progressively threatening to sidestep fiat money.
Crypto News of the Day: Max Keiser Says Bitcoin Could Hit $220,000 in 2025
In a recent US Crypto News publication, BeInCrypto reported Max Keiser’s prediction that Bitcoin would hit $200,000, a move that he said would alter global finance.
“At $200,000 BTC, we trigger the tipping point when millions of Bitcoiners have the wherewithal and political will to opt out of the banking system and the nation state. I am already seeing this in El Salvador. And the trickle will become a raging torrent at $200,000. And this is just the beginning,” Keiser told BeInCrypto.
The Bitcoin pioneer has revised his target, noting that Bitcoin could hit $220,000 this year. What may have prompted this change in outlook, and more importantly, why the urgency with 2025 halfway in?
Keiser’s bullish forecast for Bitcoin comes amid the pioneer crypto’s growing influence in mainstream finance. A recent US Crypto News publication pointed to this effect, indicating BlackRock’s BTC stash nearing that of Satoshi Nakamoto.
“I offer a solution for trump’s fiat money addiction, fiat money addicts need to find their bottom, and be willing to hear the message of Bitcoin. When Trump is ready to recover, Bitcoin will still be here, just a lot higher in price,” Keiser said.
The Bitcoin maxi referenced a 2022 interview where he had also forecasted a Bitcoin rally to $220,000.
Bitcoin up 700% since this interview 2 years ago (and $220,000 in 2025 looks likely).
Despite skepticism for his 2022 predictions, the pioneer crypto’s value has grown by nearly 600% from the depths of $16,000. This traction lends credibility to the forecast despite the volatility characteristic of the industry.
Beyond fundamentals, technicals also align with John Bollinger, inventor of the Bollinger indicator, who predicted a Bitcoin price breakout, as reported in another US Crypto News publication.
“Bitcoin looks to be setting up for an upside breakout as the week gets going,” Bollinger wrote in a post.
While optimism still abounds, Bitcoin price nicked a new all-time high (ATH), topping out at $111,999 on Binance. As of this writing, BTC was trading for $110,849, up 1.25% in the last 24 hours.
With prospects for further upside, Max Keiser declined to give the date he expects Bitcoin to hit $220,000, citing a need to keep markets calm.
“If I gave you both the price and date most of you would be scared,” Keiser added.
Like Keiser, Standard Chartered also forecasted a rally for Bitcoin, citing $135,000 in Q3 and $200,000 by Q4. Meanwhile, others like BitMEX co-founder Arthur Hayes are even more optimistic, anticipating a $250,000 per BTC target for Bitcoin this year.
However, Hayes’ forecast is contingent on the Federal Reserve (Fed) shifting to quantitative easing (QE).
Nearly $7.4 Trillion Parked in Money Market Funds
Meanwhile, data according to Barchart shows up to $7.397 in money market funds (MMFs). This marks a modest surge from a month ago, when BeInCrypto reported $7.24 trillion in these investment vehicles.
A staggering $7.4 Trillion is now sitting in Money Market Funds, a new all-time high pic.twitter.com/AQVGlBYpwv
This marks a new all-time high (ATH) for assets in MMFs, suggesting investors may be seeking safety amid economic uncertainty. MMFs are low-risk investments offering liquidity and yields.
With this capital signaling sidelined liquidity, some analysts view this cash buildup as a signal of market hesitation that could pivot bullish. If the capital is channeled toward Bitcoin, it could catalyze a breakout amid rising global liquidity, as indicated in a recent US Crypto News publication.
“It [money parked in MMFs] is capital that doesn’t trust the system…The moment Bitcoin confirms itself as the reserve-grade escape valve, even a 5% rotation from that $7T pile would obliterate supply and launch BTC into a new monetary regime,” Crypto strategist SightBringer said recently.
However, other analysts hold a more measured opinion, saying that capital held in MMFs must be viewed in proportion to total market capitalization.
Macro analysts argue that despite trillions held in money market funds, investors could have less dry powder than many believe relative to the equity market size.
“I’ve noticed a common narrative suggesting that the surge in money market funds means there’s a large amount of cash sitting on the sidelines. That couldn’t be further from the truth, in my view,” macro analyst Otavio Costa challenged.
On Tuesday morning, US President Donald Trump announced that a ceasefire between Israel and Iran was now “in effect,” offering relief from days of sustained pressure across global markets.
Following the announcement, major digital assets, including Bitcoin and Ethereum, have seen modest rebounds. As crypto prices increase, attention is turning to US-listed crypto-related equities that may benefit from renewed momentum.
LQWD Technologies (LQWD)
LQWD rose 107% during Monday’s trading session, making it one of the crypto stocks to watch as the market rebounds today.
This three-digit spike followed the company announcement of the grant of 788,000 stock options to its team, signaling internal confidence and long-term commitment. The options, priced at C$3.70 (approximately $2.70 USD) and vesting over 24 months, suggest strategic alignment among executives and stakeholders.
Readings from the LQWD/USD one-day chart show that the stock climbed to an all-time high of $9.34 during Monday’s session. On that day, its Chaikin Money Flow (CMF) also rose to a high of 0.76, confirming the high demand for the stock.
If demand remains high once trading begins today, LQWD could rally to new price peaks.
On the other hand, if it sees a surge in profit-taking, it could fall to $7.22.
IREN Limited (IREN)
IREN shares are up 2% in pre-market trading on Tuesday, still enjoying momentum following the issuer’s successful closing of a $550 million offering of 3.50% convertible senior notes due 2029.
On the daily chart, IREN’s Relative Strength Index (RSI) is at 65.34 and is in an uptrend, signalling a high demand for the asset.
The RSI indicator measures an asset’s overbought and oversold market conditions. It ranges between 0 and 100. Values above 70 suggest that the asset is overbought and due for a price decline, while values under 30 indicate that the asset is oversold and may witness a rebound.
IREN’s RSI, at 65.34, confirms the buy-side pressure. If this persists, the stock’s price could climb to $11.72.
However, if demand falls, the stock’s value could fall toward $10.46.
BIGG Digital Assets Inc (BIGG)
BIGG Digital Assets shares are climbing today following the launch of a new PlayStar Casino activation within its immersive virtual platform, the Intraverse, developed by its subsidiary TerraZero Technologies.
The initiative allows users to access the virtual casino directly via mobile or desktop. It generates affiliate revenue for each verified account sign-up and drives organic traffic through upcoming artist-led campaigns and customizable fan experiences.
BIGG closed strongly on Monday, with the stock surging by 4%. If trading volume climbs further once trading resumes today, BIGG could extend its gains and climb toward $0.135.
Solana (SOL) has been struggling below $150 since March 3, with its technical indicators still pointing to a bearish trend. The number of Solana whales has declined in recent days, suggesting some large holders may be reducing exposure.
Meanwhile, Solana’s total value locked (TVL) remains below $10 billion, highlighting weakening engagement in its DeFi ecosystem. For SOL to regain bullish momentum, it would need renewed whale accumulation, a recovery in TVL, and a breakout above key resistance levels.
Solana TVL Stuck Below $10 Billion Since February 22
Solana’s total value locked (TVL) has been steadily declining. It is currently at $8.87 billion, and the last time it surpassed $10 billion was February 22.
TVL represents the total amount of assets deposited in a blockchain’s decentralized finance (DeFi) protocols, serving as a key indicator of network activity and investor confidence.
A higher TVL suggests strong ecosystem engagement, while a declining TVL can indicate reduced liquidity and fading interest.
With Solana’s TVL continuing to drop, it raises concerns about potential weakening demand for its DeFi ecosystem, which could impact SOL’s price, at a moment when the chain and some of its major players have been suffering criticism from the community.
A declining TVL often reflects lower capital inflows and reduced activity in lending, staking, and trading protocols, limiting upward price momentum.
For Solana’s bullish case to strengthen, its TVL would need to stabilize and recover, signaling renewed investor confidence and increased network utility.
Whales Stopped Accumulating SOL
The number of Solana whales – addresses holding at least 10,000 SOL – grew between February 28 and March 3, rising from 4,953 to 5,053. However, since then, the number has steadily declined, now sitting at 5,023.
Tracking whale activity is crucial because large holders can influence market trends. Accumulation often signals confidence in price appreciation, and distribution often indicates potential selling pressure.
A sustained increase in whale numbers typically suggests strong demand, while a decline can hint at weakening sentiment.
With the recent drop in Solana whale addresses, there are concerns that some large holders may be reducing exposure, which could create selling pressure on SOL.
If this trend continues, it could limit upward momentum and lead to price consolidation or declines.
However, if whales resume accumulation, it would indicate renewed confidence in Solana’s long-term prospects, potentially supporting a stronger price recovery.
Solana Still Struggles to Breach $150
Solana’s EMA lines indicate that the current setup remains bearish, with short-term averages still positioned below long-term ones.
This alignment suggests that downward pressure persists, limiting immediate upside potential.
However, if the trend reverses and buying momentum strengthens, SOL could climb toward $160.7, and a breakout above this level could push it further to test the $180 resistance.
On the downside, if bearish momentum intensifies, Solana price could retest support at $130.
A breakdown below this level could drive the price lower, potentially testing $125.